




Abstract
Background:
Due to loss of hormonal protective effects, postmenopausal women have an increased cardiovascular (CV) risk. Chronic kidney disease (CKD) is a well-established risk factor for CV disease, but little is known whether mild-to-moderate kidney dysfunction is associated with atherosclerosis burden in the postmenopausal asymptomatic women.
Materials and Methods:
Subclinical atherosclerosis was evaluated in 125 postmenopausal women with no clinical form of atherosclerosis, by carotid and femoral ultrasonography, ankle-brachial index (ABI), and flow-mediated dilation (FMD). Carotid and femoral atherosclerosis were defined as increased intima–media thickness (IMT) and/or the presence of plaques. Endothelial function was assessed by endothelial dependent (flow-mediated dilation at 1 minute [FMD1]) and independent (flow-mediated dilation after nitroglycerin [FMDNTG]) vasodilation. Classical CV risk factors (age, smoking, obesity, diabetes, blood pressure, and lipids) were evaluated. Kidney function was evaluated in terms of estimated glomerular filtration rate (eGFR) calculated by the CKD-EPI formula. Univariate linear regression and multivariate logistic regressions were used to evaluate the independent associations between kidney function and markers of subclinical atherosclerosis.
Results:
In the unadjusted linear analysis, eGFR showed a significant negative association with markers of subclinical atherosclerosis: carotid IMT (R2 = 0.305; p < 0.001), femoral IMT (R2 = 0.19, p < 0.001), carotid plaques (R2 = 0.22; p < 0.001), femoral plaques (R2 = 0.09; p = 0.0005), ABI (R2 = 0.05; p = 0.01), FMD1 (R2 = 0.45; p < 0.001), and FMDNTG (R2 = 0.205, p < 0.001). After adjustment for classical CV risk factors the association remained significant.
Conclusions:
Mild-to-moderate reduced eGFR is related to subclinical atherosclerosis, independent of traditional CV risk factors. It is important to detect renal function decline, even if it is mild, to improve risk stratification of subclinical atherosclerosis in postmenopausal women.
Introduction
C
Despite these evidences, the importance and severity of atherosclerotic disease in women are always underestimated. 7 Given the worldwide health and economic implications of CVD in postmenopausal women, there is strong reason to sustain efforts to recognize and to control the potential contributors to this increased level of cardiovascular (CV) risk. 1
Several previous reports demonstrated a possible contribution of even mild-to-moderate estimated glomerular filtration rate (eGFR) decline to atherosclerosis. 8 –10 Furthermore, chronic kidney disease (CKD) might be a potential independent risk factor for atherosclerosis. 8,9 The high prevalence of atheromatous disease in CKD populations, even in the early stage of CKD, suggests the existence of specific risk factors that favor the atheromatous process. Thus, CKD is frequently associated with changes in lipid and glucose metabolism, increased levels of inflammation, thrombosis and oxidative stress, blood pressure, and endothelial damage. 11 However, the role of renal function as an independent risk factor remains controversial as reported in several community-based studies. 12 Moreover, the association between lower eGFR and CVD is less clear within the mildly impaired range. The association between kidney function and CVD is complex. Risk factors for CVD also predict impaired kidney function. Impaired kidney function may be a marker for subjects with a worse CVD risk profile and not biological risk factors per se for subsequent CVD. 13 Clinical studies examining the relationship between GFR and atherosclerosis in the postmenopausal women were limited. 14
In our study, we determined whether mildly to moderately decreased eGFR is associated with significant atherosclerosis markers in postmenopausal women without CV symptomatology.
Materials and Methods
Study subjects
This is a prospective observational study which included 125 women with a mean age of 62.40 ± 8.95 years, who have been hospitalized in the Cardiology Clinic for 3 months (July to September 2015) for other pathology than atherosclerosis. Inclusion criteria were physiological menopause for at least 5 years, lack of any clinical form of atherosclerosis, and eGFR more than 30 mL/min/1.73 m2. Clinical atherosclerotic disease was defined as presence in present or in history of any stroke, transient ischemic attack, ischemic heart disease (documented by history of myocardial infarction, acute coronary syndrome, percutaneous coronary intervention or coronary artery bypass grafting, electrocardiography at rest, stress test, classic angiography or multislice angiocoronarography-computed tomography, identifying at least one of >50% coronary stenosis), peripheral arterial disease Fontaine stage II-IV, and aortic aneurysm.
We assessed CV risk factors, and we documented subclinical atherosclerosis by performing carotid and femoral vascular ultrasound, ankle-brachial index (ABI), and flow-mediated vasodilation.
The study was conducted according to the principles of the Declaration of Helsinki and approved by the Ethics Committee of the University of Medicine and Pharmacy “Victor Babes,” Timisoara. Informed consent was obtained from each participant.
Laboratory analyses and clinical methods
CV risk factors were evaluated in all patients: age, gender, smoking, obesity, hypertension, diabetes, and dyslipidemia.
Blood pressure was measured according to current guidelines. 15 Hypertension was defined as values ≥140 mmHg systolic blood pressure (SBP) and/or ≥90 mmHg diastolic blood pressure (DBP). 15 Diabetes mellitus (DM) was defined if fasting plasma glucose was ≥7.0 mmol/L (126 mg/dL) on two repeated measurements, and/or HbA1c >7% (53 mmol/mol), and/or postload plasma glucose >11.0 mmol/L (198 mg/dL). Obesity was defined if body mass index exceeded 30 kg/m2. All smokers were active; none of the patients were under alcohol consumption and none of the patients were doing regularly physical exercise.
All patients underwent laboratory investigations which comprised the following parameters: serum creatinine (the Jaffe method), serum cholesterol (the CHOD-PAP method), triglycerides (the GPO-PAP method), high-density lipoprotein (HDL) cholesterol (the Sodium-Phosphotungstate-magnesium colorimetric method), high-density lipoprotein (LDL) cholesterol (Friedewald formula: LDL = TC − HDL − TG/5.0 [mg/dL]), and glycemia (the glucose oxidase method). Evaluation of renal function was based on the eGFR. For all participants the eGFR was calculated according to the CKD-EPI creatinine equation that estimates the GFR (eGFR) from the following formula:
where Scr is serum creatinine (mg/dL), κ = 0.7 for females and 0.9 for males, α is −0.329 for females and −0.411 for males, min indicates the minimum of Scr/κ or 1, and max indicates the maximum of Scr/κ or 1. 16
Serum and plasma samples were obtained after an overnight fast of at least 8 hours.
We chose the eGFR cutoffs according to the GFR categories recommended by KDIGO Clinical Practice Guideline for Evaluation and Management Of CKD from 2012: group with normal GFR (eGFR ≥90 mL/min/1.73 m2), group with mildly decreased GFR (eGFR between 60 and 90 mL/min/1.73 m2), and group with moderately decreased GFR (eGFR between 30 and 60 mL/min/1.73 m2). 17
Ultrasound analysis
Vascular ultrasonography was performed with an ALOKA equipment with software for the measurement of intima–media thickness (IMT) and linear transducer of 7.5 − 10 MHz frequency. Bilateral common carotid arteries, carotid bifurcation, and the internal and external carotid arteries were examined. We measured mean IMT in the left and right common carotid artery and evaluated the presence of plaques. The measurement was electronically made taking into account the average value of IMT in the far wall, using approved protocols. 18,19 Normal upper limit value for IMT was considered 0.9 mm, according to the current consensus. 20 Atheromatous parietal plaque was defined as thickening of the artery wall more than 1.5 mm measured at the far wall from intima-lumen interface to medium-adventitia interface and, distinct from the adjacent edges by at least 50% or greater IMT value in the same place or structure protruding into the lumen at least 0.5 mm. 20 Bilateral common femoral artery and bifurcation and proximal region of the superficial and deep femoral arteries were also examined. IMT was measured in superficial femoral artery immediately after the common femoral artery bifurcation, using the same principles as for carotid IMT.
The measurement of ABI
ABI was measured according to current guidelines. 21,22 It was done with an 8 MHz probe of a continuous Doppler detector with the patient in supine position, at rest for at least 5 minutes. Blood pressure was measured in both arms and the highest value was noted; then it was measured in both calves, at the posterior tibial artery and the highest value was noted; ABI was calculated using the formula: ABI = leg BP/arm BP. A value between 0.91 and 1.4 was considered normal.
Flow-mediated vasodilation of the brachial artery
Assessment of endothelial function was performed by flow-mediated dilation (FMD) technique, respecting the conditions of examination according to international consensus. 23 –25 Initially, SBP was measured in the arm. Then the cuff was placed on the forearm. Brachial artery was visualized in color Doppler Mode B. The basal diameter (Dbasal) of the brachial artery was measured in B mode, in longitudinal section at about 5 cm proximal to the antecubital fold. Then the manometer cuff was inflated to a 50 mmHg above SBP at the same arm and kept inflated for 5 minutes. One minute after deflation brachial artery diameter was determined again. After 10 minutes of rest, while the diameter of the brachial artery returned to baseline, 0.4 mg sublingual nitroglycerin was administered. Three minutes after the administration the measurement was repeated. For each moment FMD was calculated as a percentage of growth in diameter from baseline, following formula: FMD (%) = (D − Dbasal) × 100/Dbasal. In this way, values of endothelial dependent vasodilation at 1 minute (flow-mediated dilation at 1 minute [FMD1]) and endothelial independent vasodilation after nitroglycerin (flow-mediated dilation after nitroglycerin [FMDNTG]) were obtained.
Statistical analysis
Data were collected and analyzed using the SPSS v.17 software suite (SPSS, Inc., Chicago, IL) and are presented as mean ± standard deviation for continuous variables with Gaussian distribution, median (interquartile range) for continuous variables without Gaussian distribution, or percentages for categorical variables. Depending on the distribution of the values, differences between subgroups were analyzed with the Student t-test (means, Gaussian populations), Mann–Whitney U test (medians, non-Gaussian populations), Fisher test (proportions), respectively, analysis of variance (ANOVA) test (means, Gaussian populations) or Kruskal–Wallis test (medians, non-Gaussian populations) and Chi-square for trend (proportions) for the comparison of three groups. Continuous variable distributions were tested for normality using Shapiro–Wilk test and for equality of variances using Levene's test. In case of multiple comparisons, adjustments were performed: Bonferroni, Tukey's, and Omnibus tests. Pearson's or Spearman's correlation coefficients were calculated to indicate the associations between eGFR and atherosclerosis markers. Linear regression models were built to assess the independent association between eGFR and markers of atherosclerosis.
Results
The clinical and biological characteristics of the postmenopausal women studied are shown in Table 1.
Group with moderately reduced renal function: eGFR <60, ≥30 mL/min/1.73 m2; Group with mildly reduced renal function: eGFR <89, ≥60 mL/min/1.73 m2; Group with normal renal function: eGFR ≥90 mL/min/1.73 m2.
Data are presented as mean ± standard deviation; p was calculated with student t-test. Continuous variable distributions were tested for normality using Shapiro–Wilk test and for equality of variances with Levene's test.
Differences are significant.
Data are presented as number of cases and percentage from the total of the subgroup; p was calculated with Fisher's exact test.
Distributions are not Gaussian. Data are presented as median and interquartile range; p was calculated with Mann–Whitney U test.
p **, ANOVA test (means, Gaussian populations) or Kruskal–Wallis test (medians, non-Gaussian populations) and Chi-square for trend (percentages) for the comparison of the three groups.
ACE, angiotensin converting enzyme; ADOs, antidiabetic oral medications; AHT, arterial hypertension; ANOVA, analysis of variance; DBP, diastolic blood pressure; DM, diabetes mellitus; eGFR, estimated glomerular filtration rate; HDLc, high-density lipoprotein cholesterol; LDLc, low-density lipoprotein cholesterol; SBP, systolic blood pressure; TGL, triglycerides.
A total of 60 subjects (48%) had hypertension, 20 subjects (16%) had DM, and 35 subjects (28%) were obese. Twenty-nine percent of the women (n = 36 subjects) were current smokers.
The three groups of patients were homogenous in terms of age: 64.3 ± 7.61 years in the group with moderately decreased eGFR, 62.02 ± 11.12 years in mildly decreased eGFR group, and 61.12 ± 7.99 years in the group with normal eGFR (p = 0.24, ANOVA test). Systolic and DBP values, triglycerides, and cholesterol HDL were similar among the three groups. We found significant differences in the total cholesterol level, which was higher in the group with moderately versus mildly decreased eGFR (p = 0.01), in the group with moderately decreased eGFR versus normal eGFR (p = 0.0001), and in the LDL cholesterol level that was higher in group with mildly decreased eGFR versus normal eGFR (p = 0.02) and in the group with moderately decreased eGFR versus normal eGFR (p < 0.001). In the group with moderately decreased eGFR there were more hypertensive patients compared to the group with normal eGFR (p = 0.002) and in the group with normal eGFR there were more smokers versus group with moderately decreased eGFR (p = 0.0001) and group with mildly decreased eGFR (p = 0.04). There were no significant differences noted in the prevalence of obesity among the three groups. Regarding diabetes there were fewer cases in with normal eGFR versus group with moderately decreased eGFR or group with mildly decreased eGFR.
The relationship between eGFR and carotid subclinical atherosclerosis
Carotid IMT values were significantly higher in the group with moderately decreased eGFR versus mildly decreased eGFR (0.94 ± 0.14 mm vs. 0.77 ± 0.18 mm, p < 0.001), in the group with mildly decreased eGFR versus normal eGFR (0.77 ± 0.18 mm vs. 0.53[0.24] mm, p < 0.001), and in the group with moderately decreased eGFR versus normal eGFR (0.94 ± 0.14 mm vs. 0.53 [0.24] mm, p < 0.001) (Table 2). Assuming a pathological cutoff value of 0.9 mm for IMT, there were 25 (62%) patients with values above 0.9 mm in the group with moderately decreased eGFR, 8 patients (22%) in the group with mildly decreased eGFR, and 5 patients (10%) in the group with normal eGFR. The number of patients with pathologic IMT was significantly higher in the group with moderately versus mildly decreased eGFR (p = 0.0005), in the group with moderately decreased eGFR versus normal eGFR (p < 0.0001), and similar between groups with mildly decreased eGFR and normal eGFR (p = 0.22).
Group with moderately reduced renal function: eGFR <60, ≥30 mL/min/1.73 m2; Group with mildly reduced renal function: eGFR <89, ≥60 mL/min/1.73 m2; Group with normal renal function: eGFR ≥90 mL/min/1.73 m2.
Distributions are not Gaussian. Data are presented as median and interquartile range; p was calculated with Mann–Whitney U test.
Differences are significant.
Data are presented as number of cases and percentage from the total of the subgroup; p was calculated with Fisher's exact test.
Data are presented as mean ± standard deviation; p was calculated with student t-test. Continuous variable distributions were tested for normality using Shapiro–Wilk test and for equality of variances with Levene's test.
p **, ANOVA test (means, Gaussian populations) or Kruskal–Wallis test (medians, non-Gaussian populations) and Chi-square for trend (percentages) for the comparison of the three groups.
ABI, ankle-brachial index; FMD1, flow-mediated dilation at 1 minute; FMDNTG, flow-mediated dilation after nitroglycerin; IMT, intima–media thickness.
The prevalence of asymptomatic carotid plaques was significantly higher in the group with moderately decreased eGFR versus normal eGFR (p < 0.001) and in the group with mildly decreased eGFR versus normal eGFR (p < 0.001), respectively, without statistical significance between groups with moderately decreased eGFR versus mildly decreased eGFR (p = 0.31) (Table 2).
The relationship between eGFR and femoral subclinical atherosclerosis
Femoral IMT values were significantly higher in the group with moderately versus mildly decreased eGFR (0.69 ± 0.22 mm vs. 0.59 ± 0.18 mm, p = 0.02), in the group with mildly decreased eGFR versus normal eGFR (0.59 ± 0.18 mm vs. 0.45[0.07] mm, p = 0.004), and in the group with moderately decreased eGFR versus normal eGFR (0.69 ± 0.22 mm vs. 0.45[0.07] mm, p < 0.0001).
The prevalence of asymptomatic femoral plaques was significantly higher in the group with moderately decreased eGFR versus normal eGFR (p < 0.001) and in the group with mildly decreased eGFR versus normal eGFR (p = 0.01) and there was no statistical significance between the group with moderately versus mildly decreased eGFR (p = 0.48).
The relationship between eGFR and ABI
In the studied groups, ABI values were lower in the group with moderately decreased eGFR versus normal eGFR (p = 0.003), similar values in groups with mildly decreased eGFR and normal eGFR (p = 0.28), respectively, group with moderately versus mildly decreased eGFR (p = 0.18) (Table 2).
Pathological ABI values below 0.9 were recorded in eight patients (20%) in the group with moderately decreased eGFR, five patients (13%) in the group with mildly decreased eGFR, and five patients (10%) in the group with normal eGFR, with no significant differences between groups.
The relationship between eGFR and endothelial function assessed by FMD
Endothelium-dependent vasodilation measured by FMD1 was significantly different between groups (p < 0.0001, ANOVA test), lower in the group with moderately versus mildly decreased eGFR (p < 0.0001), in the group with mildly decreased eGFR versus normal eGFR (p = 0.009), and in the group with moderately decreased eGFR versus normal eGFR (p < 0.0001) (Table 2). FMD values below 7% indicating endothelial dysfunction were recorded in 36 patients (90%) in the group with moderately decreased eGFR, 6 patients (16%) in the group with mildly decreased eGFR, and in 1 patient (2%) of the group with normal eGFR.
Endothelium-independent vasodilation measured by FMD after administration of nitroglycerine (FMDNTG) was significantly different between groups (p < 0.0001, ANOVA test), lower in the group with moderately versus mildly decreased eGFR (p = 0.007), respectively, in the group with moderately decreased eGFR versus normal eGFR (p < 0.0001), and not significant between group with mildly decreased eGFR versus normal eGFR (p = 0.08) (Table 2).
The relationship between eGFR and markers of atherosclerosis is presented in the figures. Figure 1 shows the relationship between eGFR and carotid IMT. The relationship between eGFR and ABI is presented in Figure 2, the association between eGFR and FMD1 is presented in Figure 3, respectively, the relationship between eGFR and FMDNTG in Figure 4.
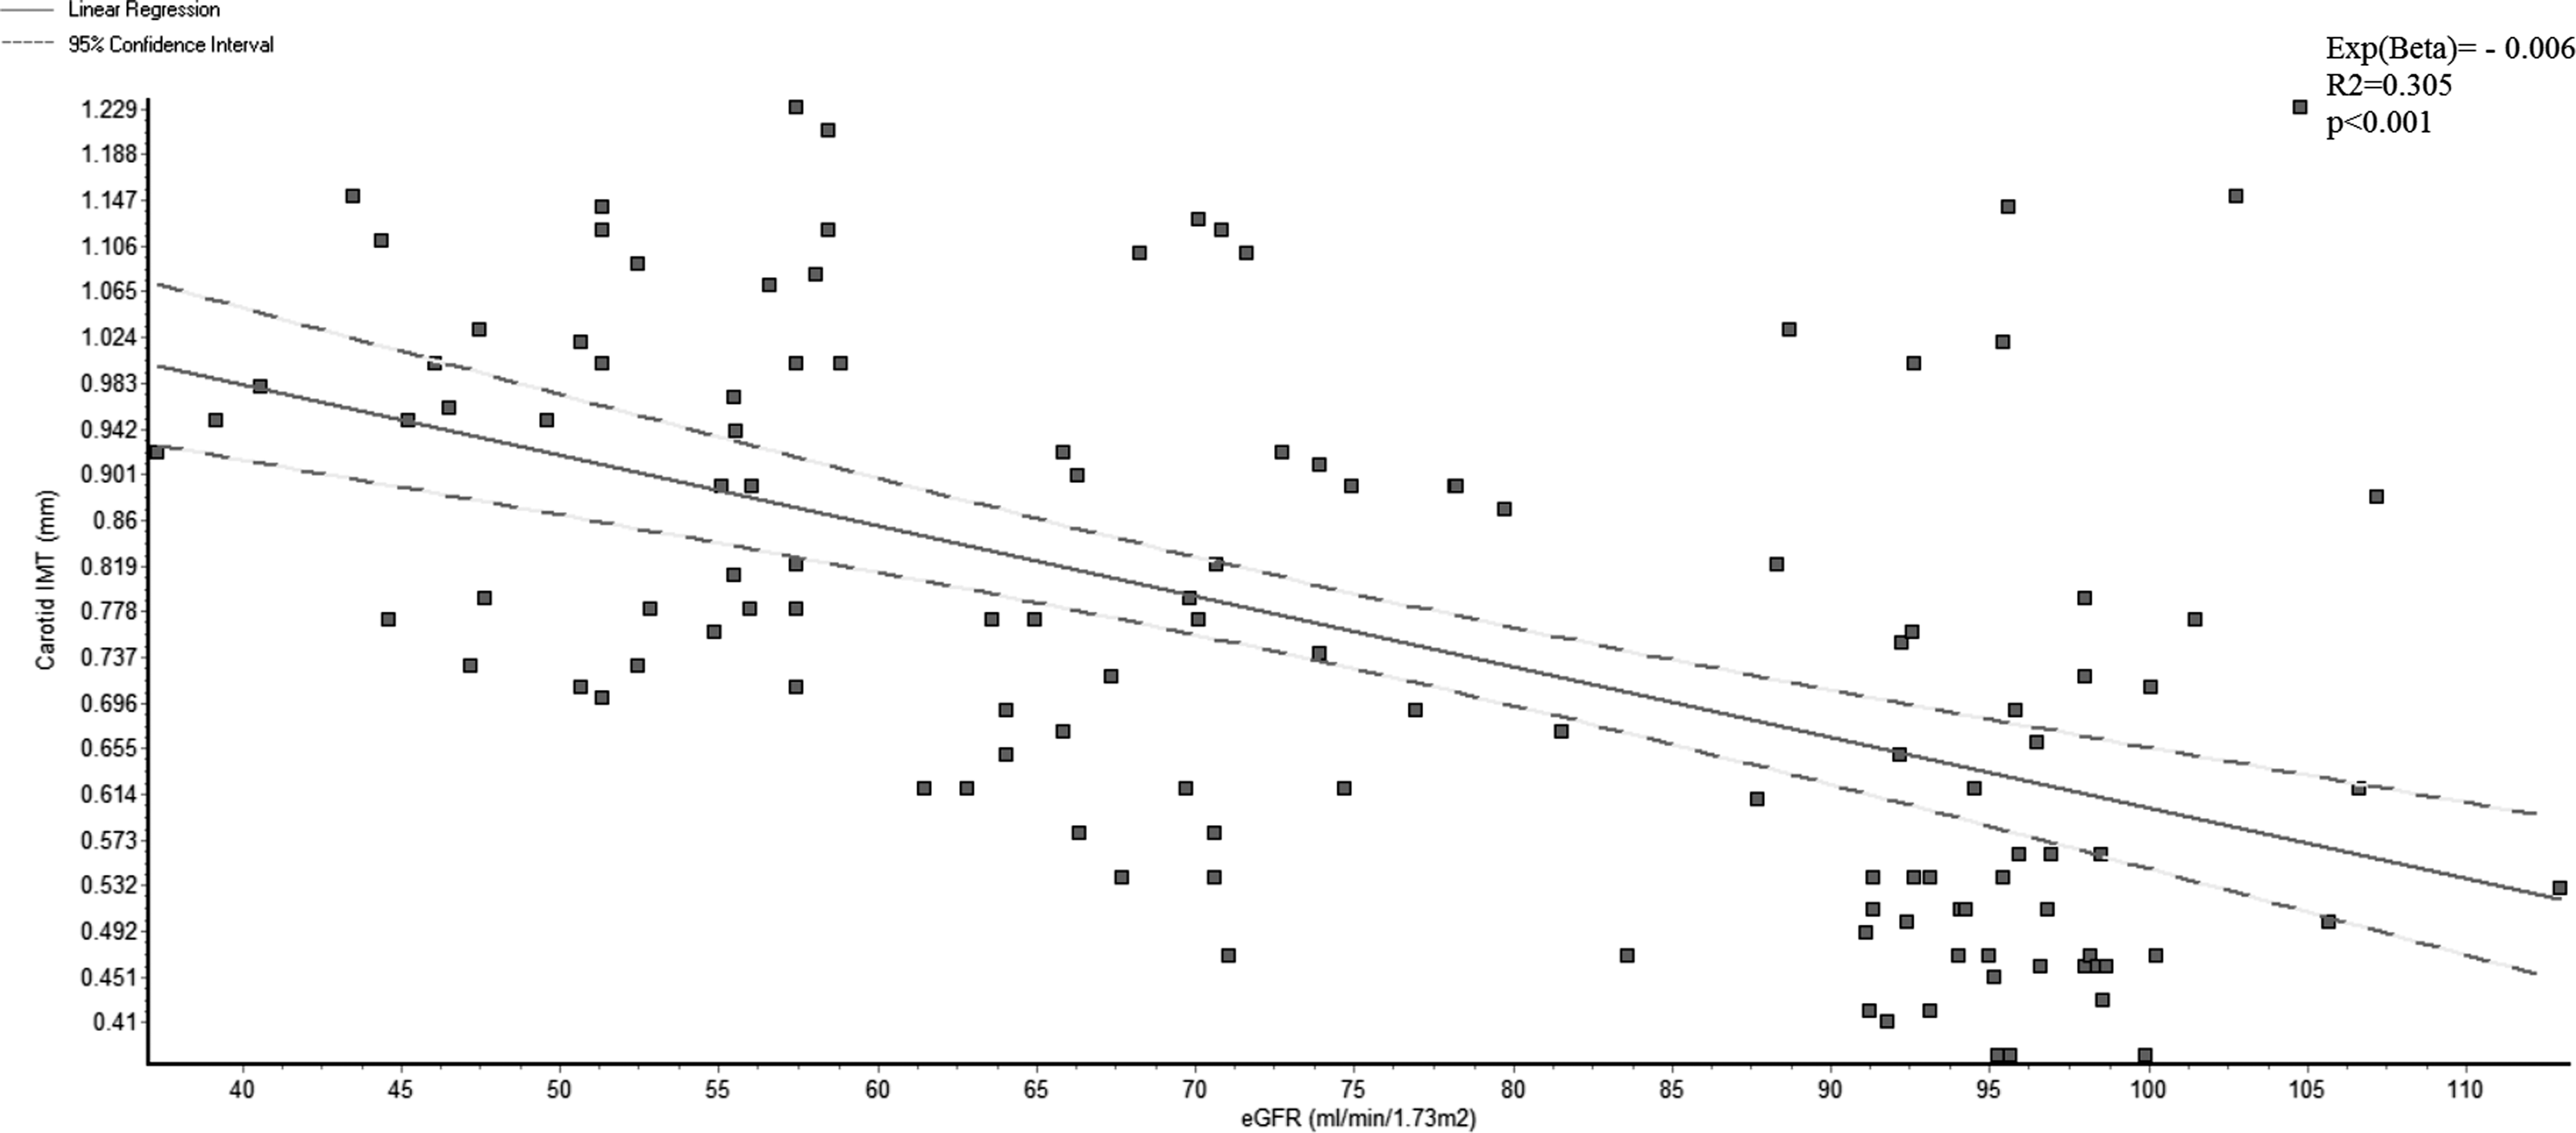
The association between eGFR and carotid IMT. eGFR, estimated glomerular filtration rate; IMT, intima–media thickness.
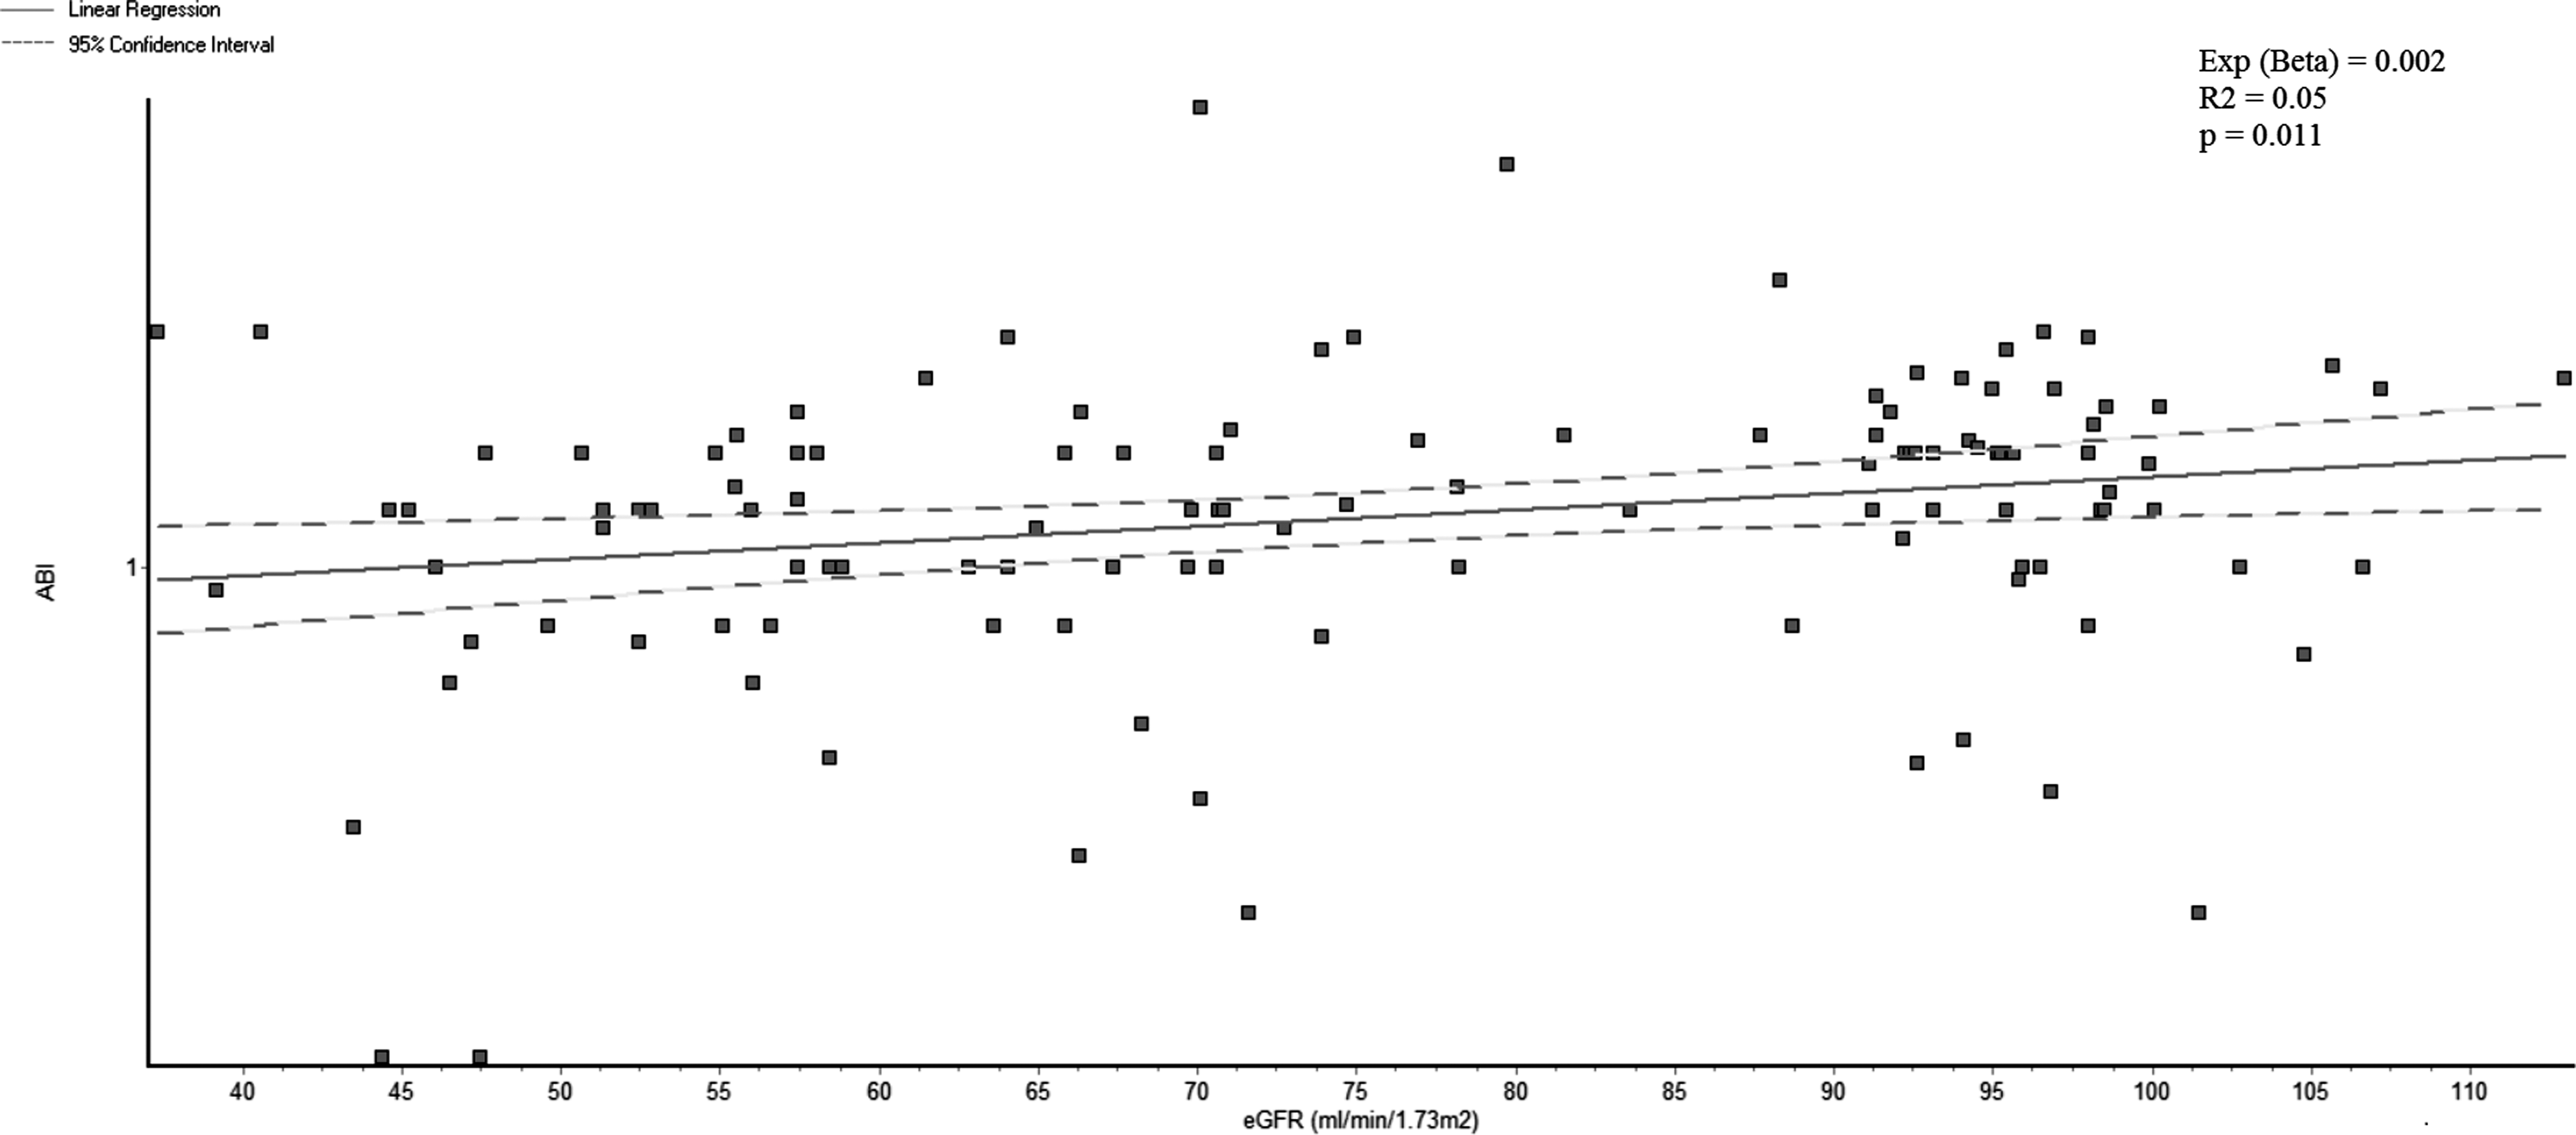
The association between eGFR and ABI. ABI, ankle-brachial index.

The relationship between eGFR and FMD1. FMD1, flow-mediated dilation at 1 minute.
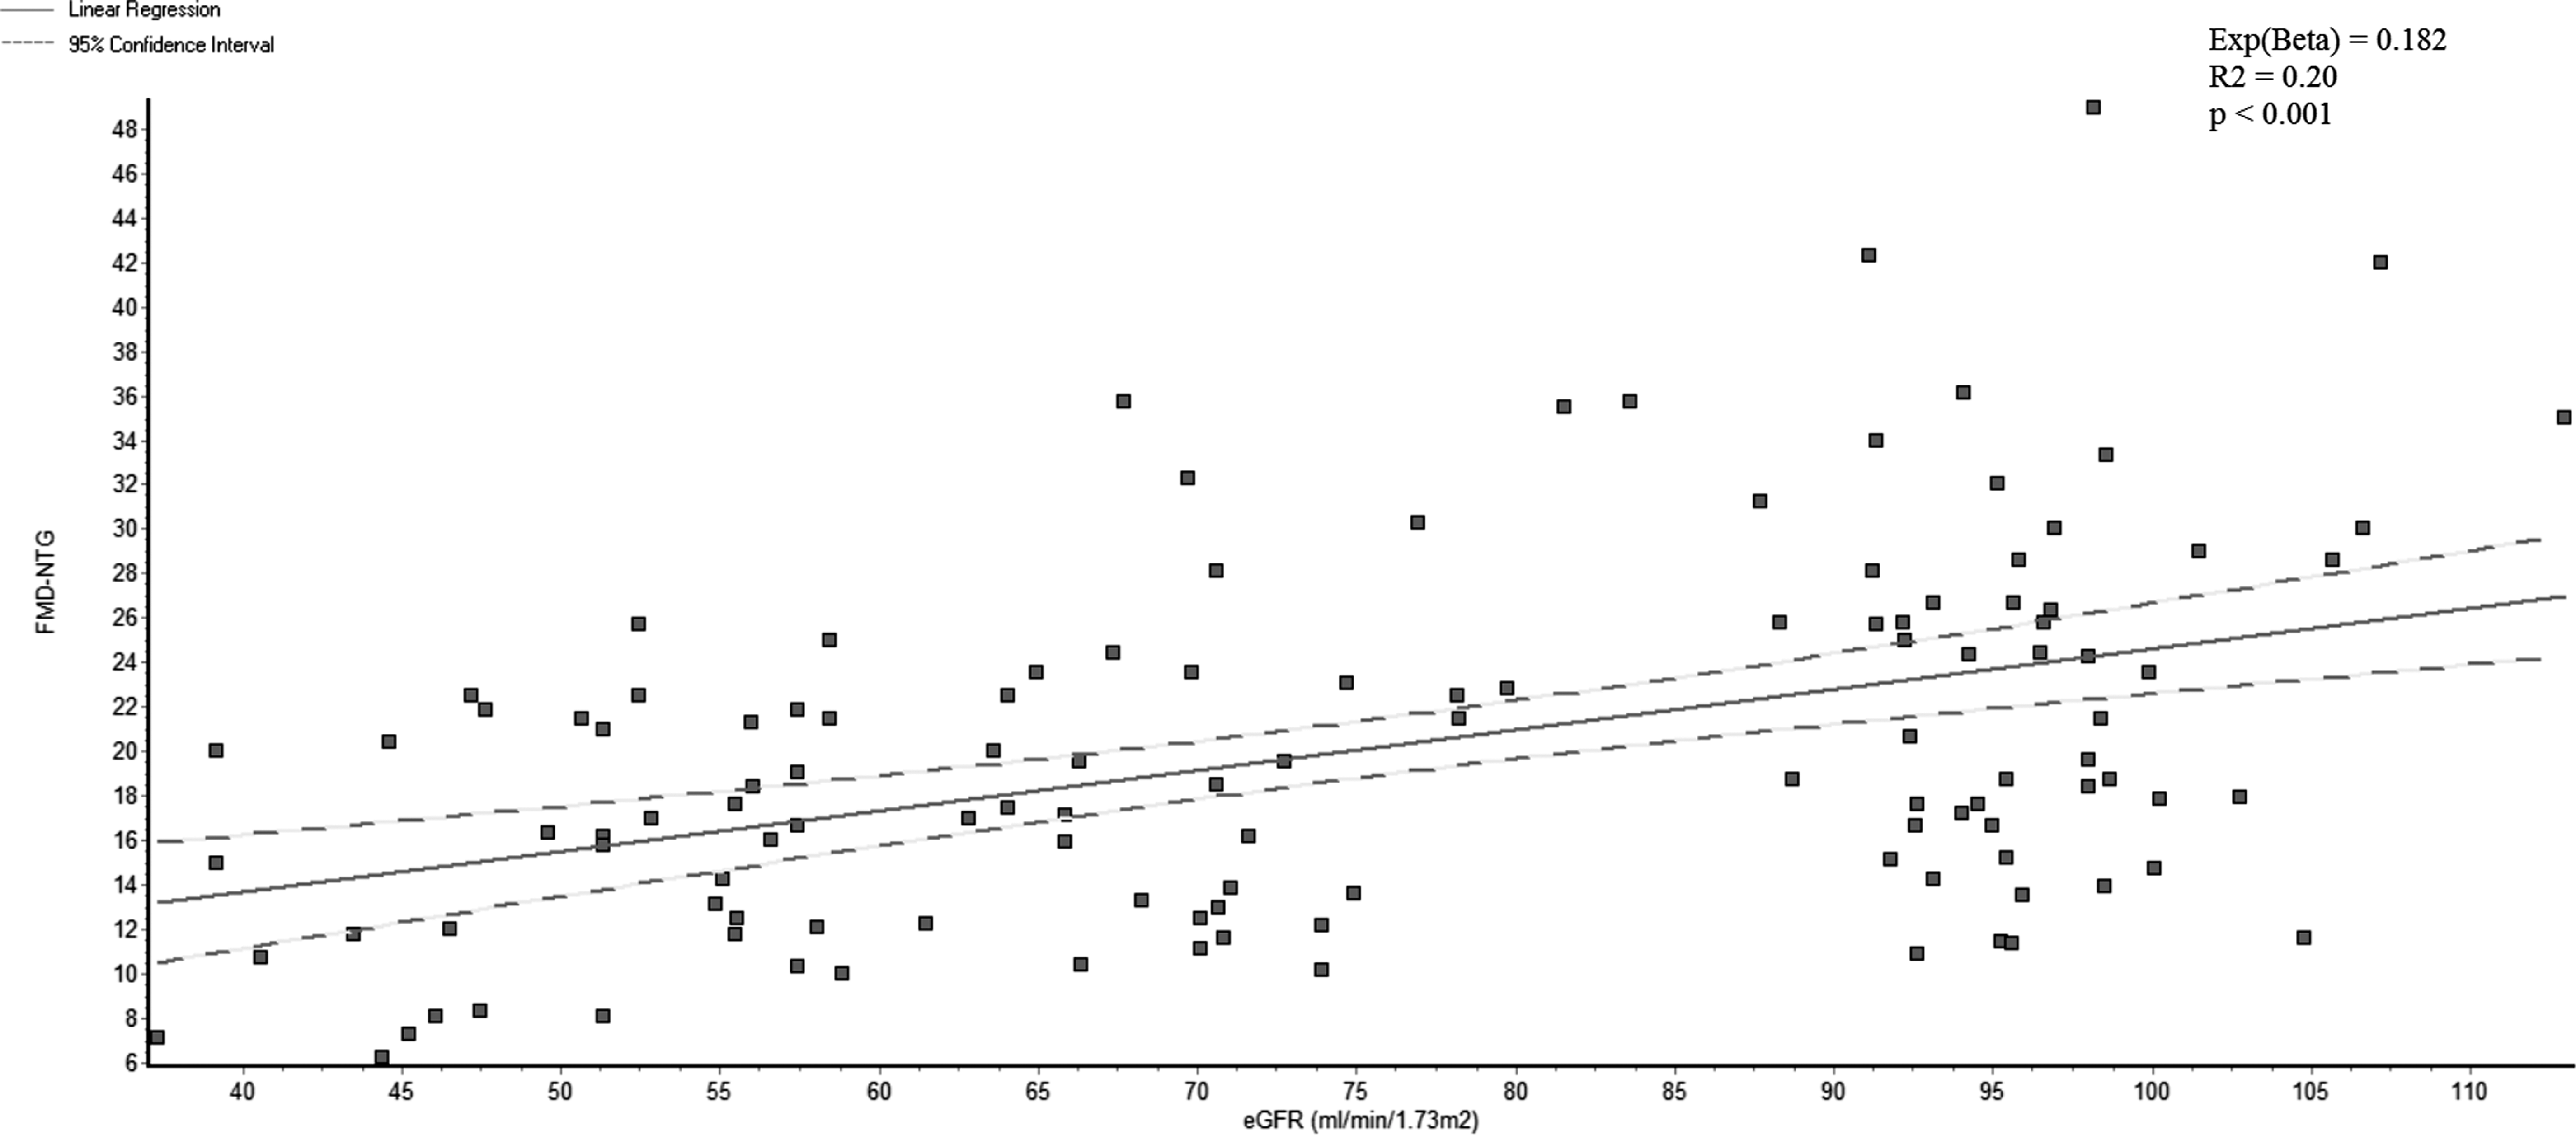
The association between eGFR and FMDNTG. FMDNTG, flow-mediated dilation after nitroglycerin.
We found an inverse association between eGFR and carotid plaques: Standardized coefficient (beta) = −0.011; 95% confidence interval (CI; −0.01 to −0.007); p < 0.001; R 2 = 0.22 and between eGFR and femoral plaques: Standardized coefficient (beta) = −0.006; 95% CI (−0.01 to −0.003); p < 0.001, R 2 = 0.09.
Regarding the relationship between eGFR and femoral IMT we noted a significantly inverse association, too: Standardized coefficient (beta) = −0.004; 95% CI (−0.006 to −0.002); p < 0.001, R 2 = 0.196.
To assess the independent association between eGFR and markers of atherosclerosis, linear regression models were built, having the following cofactors: eGFR, age, DM, arterial hypertension, obesity, SBP, DBP, total cholesterol, HDL cholesterol, LDL cholesterol, total triglycerides, smoking, antihypertensive medication, lipid-lowering medication, and antidiabetic medication. A p-value of <0.05 was considered statistically significant. We found that eGFR was independently associated with all markers of atherosclerosis (Table 3).
CI, confidence interval; TC, total cholesterol.
Discussion
Our study showed that mild-to-moderate reduced eGFR is an independent risk factor for subclinical atherosclerosis assessed by carotid and femoral IMT and plaques, ABI, and endothelial dysfunction assessed by FMD in a subset of asymptomatic postmenopausal women. Furthermore, the presence of the markers of vascular damage was detected in subjects who presented only mild deterioration in eGFR as defined by the CKD-EPI formula. The present study found an independent association between mild to moderately reduced renal function and markers of subclinical atherosclerosis.
It is well known that postmenopausal women have a high risk of developing CVD. 26 There are some studies which showed that in postmenopausal women impairment of renal function is related to CV events: thus, the reduction of eGFR was associated with the increased risk of death and CV events, independent of traditional CV risk factors 27 ; mild renal failure is a strong and independent predictor of all-cause and cardiac mortality even after controlling for all traditional risk factors for atherosclerosis. 28 In patients with CKD, accelerated atherosclerosis has been observed. It was demonstrated that atherosclerotic lesions developed in early stages of renal dysfunction. 29 The atherosclerotic CVD remain the leading cause of increased morbidity and mortality revealed in CKD. 11,29
Carotid intima–media thickness is a largely accepted measure of subclinical atherosclerosis with prognostic significance for CV events in the general population. 30,31 The association of less severe kidney disease with carotid IMT has been less well characterized. 10 In addition, in the postmenopausal women, data regarding the potential effect of renal function variations on subclinical atherosclerosis are sparse. 14,32 We found that postmenopausal women with mild-to-moderate CKD and no clinical CVD presented a significantly greater value of carotid IMT compared to those with normal kidney function. What is more, in our study, multivariable regression analysis demonstrated that eGFR remains a significant independent predictor of IMT, even after adjusting for other risk factors. Similar results were reported in other studies: early-stage CKD is associated with an increased carotid IMT, even after adjustment for traditional and nontraditional risk factors, 8,33 and carotid IMT progressively increased with decrement in kidney function. 34 In postmenopausal women a mild decrease in renal function within normal limits of GFR is associated with higher IMT 14 and there is an independent relationship between eGFR and IMT. 32 There are several reports which have not found any association of IMT with eGFR. 31,35,36 In addition, other authors appreciated that the association between CKD and carotid IMT tends to be weaker in the apparently healthy people. 37
Plaque occurrence in the carotid arteries is a strong predictor for CV events in the general population. 38 In our study we observed an independent relationship between eGFR and carotid plaques. Similar findings were reported by two other studies performed in postmenopausal women. 14,32
In our study, femoral IMT values were significantly higher in women with mild and moderate kidney dysfunction. Furthermore, multivariable regression analysis showed an independent association between eGFR and femoral IMT, respectively, femoral plaques. In a previous study performed on patients without severe renal impairment, femoral IMT and the presence of plaques did not show a significant correlation with GFR, suggesting that renal dysfunction may not exert any effect on the development of peripheral atherosclerosis. 39
Ankle brachial index, considered as diagnostic tool for peripheral artery disease, is also an indicator of generalized atherosclerosis and of future CV events, independent of Framingham risk factors. 40 According to American College of Cardiology Foundation and multi-Society European guidelines “Measurement of ABI is reasonable for CV risk assessment in asymptomatic adults at intermediate risk”. 41,42 In our study we found that women with mild and moderately decreased renal function had a significantly lower ABI compared to women with normal renal function. In addition, we observed that there is an independent association between eGFR and ABI. In CKD there is a very high rate of pathologic ABI. 43 Recently, the results of the NEFRONA study, which enrolled 2445 CKD subjects, demonstrated that patients with CKD were more likely to have a pathologic ABI. 43 Mild renal dysfunction is associated with a high prevalence of low ABI. 44 A low ABI level increases the risk of renal atherosclerosis. 44 In women, inclusion of the ABI in the calculation of the Framingham risk score dramatically increases the risk category 40. However, data regarding the association between decline of renal function and ABI in postmenopausal women are lacking.
In our study, endothelial dysfunction assessed by measuring FMD was significantly more prevalent in women with mild and moderately reduced renal function compared to women with eGFR >90 mL/min/1.73 m2. In addition, we found an independent relationship between eGFR and endothelial dependent and independent vasodilation. Similar results were obtained by Reffelmann et al. which found a significant association of FMD and eGFR in women (p = 0.01), mild reduction in renal function being strongly associated with endothelial dysfunction in females. 45 These results are in contrast with those obtained by Nerpin et al. in their cross-sectional study which included 952 elderly individuals recruited from the general population aged 70 years having eGFR >60 mL/min/m2 (49.3% women). He showed that every 10 mL/min/m2 increase in eGFR is associated with an increase of 3% endothelial dependent vasodilation and 2% endothelial independent vasodilation. These correlations diminished and were no longer statistically significant after adjusting for classical CV risk factors. 46 Thus, Nerpin et al. have concluded that eGFR is associated with endothelial function in individuals with normal renal function mainly due to association with CV risk factors and there is not a direct causal correlation between the vascular and renal function before developing CKD. 46 Another study showed that impaired endothelial function is observed more frequently in individuals with moderate and severe renal function compared to healthy subjects. The differences are probably due to the differences regarding the gender, stages of CKD, and different methods for estimating endothelial function. 47
Our study has some strengths. First, the vascular exploration was performed by the same team and evaluated by a single reader, thus minimizing the changeability associated to this technique. In addition, a single creatinine measurement technique was used. In addition, the available data on a large number of potential cofactors increase the accuracy of the results. To perform an adequate vascular risk assessment, we have provided a comprehensive assessment of atheromatous disease, measuring both morphologic and functional markers of this disease.
This study also has several limitations. First of all, the small study cohort affects the statistical power of the study. Second, the observational design of our study does not allow conclusions concerning a direct causal relationship between decline of eGFR and the markers of subclinical atherosclerosis. Next, another limitation is that the estimation of renal function was based on a single creatinine measurement. Finally, albuminuria, a known risk factor for atherosclerosis, was not measured.
The fact that postmenopausal women with mild eGFR reduction had a higher prevalence of atheromatous subclinical disease than those with normal eGFR demonstrates the need for early detection of atheromatous disease in this population. This finding underlines the importance of early detection of subjects with kidney dysfunction and the aggressive management of atherosclerotic risk factors in these populations. Whether mildly reduced renal function is causally related to subclinical atherosclerosis remains to be explored in prospective studies. Results can identify women in need of early CVD risk reduction.
Conclusions
Estimated GFR was found to be related to subclinical atherosclerosis in postmenopausal women with mild-to-moderate impaired renal function. Addition of the eGFR to the traditional risk factors may be useful for individual risk assessment. These women should be monitored more frequently and beneficiate of a more complex therapy to improve prevention of atherosclerotic disease in these patients.
Footnotes
Author Disclosure Statement
No competing financial interests exist.