




Abstract
Background:
The issue of suboptimal influenza vaccination coverage among pregnant women remains relevant. Our study aimed to explore the determinants and coverage of influenza vaccination among pregnant women in the United States using a nationally representative sample.
Materials and Methods:
This study was conducted with the 2012–2016 U.S. National Health Interview Survey. The Andersen's Health Behavior Model was applied as the conceptual framework to explore potential factors that may influence the influenza vaccination rate. A series of individual determinants, categorized into predisposing, enabling, and need factors, were compared using logistic regressions between women who received an influenza vaccination before or during pregnancy and those who did not.
Results:
An average of 36% women received an influenza vaccination before or during pregnancy among an estimated five million pregnant women. Even though the percentage increased from 31% in 2012 to 40% in 2016, it remained lower than the Healthy People 2020 target of 80%. The odds of receiving an influenza vaccination before or during pregnancy were lower among women who had public or no insurance coverage (odds ratio [OR]; 95% confidence interval, 0.510 [0.323–0.806] and 0.351 [0.175–0.705], respectively), lived in South (0.546 [0.336–0.887]), ever smoked 100 cigarettes (0.622 [0.419–0.923]), and had infrequent to light alcohol consumption in the past year (0.670 [0.457–0.983], reference: no alcohol consumption in the past year). Having a bachelor's degree increased the odds of getting an influenza vaccine compared to a high school diploma or less (2.086 [1.353–3.215]).
Conclusions:
Our study found that the influenza vaccination coverage among pregnant women remains suboptimal, and disparities may still exist across women with different sociodemographic and socioeconomic status. Clinicians should actively recommend influenza vaccination for pregnant women, and policy makers may consider developing interventions to improve the vaccination rate.
Introduction
Influenza vaccination is recommended for pregnant women regardless of trimesters because they are particularly vulnerable to influenza-related complications and mortality. 1,2 The term influenza vaccination specifically refers to “flu shot” in this study as the receipt of nasal flu spray vaccination was not recommended among pregnant women. 3 Influenza vaccination during pregnancy not only protects the pregnant women but also their fetus and newborns through the first 6 months of life. 1,2,4,5 However, influenza vaccination coverage of pregnant women is still suboptimal. Roughly 50% of the women are vaccinated before or during their pregnancy, 6 –13 which is far from the 80% target of Healthy People 2020. 14
Many factors affect the influenza vaccination rate among pregnant women, including social demographics, health beliefs, and personal health practice. Younger age, black race, or lower education level are shown to be negatively associated with influenza vaccination during pregnancy. 7 –11,15,16 Even though studies have shown that influenza vaccination during pregnancy is safe, 1,2,17 –20 concerns about safety or effectiveness of influenza vaccination remain a major barrier for pregnant women to be vaccinated. 7 –11,15,21,22 Women with lower perceived susceptibility or severity of influenza 10,11,13,23 or those who do not normally get influenza vaccination are also less likely to be vaccinated during pregnancy. 15,16,21 In contrast, women are more likely to receive influenza vaccination during their pregnancy if they have medical conditions that increase the risk of influenza-related complications. 10,11,16
Currently, there are several surveillance systems in the United States that can be used to track influenza vaccination coverage among pregnant women: the National Health Interview Survey (NHIS), the Behavioral Risk Factor Surveillance System (BRFSS), the Pregnancy Risk Assessment Monitoring System (PRAMS), and the Internet panel survey of the pregnant women. 24,25 Among those systems, the Internet panel survey is conducted in the end of influenza season each year and provides the most timely information on vaccination coverage among pregnant women. 24,25 Nevertheless, the Internet panel survey is not a probabilistic survey and thus cannot make statistical comparisons and inferences. 6 –10,25 Moreover, the Internet panel survey is Internet based and, thus, may underrepresent the population with limited access to Internet, 9 who are often with lower socioeconomic status. 26,27 Therefore, estimates from a national survey (i.e., NHIS) would be more representative and allow us to further compare and understand the characteristics between pregnant women who were vaccinated versus those who were not. The purpose of this study was to document the determinants and coverage of influenza vaccination among pregnant women with the Anderson's Behavioral Model using data from the 2012–2016 U.S. NHIS.
Materials and Methods
Data source
This study was conducted with the NHIS, which is a publically available annual probabilistic survey conducted by the National Center for Health Statistics (NCHS). The NHIS provides comprehensive cross-sectional data of a nationally representative sample of noninstitutionalized U.S. population regarding a broad range of health topics. 28 Core questionnaires of the NHIS include demographic and socioeconomic characteristics of each household, family, and family members. Five survey waves (2012–2016) were used for this study. As NHIS is publicly available and contains only deidentified data, this study was exempt from institutional review board approval.
Dependent variables
Beginning in 2012, the NHIS was modified to document the vaccine uptake during influenza seasons among pregnant women aged ≥18 years old. 24,28 To capture influenza vaccination during pregnancy in an influenza season, influenza vaccination status and pregnancy status were asked separately in different subgroups. Women were considered pregnant during an influenza season if they answered “yes” to the question “Are you currently pregnant?” and were interviewed between January to March and August to December in a given year. For women who denied current pregnancy or were currently pregnant but interviewed between April and July, their recent pregnancy status in an influenza season was checked by the question “Were you pregnant any time since August 1st [LAST YEAR]/Were you pregnant any time from August [LAST YEAR] through March [CURRENT YEAR]?/Were you pregnant any time since August 1st, [CURRENT YEAR]?.” Women were classified as having a recent pregnancy in an influenza season if they answered “yes” to this question.
Regarding the influenza vaccination status, women were first asked whether they had a flu shot within 12 months before the interview. If they answered yes, two subsequent questions were asked according to their pregnancy status. For women who were currently pregnant in an influenza season, they were then asked “Did you get a flu shot before or during your pregnancy?”; for women who were recently pregnant in an influenza season, they were asked the question “Earlier you said you were pregnant since August 1. Did you get a flu shot before, during or after this pregnancy?.” Based on these two questions, women were classified as having an influenza vaccination if they self-reported receiving a flu shot before or during their current or recent influenza season pregnancy. Women who were uncertain about their influenza vaccination status were excluded from this analysis.
Explanatory variables
A series of individual determinants that may influence the vaccine uptake in pregnant women were selected based on the Anderson's Behavioral Model. This model was first developed in the late 1960s to understand how and why health services were utilized, and it has been widely adopted as a conceptual framework for health services utilization research. 29 –32 According to the Anderson's Behavioral Model, health service utilization was determined by three classes of explanatory variables: predisposing, enabling, and need factors. Predisposing factors consisted of age (18–24, 25–34, and ≥35), race (non-Hispanic whites, non-Hispanic Blacks, Hispanics, and non-Hispanic others), and education level (≤high school, with college exposure, and ≥bachelor's degree). Enabling factors included types of insurance coverage (any private or military insurance, public insurance only, and no insurance coverage), ratio of family income to the poverty threshold (<1, 1.00–3.99, and ≥4), region (Northeast, Midwest, South, and West), partnership status (yes/no), and usual source of health care (yes/no). Need factors comprised an indicator of high risk patients (yes/no), general health status (excellent to good vs. fair to poor), body mass index (<30, 30–39, ≥40), smoking status (ever smoked 100 cigarettes vs. never), and alcohol use in the past year (no use, infrequent to light use, and moderate to heavier use). Individuals were considered at a higher risk of influenza if they self-reported having the following diseases: asthma, chronic obstructive pulmonary disease, prediabetes or diabetes mellitus, cardiovascular disease (CVD), weak/failing kidney, and liver conditions.
Statistical analysis
We first described the study sample by reporting the weighted numbers and frequencies of individual characteristics among women who were pregnant during 2012–2016. Descriptive statistics and Wald Chi-square tests were used to compare characteristics between women who received influenza vaccination before or during their pregnancy versus those who did not. Factors associated with influenza vaccination before or during pregnancy were assessed by a logistic regression model.
While the NHIS was carried out throughout the whole calendar year, the Internet panel survey was conducted at the end of an influenza season. Therefore, we reported the influenza vaccine coverage of pregnant women who were interviewed in April as a sensitivity analysis for comparing our results to those derived from the Internet panel survey. All of the analyses were adjusted for complex survey designs and sample weights using SAS 9.4 (SAS Institute, Cary, NC).
Results
Table 1 shows the characteristics of women who were pregnant between 2012 and 2016 in the United States. Population estimates were computed using sample adult weights. Among the estimated five million pregnant women, only around 36% of them ever received influenza vaccination before or during their current or recent pregnancy in an influenza season. Approximately half of the pregnant women were aged between 25 and 34 years old. Whites accounted for roughly half of the pregnant women, followed by Hispanics, which accounted for about one-fifth of the total population. Slightly less than a quarter of the pregnant women lived below the poverty level, and about 12% of them did not have a usual source of health care. Finally, about 30% of the women ever smoked 100 cigarettes, and half of the women had a certain level of alcohol use in the past year.
Characteristics of Women Who Were Pregnant During 2012–2016
Population estimates are computed using sample adult weights.
Row percentage was calculated as the weighted frequency of nonmissing values/weighted total population. Frequency of missing: influenza vaccination status: 178; education: 6; insurance coverage: 11; ratio of family income to the poverty threshold: 191; partnership: 1; usual source of health care: 16; liver conditions: 60; high risk status: 49; health status: 1; smoking status: 9; alcohol use in the past year: 46.
Partnership status was defined by the marital status variable in the NHIS. Women were classified as having a partner if they self-reported married with spouse in household or currently living with a partner. Women were classified as not having a partner if they reported married, but spouse not in household or unknown, widowed, divorced, separated, or never married.
If any coronary heart disease, angina, myocardial infarction, and other heart conditions (except hypertension).
If any liver conditions, including hepatitis.
If any asthma, COPD, DM, CVD, renal failure, liver conditions.
COPD, chronic obstructive pulmonary disease; DM, diabetes mellitus; CVD, cardiovascular disease; SE, standard error of the weighted percentage.
The trend of influenza vaccine coverage among women who were currently or recently pregnant in an influenza season by survey year is presented in Figure 1a. Overall, the percentage of women who received influenza vaccines before or during pregnancy went up from 31% in 2012 to 40% in 2016. When we stratified women by their pregnancy status, a slightly higher coverage of influenza vaccine was observed among women who were currently pregnant during the interview, ranging from 37% in 2012 to 49% in 2016 (Fig. 1b). In contrast, the influenza vaccine coverage before or during pregnancy was lower among women who were recently pregnant, which ranged from 29% in 2012 to 36% in 2016. Approximately 10% of the women with a recent pregnancy had their influenza vaccines after pregnancy throughout all survey years (Fig. 1c).
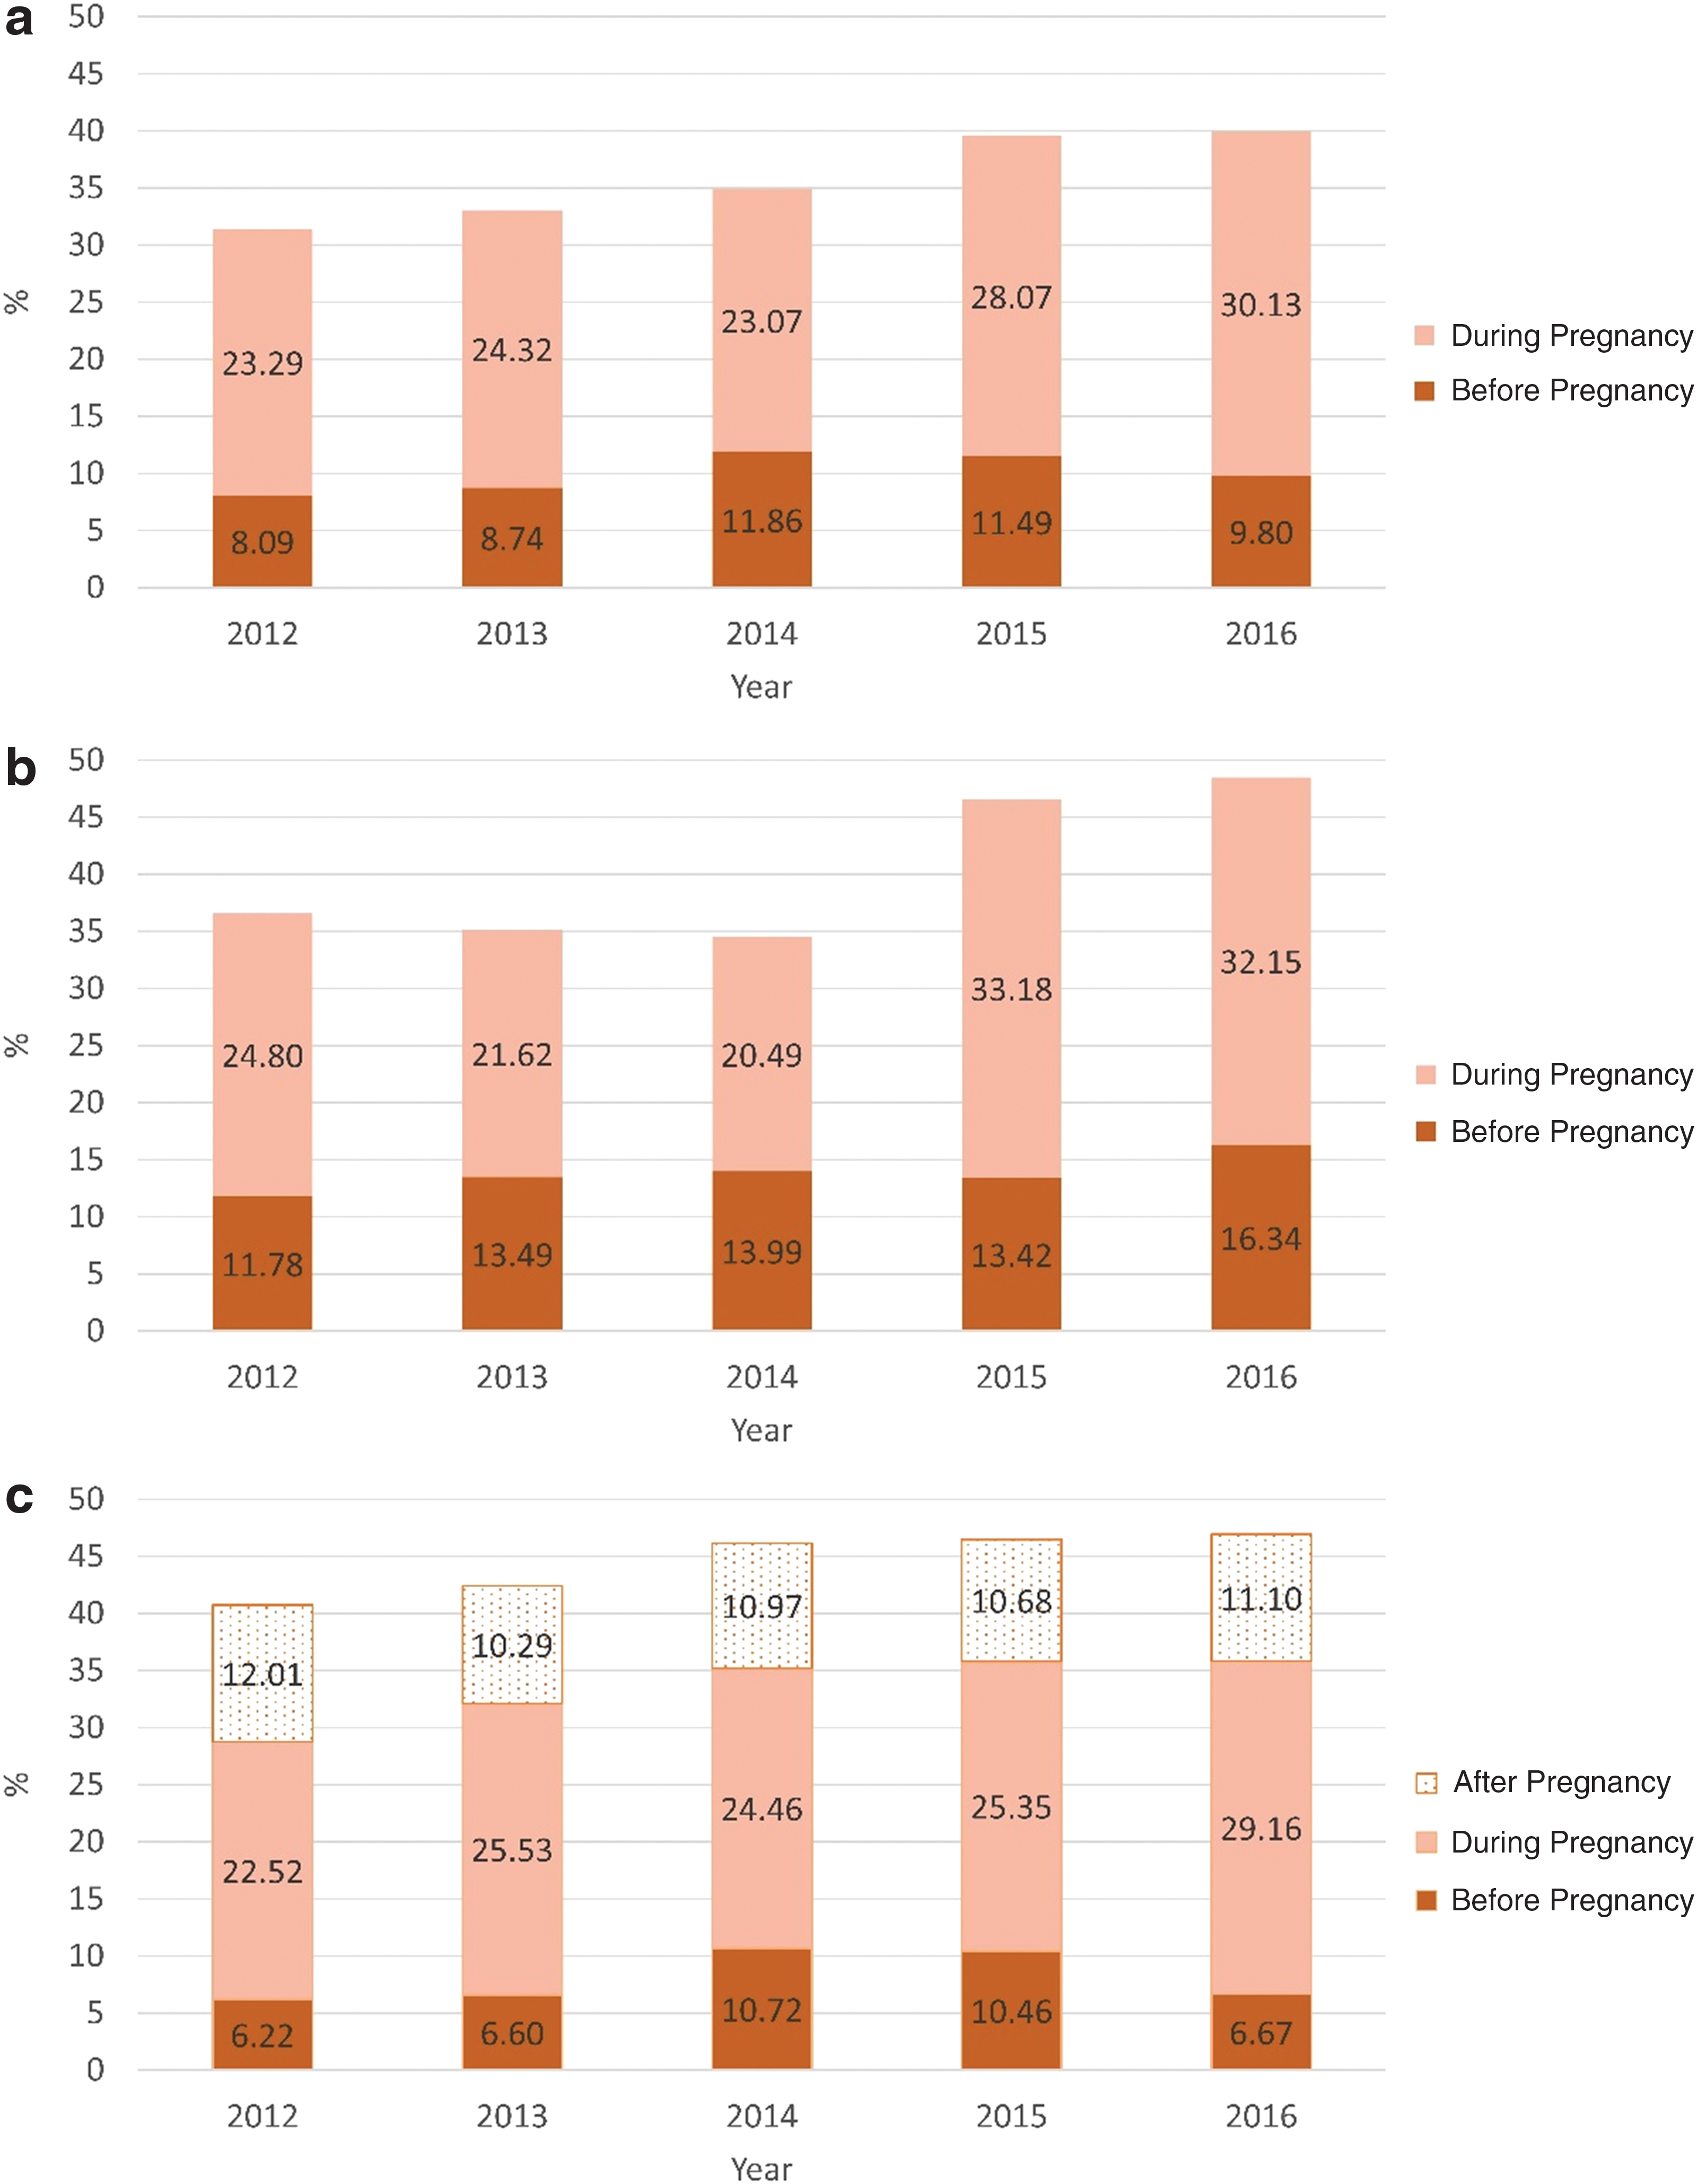
Percentage of women receiving influenza vaccines:
Figure 2 presents the results of sensitivity analysis, namely the influenza vaccine coverage in each influenza season among pregnant women who were interviewed at the end of an influenza season. Comparing to the main analysis, the uptake rate of influenza vaccine in the sensitivity analysis appeared to be higher across all influenza seasons in 2012–2016, ranging from 31% to 51% (Fig. 2). In particular, the influenza vaccine coverage was the highest in the 2012/2013 and 2013/2014 influenza season in our analysis (51% and 47%, respectively), so as the results from the Internet panel survey (51% and 52%, respectively). 10
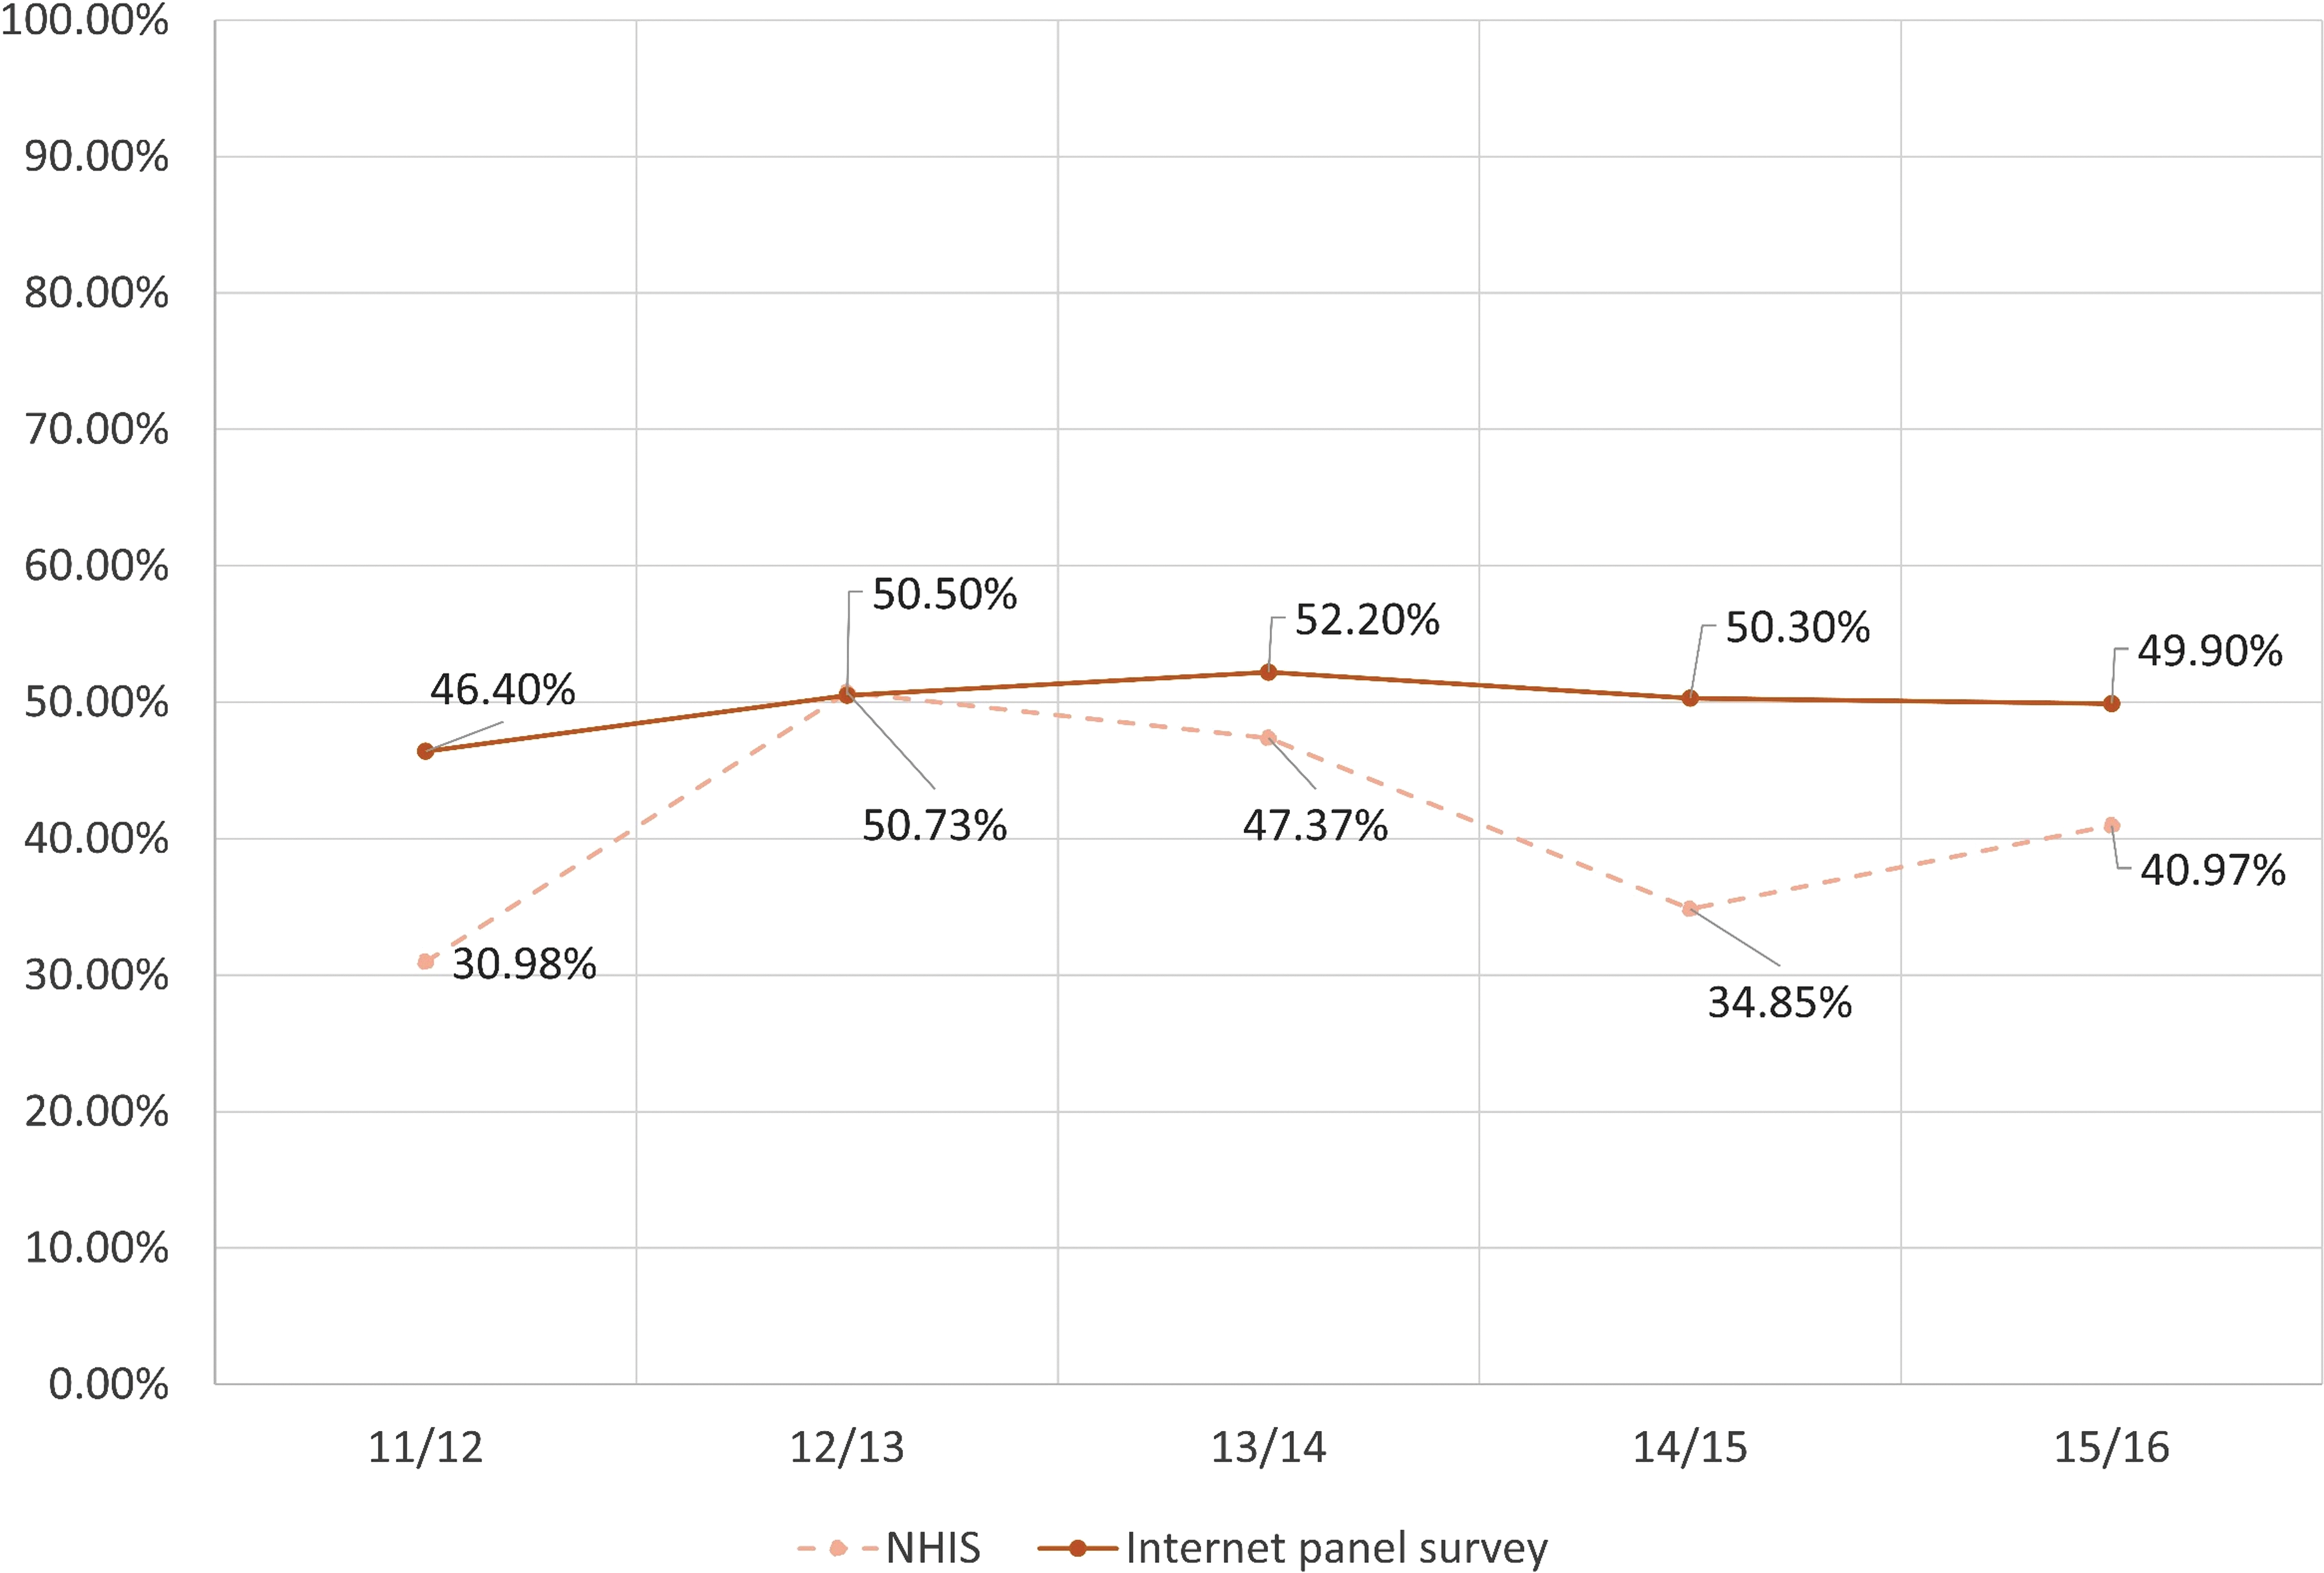
Percentage of receiving influenza vaccines among pregnant women who were interviewed in the end of influenza seasons. Color images available online at
Table 2 compares the attributes between women who received an influenza vaccine before or during pregnancy and those who did not. Women who were less than 25 years old and without a bachelor's degree were less likely to get an influenza vaccine. Non-Hispanic blacks or Hispanics were also less likely to receive a flu shot compared to Whites or non-Hispanic others. Moreover, lower socioeconomic status such as not having insurance coverage or usual source of health care, low family income, and not living with a partner was also associated with a lower vaccine coverage. A slightly lower vaccination coverage rate was observed in South compared to other regions. Among the need factors, poorer health status and cigarette use were also negatively associated with influenza vaccination during pregnancy. Interestingly, the influenza vaccination status did not differ between high risk and nonhigh risk women.
Characteristics of Pregnant Women with and Without Influenza Vaccination Before or During Pregnancy Before/During Their Pregnancy in 2012–2016
Row percentage was calculated as the weighted frequency of nonmissing values/weighted total population. Frequency of missing: education: 4; insurance coverage: 11; ratio of family income to the poverty threshold: 168; partnership: 1; liver conditions: 13; high risk status: 11; smoking status: 1; alcohol use in the past year: 26.
Partnership status was defined by the marital status variable in the NHIS. Women were classified as having a partner if they self-reported married with spouse in household or currently living with a partner. Women were classified as not having a partner if they reported married, but spouse not in household or unknown, widowed, divorced, separated, or never married.
If any coronary heart disease, angina, myocardial infarction, and other heart conditions (except hypertension).
If any liver conditions, including hepatitis.
If any asthma, COPD, DM, CVD, renal failure, liver conditions.
When we further stratified non-Hispanic Whites, non-Hispanic Blacks, Hispanics, and non-Hispanic others into five categories as White only, Black/African American only, American Indians or Alaskan Natives, Asian only, and multiple race, we found that influenza vaccination coverage appeared to be higher among the American Indians or Alaskan Natives (55%) and lower among Blacks (27%) and multiple races (22%). In addition, when we evaluated the vaccination coverage rate among women with different high risk comorbidities, our data showed that women with liver conditions had higher coverage (37.6%), while women with CVD (25%) and kidney conditions had lower coverage (25%) (Fig. 3a, b).
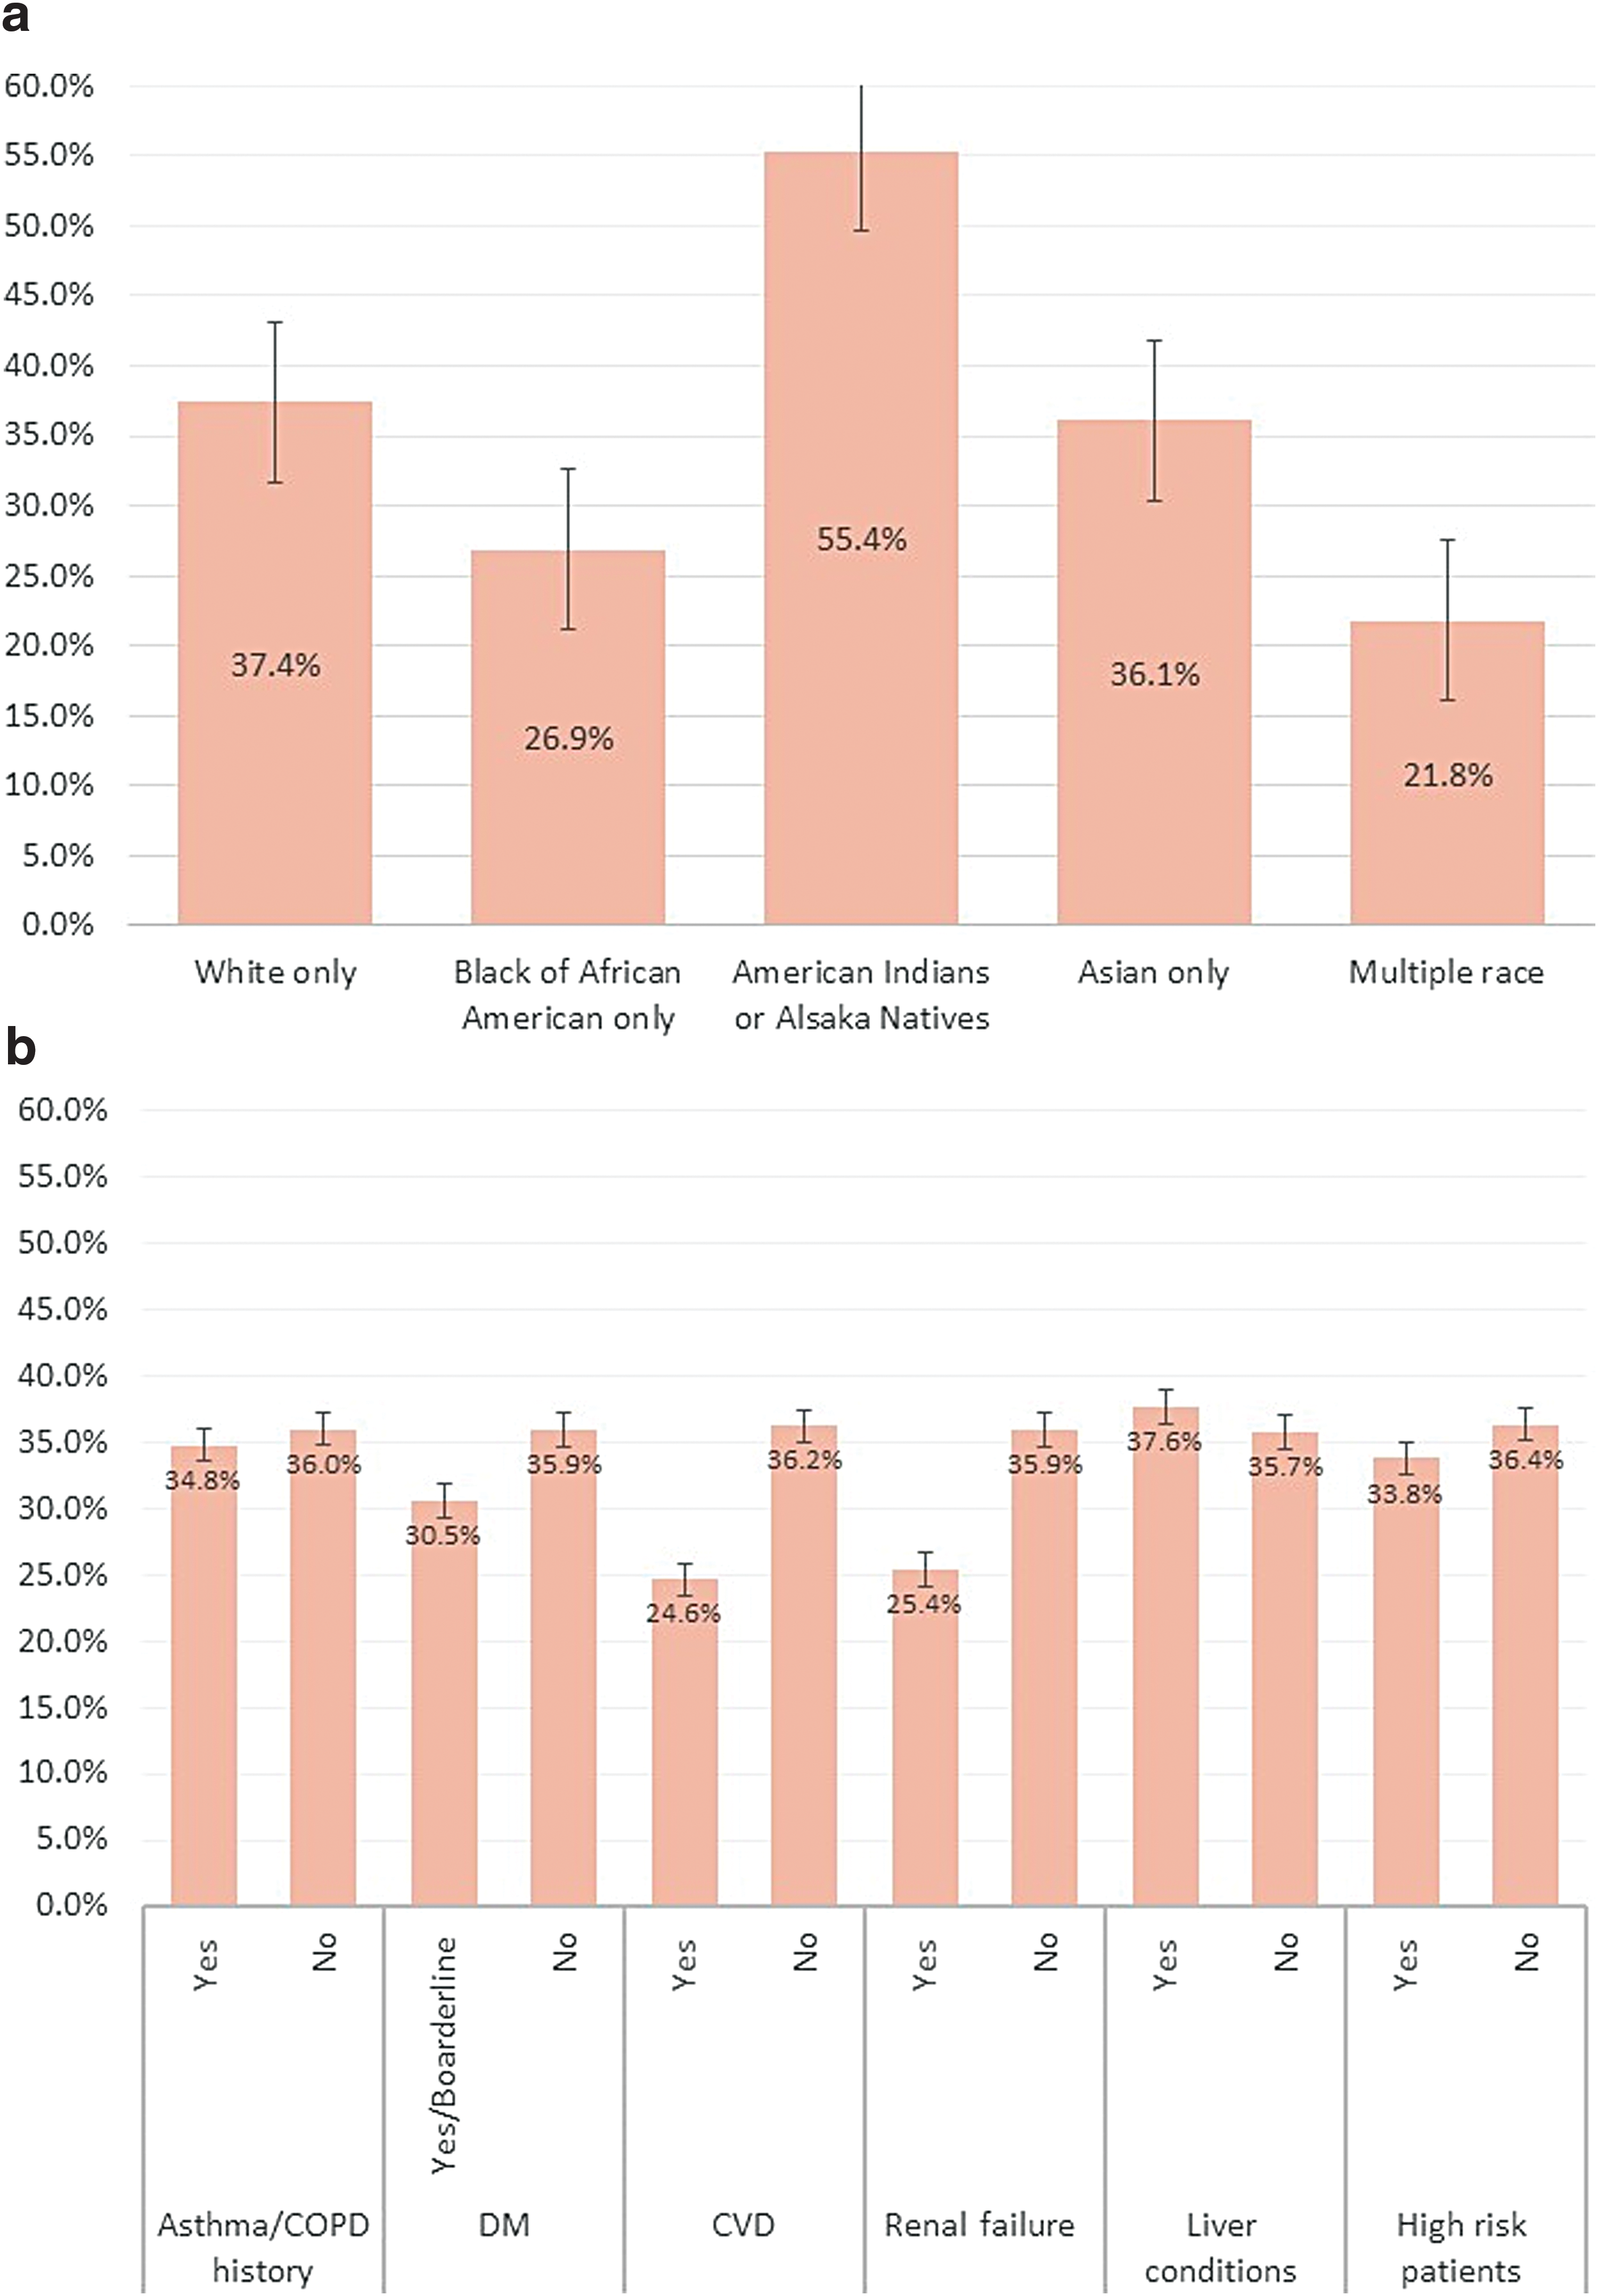
Percentage of women receiving influenza vaccines:
Table 3 shows the ORs of the logistic regression model. After we adjusted the predisposing, enabling, and need factors together, race and ethnicity was no longer a predictor of influenza vaccination, but higher education remained positively associated with influenza vaccination. Women with a bachelor's degree were more likely to get an influenza vaccine compared to women with a high school diploma or less (OR = 2.086, 95% confidence interval [CI] = 1.353–3.215). Among the enabling factors, having public or no insurance coverage posted a significantly negative effect on influenza vaccination (ORpublic insurance = 0.510, 95% CI = 0.323–0.806; ORno coverage = 0.351, 95% CI = 0.175–0.705), so as living in South region (OR = 0.546, 95% CI = 0.336–0.887). In contrast, family income level and usual source of health care were no longer associated with influenza vaccination. Two need factors, smoking and alcohol use, were significantly associated with influenza vaccination during pregnancy. Women who smoked were about 38% less likely to get vaccinated compared to women who did not smoke (OR = 0.622, 95% CI = 0.419–0.923). Compared to the nondrinkers, women with infrequent or light use of alcohol were 33% less likely to get influenza vaccination (OR = 0.670, 95% CI = 0.457–0.983).
Factors Associated with Influenza Vaccination Before or During Pregnancy
Partnership status was defined by the marital status variable in the NHIS. Women were classified as having a partner if they self-reported married with spouse in household or currently living with a partner. Women were classified as not having a partner if they reported married, but spouse not in household or unknown, widowed, divorced, separated, or never married.
If any asthma, COPD, DM, CVD, renal failure, liver conditions.
Discussion
To our knowledge, this is the first study that utilized a probabilistic survey data to document the national trend and determinants of influenza vaccination among pregnant women. While we observed an upward trend of vaccine coverage with a range from 31% to 40%, our study showed that only 40% of the pregnant women got seasonal influenza vaccination before or during their pregnancy in the 2015 and 2016 survey waves, and this number was lower than the 50% prevalence reported by the CDC surveillance. 9,10 It should be noted, however, that the NHIS is an annual survey, and women could be interviewed at any month during a year. Unlike the Internet panel survey that is conducted at the end of an influenza season and, thus, reflects the influenza vaccination coverage in the whole season, the estimates from the NHIS do not present the influenza vaccination rate in a given flu season. Instead, it presents the average vaccination coverage of both the influenza season beginning in the year before the interview and the season beginning in the end of the interview year. Therefore, it is reasonable to see lower estimates reported from the NHIS than the Internet panel survey conducted by the CDC. To better compare our results with the estimates from the 2015–2016 CDC influenza surveillance report, we further conducted a sensitivity analysis for women who were interviewed only at the end of an influenza season in each calendar year. The estimated influenza vaccination rate among pregnant women from the sensitivity analysis (31%–51%) was closer to the estimates in the CDC report (46%–52%).
One interesting finding in our study was that roughly 10% of the women with a recent pregnancy got their influenza vaccine after the pregnancy. One potential explanation of this delay in vaccination is that women may be concerned about the safety of influenza vaccines and thus postpone the vaccination until they completed the pregnancy. Protecting babies from getting influenza may be another reason for women to get their influenza vaccine after a pregnancy. Since infants under 6 months old are at a high risk of influenza-related morbidity and mortality but are too young to be vaccinated, it is also recommended for women with children younger than 6 months old to be vaccinated. 33 Still, physicians should encourage women to get vaccinated during pregnancy based on the current recommendations. Another explanation could be that the pregnancy ended right before the influenza season or in the time of the year when influenza vaccination was just starting. Given that the focus of the current literature is on influenza vaccination before or during pregnancy, evidence and discussion about this delay in vaccination remain sparse. Future studies may further explore the reasons behind this phenomenon.
Besides the suboptimal influenza vaccination coverage, our results also suggested that disparities may still exist regarding the influenza vaccination for pregnant women as the vaccination coverage varied by education level, insurance coverage, and region, but not by health status or the presence of other high risk conditions. Interestingly, even though our study found no significant difference regarding influenza vaccine coverage between pregnant women with and without high risk conditions, previous studies suggested that additional high risk conditions to pregnancy may be a predictor of influenza vaccination. One explanation is that the comorbidity status in the NHIS is self-reported, while the high-risk conditions in some other studies were detected by ICD-9 codes or inquired in other ways. In addition, information of some interested comorbidities indicated by CDC was not fully retrievable from the NHIS, such as neurologic and hematologic disorders. 34 It should also be noted that estimates from the Internet panel survey may be subjected to unknown scale errors as the nature of “choice-to-take-the-survey” could impair the principle of probability sampling. 35 For example, it was plausible that pregnant women who chose to take the online survey were likely to be more aware of their own health conditions and have a higher chance to be vaccinated. Thus, the correlation of comorbidities and vaccination may seem to be more significant in these kinds of study design.
Our study showed that women with a lower education level were less likely to be vaccinated during pregnancy, but vaccination coverage did not seem to be different by race. The different levels of vaccination coverage may be explained by the fact that education is an influential factor on health beliefs and health knowledge, which are two significant predictors of influenza vaccination utilization as suggested by the Anderson's Behavioral Model and prior literatures. 15,32 While earlier studies showed a lower vaccination coverage among African Americans, 7 –9,15 the 2016–2017 flu season report did not find that influenza vaccination differed by race. 10 Along with our finding, this may suggest that racial disparities in influenza vaccination have been eliminated among pregnant women.
In contrast to the previous studies, 10,11,16 we did not find that the influenza vaccination status differed by the health or comorbid status. Instead, our results suggested that women with a certain level of tobacco and alcohol use may be less likely to get an influenza vaccine during pregnancy. Given that health behaviors may reflect individuals' health beliefs or attitude, women who smoked or drank alcohol may perceive themselves as being less susceptible to influenza or that, should they contract the illness, the experience would not be life-threatening. Prior studies have shown that health care providers' recommendation and offer of influenza vaccination could significantly increase the coverage rate even among pregnant women with negative attitude toward safety or effectiveness of influenza vaccine. 10,11,15,21,22 As a result, clinicians should play a more active role in recommending and offering influenza vaccination for pregnant women. Due to the nature of the data used for this study, however, we were unable to determine whether women who self-reported using tobacco and alcohol still engaged in these risky behaviors during pregnancy. Therefore, this result needs to be interpreted with caution.
Several limitations are acknowledged with this study. Even though the NHIS was designed to capture influenza vaccination status among women who were pregnant in an influenza season, misclassification may still occur, especially among recently pregnant women. The potential misclassification is mainly due to the 12-month recall period and the definition of the recent pregnancy. In the NHIS, a woman was asked whether she was pregnant any time since August 1st in the past year. As a result, a woman who was pregnant from January to August in the past year would answer “yes” to the question and thus be classified as having a recent pregnancy. However, the women might have had an influenza vaccine in January and then another shot in October in the past year. This would make her influenza vaccination status for her last pregnancy being coded as “no” or “after pregnancy” depending on whether she received another vaccine in October. Therefore, we may underestimate the vaccine coverage in this situation, and this may be a reason why our estimates were lower than the CDC's Internet panel survey.
Another reason for the potential underestimation was that we excluded individuals receiving nasal spray. Women who received nasal spray before pregnancy or early pregnancy were classified as not vaccinated if they did not know they were pregnant at the time of vaccination. Nonetheless, the underestimation bias should be minor since the number of individuals receiving nasal spray was very low. Furthermore, as we used self-reported survey data, pregnancy and vaccination status were not validated by chart review. Recall bias and measurement error were two inherent limitations in our study. The ORs reported in this study did not approximate risk ratios since the outcome of interest (i.e., influenza vaccination) was not a rare event. Finally, due to the cross-sectional nature of the survey design, our results can only be interpreted as association, not causation.
Conclusion
In sum, our study found that the influenza vaccination coverage among pregnant women remains suboptimal, and disparities may still exist across women with different sociodemographic and socioeconomic status. In addition to public health campaign, clinicians should be more aware of the influenza vaccination status and actively recommend and offer influenza vaccination for pregnant women to improve the influenza vaccination coverage during pregnancy.
Footnotes
Author Disclosure Statement
No competing financial interests exist.