




Abstract
Background:
Little research to date has focused on lower urinary tract symptom (LUTS) prevention and bladder health promotion in women. To address this gap, the Prevention of LUTS Research Consortium developed the following working bladder health definition: “A complete state of physical, mental, and social well-being related to bladder function [that] permits daily activities [and] allows optimal well-being.” To begin to inform and quantify this definition, we used data from the Boston Area Community Health Survey, drawing upon its rare collection of information on LUTS and LUTS-specific interference with activities.
Methods:
At baseline, participants reported their frequency of 15 LUTS and interference with 7 activities. Prevalence ratios (PRs) were calculated by generalized linear models with robust variance estimation, adjusting for LUTS risk factors and individual LUTS.
Results:
Of the 3169 eligible participants, 17.5% reported no LUTS or interference, whereas the remaining 82.5% reported some frequency of LUTS/interference: 15.1% rarely; 21.7% a few times; 22.6% fairly often/usually; and 22.9% almost always. LUTS independently associated with interference were urgency incontinence, any incontinence, urgency, nocturia, perceived frequency, and urinating again after <2 hours (PRs = 1.2–1.5, all p < 0.05).
Conclusions:
Our findings suggest that bladder health exists on a continuum, with approximately one in five women considered to have optimal bladder health (no LUTS/interference), the majority to have intermediate health (LUTS/interference rarely to usually), and a further one in five to have worse or poor health (LUTS/interference almost always). These findings underscore the need for LUTS prevention and bladder health promotion.
Introduction
Lower urinary tract symptoms (LUTS) include storage symptoms, such as urgency and frequency; voiding symptoms, such as weak stream; incontinence symptoms; and lower urinary tract pain. 1 LUTS are common, 2 –4 costly, 5 –7 and adversely impact many women's lives. Women with LUTS have decreased physical, mental, and sexual health; decreased work productivity 3,8,9 ; and increased risks of falls, fractures, 10 social isolation, and shame. 11 Despite their high prevalence and societal costs, most research on LUTS in women to date has focused on prevalence and treatment, whereas considerably less has focused on risk factors and prevention. 12 Even less has incorporated well-being and examined promotion and maintenance of bladder health.
Health is defined by the World Health Organization as “a state of complete physical, mental, and social well-being and not merely the absence of disease or infirmity.” 13 In the Prevention of Lower Urinary Tract Symptoms (PLUS) Research Consortium, 12 we adapted this definition to create the following working bladder health definition: “A complete state of physical, mental, and social well-being related to bladder function, and not merely the absence of LUTS. Healthy bladder function permits daily activities, adapts to short-term physical and environmental stressors, and allows optimal well-being (e.g., travel, exercise, social, occupational, or other activities).” 14
In addition to overall bladder health, we also applied this concept to the three main functions of the bladder (“storage,” “emptying,” and “bioregulatory”) and described unhealthy characteristics of each. These included LUTS, such as urinary incontinence, urgency, and pain with bladder filling for unhealthy storage; weak stream, incomplete emptying, and pain with urination for unhealthy emptying; and urinary tract infections (UTIs) for unhealthy bioregulatory function. 14
Although the proposed working bladder health definition represents a major step forward in conceptualizing bladder health, we do not yet have data to quantify and further refine this concept. Therefore, we took advantage of existing data from the Boston Area Community Health (BACH) survey, drawing upon its extensive collection of information on LUTS and bladder dysfunction, as well as its rare collection of information on LUTS-specific interference with activities (e.g., travel, exercise, and social activities) in women unselected for LUTS.
Methods
Study population and design
The BACH survey is a population-based, longitudinal study of community-dwelling residents from Boston, Massachusetts (n = 5506). Participants were recruited from 2002 to 2005 using a two-stage cluster design, with stratification by sex, race/ethnicity (equally distributed across Black, Hispanic, and White), and age (30–39, 40–49, 50–59, and 60–79 years). At baseline, participants completed an in-home interview and self-administered questionnaire, and had their height, weight, and waist circumference measured. 15 Of the eligible Boston residents who were successfully contacted, 63.4% completed the baseline assessment. The BACH survey was approved by the New England Research Institutes Institutional Review Board and all participants provided written informed consent.
For the present analysis, we used baseline data for female participants only. Participants were excluded if they did not provide complete data on LUTS (all analyses), interference (all analyses), and covariates (association analyses only).
Assessment of LUTS and bladder dysfunction
Several measures of storage, emptying, and bioregulatory dysfunction were assessed at baseline. These included LUTS, such as urgency incontinence, nocturia, and pain with bladder filling, to capture unhealthy storage; hesitancy, incomplete emptying, and pain with urination to capture unhealthy emptying; and UTIs to capture unhealthy bioregulatory function. As most of these measures were symptoms, we refer to them hereafter as “LUTS” for simplicity. LUTS were assessed by validated questionnaires (American Urological Association Symptom Index, 16 Sandvik Incontinence Severity Scale, 17 and Interstitial Cystitis Symptom Index 18 ) and items written specifically for BACH. Incontinence management, such as pad use, was also queried for those who endorsed incontinence.
As several items used similar wording and/or captured similar LUTS, we collapsed the 24 LUTS items assessed into 15 combined LUTS. For each combined LUTS, we used a criterion of ≤20% disagreement across responses to combine items (Appendix Table A1), and the maximum response from any of the contributing items to capture LUTS frequency.
Assessment of interference
We assessed interference using the benign prostatic hyperplasia (BPH)-specific interference with activities domain of the Epstein Quality-of-Life Questionnaire for BPH. 19 This validated scale queries the frequency of interference from urinary problems in the past month with five daytime activities (drinking fluids before travel; driving for 2 hours without stopping; going to places that may not have a toilet; playing sports outdoors such as golf; and going to movies, shows, and church), and two nighttime activities (drinking fluids before bed and getting enough sleep at night). The Epstein scale was modified for BACH to refer to urinary “problems” as “experiences” and to include interference due to pain or discomfort in the pubic area to increase its relevance for interstitial cystitis/bladder pain syndrome. 20
Although the Epstein scale was designed for men with BPH, we used it to measure interference in our female population for several reasons: (1) it was the only scale that assessed LUTS-specific interference in all women (i.e., unselected for LUTS) at baseline in BACH; (2) it has been used extensively in analyses of female participants in BACH 3,20 –22 ; and (3) it captures several activities referenced in our working bladder health definition (i.e., travel, exercise, and social activities).
Assessment of covariates
Additional variables considered in the analysis were assessed during the baseline interview or measured during the baseline assessment. Self-reported variables included age; race; menopausal status; parity; cigarette smoking status; alcohol intake; health-related limitations in activities (moderate activities and climbing several flights of stairs); medical diagnoses of high blood pressure, diabetes types I and II, cardiovascular disease, and arthritis; and current depressive symptoms (measured by a revised version of the Center for Epidemiologic Studies of Depression Scale 23 ). Measured variables included body mass index (BMI) and waist circumference.
Statistical analyses
To account for the BACH sampling design, we weighted all observations inversely proportional to their probability of selection, with further poststratification to the Boston population using the 2000 U.S. Census. 15 As the distribution of bladder health has not yet been described, we used several approaches to begin to quantify this distribution. Our primary approach was a crosstabulation of the maximum frequency of LUTS (out of 12 LUTS, using any incontinence in the past year rather than individual types of incontinence in the past week) and interference. Women with previous or current bladder conditions (i.e., use of current LUTS medications, previous incontinence or bladder surgery, chronic indwelling catheterization, and bladder cancer) were included in the highest LUTS/interference category to acknowledge their poorer bladder health and to avoid misclassifying them as having better bladder health because of the influence of treatment on their current LUTS and interference frequency.
Additional exploratory approaches used to describe the distribution of bladder health were: (1) a crosstabulation of the number of reported LUTS (out of 12) and activities associated with interference; (2) a scatterplot of interference and LUTS scores; and (3) a histogram of a combined interference and LUTS score. We calculated the interference score by summing the frequency of interference (0–4) with each of the seven activities (range: 0–28). 19 The LUTS score was calculated by summing the frequency (0–5, except for any incontinence: 0–4) of the above-described 12 LUTS (range: 0–59) and then multiplying this sum by 28/59 to obtain a score with the same range as the interference score: 0–28. Finally, we calculated a combined interference and LUTS score by summing the individual interference and LUTS scores (range: 0–56).
For our analysis of LUTS associated with interference, we dichotomized LUTS as never versus at least “rarely” and interference as none versus at least “a little of the time” to explore the lower ends of the LUTS and interference distributions farthest away from symptomatic urologic disease and closest to what might represent optimal bladder health. Potential confounding was investigated by comparing proportions of demographic, lifestyle, and clinical variables by LUTS and interference status. Associations between LUTS and interference were investigated by calculating crude and multivariable-adjusted prevalence ratios (PRs), using log-link generalized linear models with robust variance estimation.
Our first set of multivariable-adjusted models included terms for age; race/ethnicity; menopausal status; parity; smoking status; alcohol intake; health-related limitations in activities; self-reported physician diagnoses of high blood pressure, types I or II diabetes, cardiovascular disease, and arthritis; depressive symptoms; and measured BMI and waist circumference. Our second set included the aforementioned variables, as well as all individual LUTS, to identify those independently associated with interference. We also explored effect modification by age, race/ethnicity, BMI, parity, and depressive symptoms.
To determine the sensitivity of our findings to our design/analytic assumptions, we performed several sensitivity analyses. For our examination of the distribution of bladder health, these were: (1) exclusion of women with known bladder conditions (i.e., current LUTS medications, previous incontinence or bladder surgery, chronic indwelling catheterization, and bladder cancer), as their exact position on the LUTS/interference distribution was assumed, not known based on their untreated LUTS/interference; and women with nonbladder conditions that might contribute to LUTS or interference (i.e., genitourinary cancers besides bladder cancer, prolapse of the uterus, bladder, or rectum, congenital urinary tract abnormalities (a large proportion of which are renal 24,25 ), endometriosis, pelvic inflammatory disease, chronic pelvic pain, vulvodynia, and diabetes); and (2) exclusion of nocturia and nighttime interference from the list of LUTS and interference activities, respectively, as these might be caused by nonbladder-related conditions.
For analyses investigating LUTS associated with interference, sensitivity analyses were: (1) exclusion of women with histories of bladder and nonbladder-related conditions potentially associated with LUTS and/or interference; and (2) use of higher cutoff points for LUTS (at least “a few times”) and interference (at least “some of the time”) to determine whether associations observed at lower ends of the spectrum for LUTS and interference were also observed at higher ends. Analyses were performed using R v3.5.1 and SAS® 9.3.
Results
Of the 3205 female participants who completed the baseline visit, 36 were excluded due to missing LUTS or interference data, leaving 3169 participants in the analysis. The majority of included women were young to middle aged, White, peri- or postmenopausal, and overweight or obese, with no health-related limitations in activities (Table 1). Eighty percent of women reported LUTS at least rarely and 34.5% reported interference at least a little of the time.
Demographic, Lifestyle, and Clinical Characteristics a of Women by Frequency of Lower Urinary Tract Symptoms and Interference with Activities from Urinary Experiences, Pain, or Discomfort in the Pubic Area in the Past Month; Boston Area Community Health Survey, 2002–2005
All values were weighted according to the sampling weights of the BACH survey.
Numbers may not sum to 100% because of missing values.
Examples for participants included moving a table, pushing a vacuum cleaner, softball, or playing golf.
Includes coronary artery bypass, myocardial infarction, arrhythmia, congestive heart failure, transient ischemic attack, stroke, carotid artery surgery, intermittent claudication, pulmonary embolus, aortic aneurysm, heart rhythm disturbance, Raynaud's disease, and peripheral vascular disease.
Defined as an affirmative response to at least 5 of 8 items on a revised version of the Center for Epidemiologic Studies of Depression Scale. 23
BACH, Boston Area Community Health; BMI, body mass index; LUTS, lower urinary tract symptom.
Compared with women who did not report LUTS or interference, those who reported any LUTS or interference were older, and more likely to be peri- or postmenopausal, have ever smoked cigarettes, be obese or have a large waist circumference, and report some health-related limitations in activities or histories of high blood pressure, diabetes types I and II, cardiovascular disease, and arthritis. Women who reported LUTS were more likely to be non-Hispanic White, whereas women who reported interference were more likely to be non-Hispanic Black, to have had ≥4 pregnancies, and to have depressive symptoms.
Distribution of LUTS and interference
Overall, 19.9% of women reported never experiencing LUTS, 15.7% rarely, 23.1% a few times, 15.1% fairly often, 10.0% usually, and 16.3% almost always in the past month (Table 2). The most commonly reported LUTS were urinating again after <2 hours, perceived frequency, nocturia, and urgency. The least common were nonstress, nonurgency incontinence and UTIs. With respect to interference, 65.5% reported no interference with any of the seven activities investigated, 12.9% reported interference a little of the time in the past month; 8.8% some of the time; 5.6% most of the time; and 7.1% all of the time. In general, women reported a similar frequency of interference with each of the seven activities assessed.
Frequency a of Lower Urinary Tract Symptom and Interference with Activities from Urinary Experiences, Pain, or Discomfort in the Pubic Area in the Past Month in a Community-Based Sample of 3169 Women; Boston Area Community Health Survey, 2002–2005
All values were weighted according to the sampling weights of the BACH survey.
Assessed in the past week and categorized into the following frequencies: 0, 1, 2–3, 4–5, 6–7, and ≥8 times.
Assessed in the past year and categorized into the following frequencies: 0, 1, 2–3, 4–5, 6–7, and ≥8 times.
Assessed in the past year and categorized into the following groups: none, mild, moderate, severe, and very severe, according to methods described previously. 28
UTI, urinary tract infection.
In analyses crossclassifying LUTS and interference, 17.5% of women reported no LUTS or interference, whereas the remaining 82.5% reported some frequency of LUTS or interference: 15.1% rare LUTS and/or interference a little of the time, 21.7% LUTS a few times per month and/or interference some of the time, 22.6% LUTS fairly often or usually and/or interference most of the time, and 22.9% LUTS almost always and/or interference all of the time, with 4.2% reporting both (Table 3). A small percentage of women (5.6%) were classified in the highest category based on their history of bladder conditions rather than their recent symptoms/interference.
Joint Distribution a of Prevalent Lower Urinary Tract Symptom and Interference with Activities from Urinary Experiences, Pain, or Discomfort in the Pubic Area in the Past Month in a Community-Based Sample of 3169 Women; Boston Area Community Health Survey, 2002–2005
All values were weighted according to the sampling weights of the BACH survey.
Maximum frequency of interference across seven activities.
Maximum frequency of LUTS across 12 LUTS (UTI (in the past year); straining/difficult to begin voiding; pain, burning, discomfort in the pubic/bladder area; weak stream; dribbling/wet clothes after urination; intermittency; incomplete emptying; any incontinence (in the past year); urgency/difficulty postponing urination; nocturia; perceived frequency; urinating again after <2 hours).
Represents the percentage of women who reported at least one LUTS almost always and interference with at least one activity all the time in the past month.
Represents the percentage of women with self-reported current or past bladder conditions (i.e., use of current LUTS medications, previous incontinence or bladder surgery, chronic indwelling catheterization, or bladder cancer).
Interestingly, within each of these groups, the largest subgroup was always the group with LUTS but without interference (combined prevalence = 45.2%). Although information was not available on all adaptive behaviors for LUTS, 28.2% of women who reported incontinence but not interference used incontinence protection, possibly implying that some lack of interference may have been explained by adaptation. Very few women (2.0%) reported interference without LUTS.
In sensitivity analyses, each of these estimates shifted slightly more toward no LUTS and no interference when women with known bladder conditions and nonbladder conditions that might influence LUTS or interference were excluded (Appendix Table A2). They also shifted slightly more toward no LUTS and no interference when women with nocturia and/or nighttime interference were excluded, and when younger women were examined (Appendix Table A3).
Considering alternative ways of describing the distribution of bladder health, a generally similar distribution of LUTS and interference was obtained when the numbers of LUTS and activities with interference were used rather than the maximum frequencies (Fig. 1). A slightly different impression was obtained when the continuous distributions of LUTS and interference were plotted, and when a combined continuous distribution was plotted. In these plots, the percentage of women with no LUTS or interference remained the same, but a greater density of values was observed at the lower ends of the LUTS and interference distributions, leading to a right-skewed combined distribution.
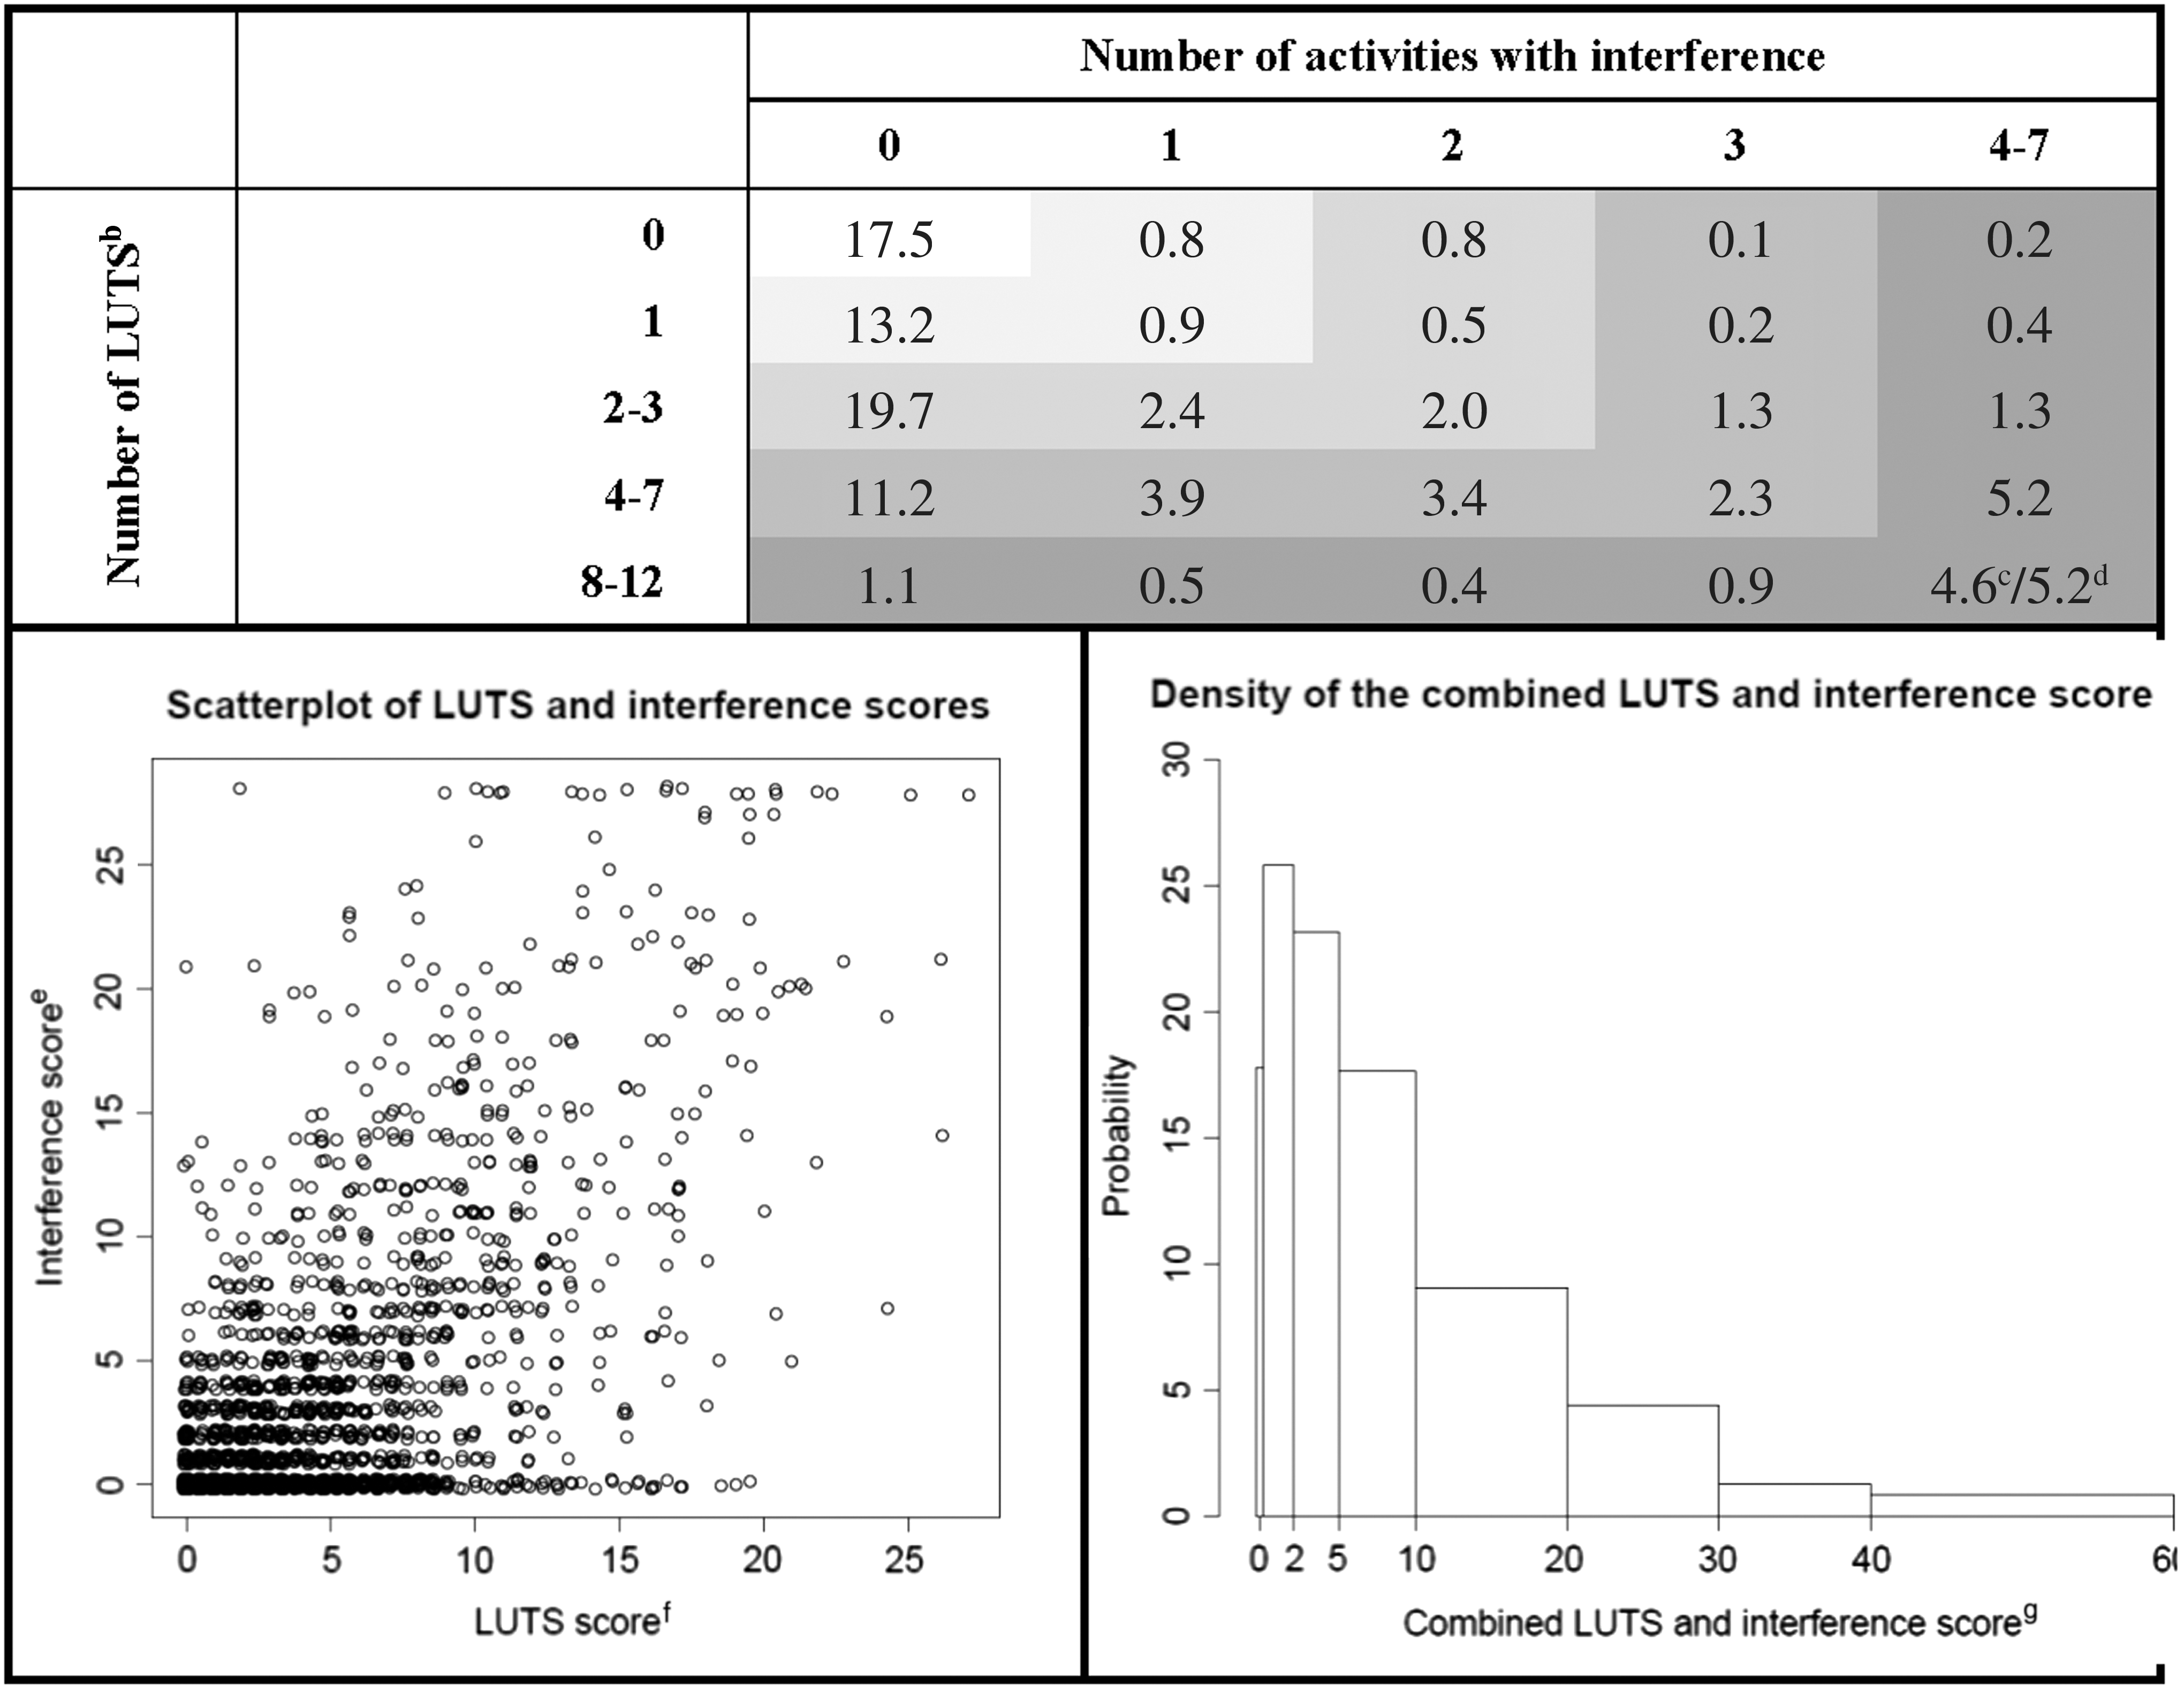
Joint distributiona of prevalent LUTS and interference with activities from urinary experiences, pain, or discomfort in the pubic area in the past month in a community-based sample of 3169 women; BACH survey, 2002–2005. aAll values were weighted according to the sampling weights of the BACH survey. bIncludes 12 LUTS (UTI (in the past year); straining/difficult to begin voiding; pain, burning, discomfort in the pubic/bladder area; weak stream; dribbling/wet clothes after urination; intermittency; incomplete emptying; any incontinence (in the past year); urgency/difficulty postponing urination; nocturia; perceived frequency; urinating again after <2 hours). cRepresents the percentage of women who reported 8–12 LUTS at least rarely and interference at least a little of the time with 4–7 activities in the past month. dRepresents the percentage of women with self-reported current or past bladder conditions (i.e., use of current LUTS medications, previous incontinence or bladder surgery, chronic indwelling catheterization, or bladder cancer). eCalculated by summing the frequency of interference (0–4) with each of the seven activities (range: 0–28). fCalculated by summing the frequency (0–5, except for incontinence in the past year = 0–4) of 12 LUTS (range: 0–59) and then multiplying by 28/59 to obtain the same range as the interference score (range: 0–28). gCalculated as the sum of the LUTS and interference scores (range: 0–56). BACH, Boston Area Community Health; LUTS, lower urinary tract symptom.
LUTS associated with interference
In unadjusted analyses (n = 3117 after excluding women with missing covariate data), all LUTS were positively associated with interference (Table 4). Associations were strongest for urgency and perceived frequency, and weakest for UTIs. After adjustment for potential confounders and each individual LUTS, only a few LUTS remained statistically significantly associated with interference: urgency incontinence, any incontinence, urgency, nocturia, perceived frequency, and urinating again after <2 hours.
Associations Between Prevalent Lower Urinary Tract Symptom and Interference with Activities from Urinary Experiences, Pain, or Discomfort in the Pubic Area in the Past Month in a Community-Based Sample of 3117 Women; Boston Area Community Health Survey, 2002–2005
All values were weighted according to the sampling weights of the BACH survey.
Adjusted for age (26–44, 45–64, or ≥65 years); race/ethnicity (Black, Hispanic, or White); menopausal status (premenopausal /undetermined, perimenopausal, postmenopausal, or surgical); parity (0, 1–3, or ≥4 pregnancies); smoking status (current, former, or never smoker); alcohol intake (<1, 1–2, or ≥3 drinks); BMI (<25, 25–29, or ≥30 kg/m2); waist circumference (<65, 65–89, 90–114, or ≥115 cm); health-related limitations in activities (not at all, a little, or a lot); self-reported physician diagnoses of high blood pressure, types I or II diabetes, cardiovascular disease, and arthritis; and depressive symptoms (yes or no).
Additionally adjusted for other LUTS individually, as appropriate.
Assessed in the past week.
Assessed in the past year.
CI, confidence interval; PR, prevalence ratio.
Most associations tended to be stronger for daytime activities and weaker/absent for nighttime activities, whereas the opposite pattern was observed for nocturia (Appendix Table A4). Considering all LUTS combined, findings were strongest for going to movies, shows, and church; playing sports; going to places without a toilet; and driving without stopping; and weakest for drinking fluids before travel and nighttime interference.
Finally, in analyses exploring effect modification, no distinct patterns were observed for total interference by age, race/ethnicity, BMI, parity, or depressive symptoms. Generally similar findings were also observed in sensitivity analyses, except for: (1) attenuated, null findings for urgency (PR = 1.1, 95% confidence interval [CI] = 0.9–1.4, p = 0.313) after excluding women with bladder conditions and nonbladder conditions that might be associated with LUTS and/or interference; and (2) stronger, significant findings for straining to begin voiding (PR = 1.2, 95% CI = 1.0–1.5, p = 0.020), greatly attenuated, null findings for urgency incontinence (PR = 1.1, 95% CI = 0.9–1.3, p = 0.211), stronger, significant findings for stress incontinence (PR = 1.2, 95% CI = 1.0–1.4, p = 0.043), and slightly attenuated nonsignificant findings for any incontinence (PR = 1.1, 95% CI = 1.0–1.3, p = 0.150, Appendix Table A5) in analyses using higher cutoff points for LUTS and interference.
Discussion
In this large representative sample of community-dwelling women 30–80 years of age, we observed a wide distribution of LUTS and interference, ranging from no LUTS or interference (17.5% of women) to LUTS and interference almost always (22.9%). The remaining 59.6% of women reported intermediate frequencies of LUTS and/or interference. Examination of the continuous distributions of LUTS and interference, taking into account both number and frequency of LUTS and interference, demonstrated clustering at the lower ends of both distributions and a right-skewed combined distribution. Storage LUTS, including urgency incontinence, any incontinence, urgency, nocturia, perceived frequency, and urinating again after <2 hours, were each independently associated with interference. Most LUTS associated with overall interference influenced daytime activities, whereas nocturia influenced nighttime activities/sleep, as expected.
Joint distribution of LUTS and interference
To our knowledge, only one previous study has evaluated the relation between LUTS and well-being in community-dwelling women unselected for LUTS. 8 This previous analysis, conducted in the Epidemiology of LUTS (EpiLUTS) study, found that 21.3% of women ≥40 years of age reported no LUTS (using a cutoff point of “sometimes”) or perceived problems with their bladder, 52.1% reported one to two types of LUTS (storage, voiding, or postmicturition) and/or “some very minor” to “moderate” problems, and 26.6% reported all three types of LUTS and/or “severe” to “many severe” problems (all estimates calculated from reference 8 ). Similar percentages were also obtained when impact rather than perception of bladder condition was examined: 19.9% reported no LUTS and were “delighted” or “pleased” with their current urinary symptoms, 51.0% reported one to two types of LUTS and/or were “mostly satisfied” to “mostly dissatisfied” with their symptoms, and 29.1% reported three types of LUTS and/or were “unhappy” or felt “terribly” about their symptoms. These percentages are generally similar to our estimates of 17.5%, 59.6%, and 22.9%, despite use of different categorizations of LUTS and measures of well-being.
Interestingly, the percentages of women who reported LUTS but only minimal diminished well-being (19.5% “no problems” and 46.3% “no” or “some very minor problems”) or no LUTS but some degree of diminished well-being (4.0% and 0.0% using the same thresholds) were also similar to our estimates of 45.2% and 2.0%, depending on the threshold used. Similar estimates were also obtained when impact rather than perception of bladder condition was examined, but only when a considerably higher threshold of impact was used (54.6% reported LUTS but a “delighted” through “mixed” view of their urinary symptoms, and 0.0% reported no LUTS but a “mostly dissatisfied” through “terrible” view of their urinary symptoms), possibly implying differences in how participants rate impact and perceived bladder condition.
Together with our findings, these results suggest that approximately one in five women (18%–21%) over 30 years of age would be considered to have optimal bladder health based on their lack of both LUTS and interference/impact; the majority (51%–60%) would be considered to have good or intermediate health based on their intermediate frequency or number of LUTS and interference/impact; and approximately one in four (23%–29%) would be considered to have worse or poor bladder health based on their maximum frequency/number of LUTS and interference/impact.
Consistent with our working bladder health definition, these estimates take into consideration both LUTS and LUTS-related well-being, but refer only to women's current (rather than future or past) state. However, if we expanded our definition to consider other factors, such as known risk factors for future LUTS development, our inferences might change. For instance, in the heart disease field, “ideal” cardiovascular health (estimated to occur in only 5% of the U.S. population) is defined as the absence of cardiovascular disease, and the simultaneous presence of several favorable health behaviors and factors, such as not smoking, and having a normal BMI and low, untreated cholesterol and blood pressure. 26
Although some risk factors have been identified for urinary incontinence (e.g., obesity and parity 27 ), health factors or biologic mediators analogous to high cholesterol and blood pressure have not yet been identified for LUTS, and thus could not be incorporated into our definition of bladder health. On the other hand, our definition includes well-being, which is not included explicitly in the current cardiovascular health definition, but incorporated conceptually through its associations with health behaviors/factors. Clearly, many ways exist to define and quantify health, and we anticipate future modifications to our definition as we learn more about this concept.
In addition to larger theoretical considerations for defining bladder health, our estimates are approximate for several reasons. First, they may over-estimate categories of better bladder health because of: (1) lack of information about interference with activities more common in women, younger individuals, or those with incontinence (e.g., interference with occupational activities, childcare activities, household chores, sexual activities, choice of clothing, laughing, and indoor sports and exercise), as the Epstein scale was designed for and validated in older men with BPH 19 ; and (2) minimal information on adaptation or coping strategies for LUTS beyond incontinence protection (e.g., reduced fluid intake, normalization of LUTS with aging), which may have limited their perceived interference.
Lack of information about LUTS beyond the 15 assessed in BACH is unlikely to have overinflated our estimates of better bladder health because only a very small percentage of women reported interference without LUTS, implying few unassessed LUTS.
With respect to under- rather than overestimation of better bladder health, inclusion of LUTS or interference from nonbladder-related conditions is unlikely to have underestimated better bladder health because these numbers were changed only minimally when women with nonbladder-related conditions were excluded from the analyses. Finally, use of a different measure of LUTS-related well-being, as well as incorporation of a measure of bladder resilience (i.e., the ability to adapt to short-term physical and environmental stressors) might further influence our estimates of bladder health. Nonetheless, given the overall similarity between our estimates and those from the EpiLUTS study, an unrelated study with different categories of LUTS and measures of well-being, we do not expect the above-described considerations to affect our overall conclusion about bladder health notably.
LUTS associated with interference
Similar to our bladder health distribution findings, our findings for LUTS associated with interference were generally consistent with those from the previous EpiLUTS analysis. 8 That study found that bother from a number of storage symptoms, including frequency, nocturia, urgency, and all forms of incontinence were independently associated with at least “moderate” perceived problems, similar to our findings for urinating again after <2 hours, perceived frequency, nocturia, urgency, urgency incontinence, and any incontinence. The EpiLUTS Study also found that incomplete emptying was associated with perceived problems, whereas we found only suggestive positive findings for this LUTS. Altogether, these findings suggest that LUTS that are difficult to defer (i.e., frequent or urgent urination) contribute to greater diminished well-being, whereas those related to voiding once initiated may be less impactful on daily activities and optimal well-being.
Conclusions
In this large representative sample of community-dwelling women unselected for LUTS, we found that bladder health exists on a continuum, with approximately one in five women considered to have optimal bladder health (no LUTS or interference), three in five good to intermediate health (intermediate frequency of LUTS or interference), and one in five worse or poor health (LUTS or interference all the time). We also found that storage LUTS were associated with interference.
Altogether, these findings provide useful preliminary estimates for conceptualizing and quantifying the spectrum of bladder health, and for understanding the LUTS that interfere with women's lives. Ongoing and future PLUS studies will complement and extend these findings by exploring bladder health and “normal” bladder function from women's perspectives; developing measures to capture these new and evolving concepts, including new measures of resilience and well-being appropriate for all LUTS; and, ultimately, identifying and intervening upon factors that promote lifelong bladder health. 12 The importance of this last goal is underscored by the small percentage of women found to have “optimal” bladder health in our analysis.
Footnotes
Acknowledgments
The authors thank the BACH survey team for designing and implementing the BACH survey, and Sarah Lindberg at the Scientific Data Coordinating Center for assisting with data management and cleaning. They also thank PLUS research personnel at each PLUS center:
Loyola University Chicago (Maywood, IL): Linda Brubaker, MD, MS, Multi-PI; Elizabeth Mueller, MD, MSME, Multi-PI; Colleen M. Fitzgerald, MD, MS, Investigator; Cecilia T. Hardacker, RN, MSN, Investigator; Jennifer M. Hebert-Beirne, PhD, MPH, Investigator; Missy Lavender, MBA, Investigator; and David A. Shoham, PhD, Investigator.
University of Alabama at Birmingham (Birmingham, AL): Kathryn Burgio, PhD, PI; Cora Beth Lewis, MD, Investigator; Alayne Markland, DO, MSc, Investigator; Gerald McGwin, PhD, Investigator; and Beverly Williams, PhD, Investigator.
University of California San Diego (La Jolla, CA): Emily S. Lukacz, MD, PI; Sheila Gahagan, MD, MPH, Investigator; D. Yvette LaCoursiere, MD, MPH, Investigator; and Jesse N. Nodora, DrPH, Investigator.
University of Michigan (Ann Arbor, MI): Janis M. Miller, PhD, MSN, PI; Lawrence Chin-I An, MD, Investigator; and Lisa Kane Low, PhD, MS, CNM, Investigator.
University of Minnesota, Coordinating Centers for Biometric Research (Minneapolis, MN): Bernard Harlow, PhD, Multi-PI; Kyle Rudser, PhD, Multi-PI; Sonya S. Brady, PhD, Investigator; John Connett, PhD, Investigator; Haitao Chu, MD, PhD, Investigator; Cynthia Fok, MD, MPH, Investigator; Sarah Lindberg, MPH, Investigator; and Todd Rockwood, PhD, Investigator.
University of Pennsylvania, Urology (Philadelphia, PA): Diane Kaschak Newman, DNP, ANP-BC, FAAN PI; Amanda Berry, PhD, CRNP, Investigator; C. Neill Epperson, MD, Investigator; Kathryn H. Schmitz, PhD, MPH, FACSM, FTOS, Investigator; Ariana L. Smith, MD, Investigator; Ann Stapleton, MD, FIDSA, FACP, Investigator; and Jean Wyman, PhD, RN, FAAN, Investigator.
Washington University in St. Louis (St. Louis, MO): Siobhan Sutcliffe, PhD, PI; Colleen McNicholas, DO, MSc, Investigator; Aimee James, PhD, MPH, Investigator; Jerry Lowder, MD, MSc, Investigator; and Mary Townsend, ScD, Investigator.
Yale University (New Haven, CT): Leslie Rickey, MD, PI; Deepa Camenga, MD, MHS, Investigator; Toby Chai, MD, Investigator; and Jessica B. Lewis, LMFT, MPhil, Investigator.
Steering Committee Chair: Mary H. Palmer, PhD
NIH Program Office: National Institute of Diabetes and Digestive and Kidney Diseases, Division of Kidney, Urologic, and Hematologic Diseases, Bethesda, MD
NIH Project Scientist: Tamara Bavendam MD, MS; Project Officer: Ziya Kirkali, MD; Scientific Advisors: Chris Mullins, PhD and Jenna Norton, MPH;
The Prevention of Lower Urinary Tract Symptoms (PLUS) Research Consortium is supported by the National Institutes of Health (NIH) through cooperative agreements (grants U01DK106786, U01DK106853, U01DK106858, U01DK106898, U01DK106893, U01DK106827, U01DK106908, and U01DK106892). Additional funding from: National Institute on Aging, NIH Office on Research in Women's Health and Office of Behavioral and Social Science.
Disclaimer
The content is solely the responsibility of the authors and does not necessarily represent the official views of the National Institutes of Health.
Author Disclosure Statement
No competing financial interests exist.
Associations Between Prevalent Lower Urinary Tract Symptom and Interference with Activities from Urinary Experiences, Pain, or Discomfort in the Pubic Area in the Past Month in Women; Boston Area Community Health Survey, 2002–2005
| LUTS (at least a few times in the past month) | Prevalence of interference at least some of the time (% a ) | PR of interference at least some of the time (95% CI) | |||||
|---|---|---|---|---|---|---|---|
| No LUTS | LUTS | Unadjusted | Adjusted b | p | Adjusted c | p | |
| Nonstress, nonurgency incontinence d | 18.1 | 57.6 | 3.2 (2.6–3.9) | 2.0 (1.6–2.5) | <0.001 | 1.0 (0.8–1.2) | 0.806 |
| UTI e | 20.4 | 29.1 | 1.4 (1.0–1.9) | 1.3 (1.0–1.6) | 0.042 | 0.9 (0.7–1.1) | 0.195 |
| Straining/difficult to begin voiding | 18.5 | 62.0 | 3.4 (2.7–4.2) | 2.1 (1.7–2.6) | <0.001 | 1.2 (1.0–1.5) | 0.020 |
| Pain, burning, discomfort in the pubic/bladder area | 18.2 | 55.8 | 3.1 (2.4–3.9) | 2.0 (1.6–2.4) | <0.001 | 1.1 (0.9–1.3) | 0.361 |
| Weak stream | 18.3 | 61.6 | 3.4 (2.7–4.2) | 2.3 (1.9–2.8) | <0.001 | 1.1 (0.9–1.3) | 0.379 |
| Urgency incontinence d | 16.5 | 49.6 | 3.0 (2.5–3.7) | 2.2 (1.8–2.6) | <0.001 | 1.1 (0.9–1.3) | 0.211 |
| Dribbling/wet clothes after urination | 17.4 | 54.3 | 3.1 (2.5–3.9) | 2.2 (1.8–2.7) | <0.001 | 1.0 (0.8–1.2) | 0.912 |
| Intermittency | 18.1 | 52.1 | 2.9 (2.3–3.5) | 1.9 (1.6–2.3) | <0.001 | 1.1 (0.9–1.3) | 0.372 |
| Stress incontinence d | 16.9 | 43.4 | 2.6 (2.0–3.2) | 1.9 (1.6–2.3) | <0.001 | 1.2 (1.0–1.4) | 0.043 |
| Incomplete emptying | 17.2 | 44.3 | 2.6 (2.1–3.1) | 1.9 (1.6–2.2) | <0.001 | 1.0 (0.9–1.2) | 0.589 |
| Any incontinence e | 16.6 | 52.0 | 3.1 (2.6–3.8) | 2.1 (1.8–2.6) | <0.001 | 1.1 (1.0–1.3) | 0.150 |
| Urgency/difficulty postponing urination | 12.5 | 53.4 | 4.3 (3.4–5.3) | 3.3 (2.6–4.1) | <0.001 | 1.7 (1.4–2.2) | <0.001 |
| Nocturia | 11.8 | 45.7 | 3.9 (3.1–4.8) | 3.0 (2.5–3.7) | <0.001 | 1.8 (1.5–2.2) | <0.001 |
| Perceived frequency | 12.4 | 37.6 | 3.0 (2.4–3.8) | 2.5 (2.0–3.1) | <0.001 | 1.3 (1.1–1.5) | 0.005 |
| Urinating again after <2 hours | 11.4 | 33.7 | 3.0 (2.3–3.7) | 2.6 (2.1–3.2) | <0.001 | 1.3 (1.0–1.6) | 0.026 |
| Any LUTS | 5.1 | 28.9 | 5.6 (3.7–8.6) | 5.2 (3.5–7.8) | <0.001 | — | — |
All values were weighted according to the sampling weights of the BACH survey.
Adjusted for age (26–44, 45–64, or ≥65 years); race/ethnicity (Black, Hispanic, or White); menopausal status (premenopausal /undetermined, perimenopausal, postmenopausal, or surgical); parity (0, 1–3, or ≥4 pregnancies); smoking status (current, former, or never smoker); alcohol intake (<1, 1–2, or ≥3 drinks); BMI (<25, 25–29, or ≥30 kg/m2); waist circumference (<65, 65–89, 90–114, or ≥115 cm); health-related limitations in activities (not at all, a little, or a lot); self-reported physician diagnoses of high blood pressure, types I or II diabetes, cardiovascular disease, and arthritis; and depressive symptoms (yes or no).
Additionally adjusted for other LUTS individually, as appropriate.
Assessed in the past week.
Assessed in the past year.
CI, confidence interval; PR, prevalence ratio.