




Abstract
Background:
To identify the association of estradiol (E2) dose and serum E2 levels with metabolic measures in early (<6 years) compared with late (≥10 years) postmenopausal women from the REPLENISH trial.
Material and Methods:
This is a post hoc analysis of a multicenter randomized clinical trial in the United States. Four doses of TX-001HR, an oral combination of E2 and progesterone (P4), and placebo were tested. This analysis included a total of 1,216 early and 297 late postmenopausal women. Linear mixed-effects models tested the association of E2 dose and serum E2 levels with changes in metabolic parameters; total cholesterol (TC), high-density lipoprotein cholesterol (HDL-C), low-density lipoprotein cholesterol (LDL-C), triglyceride (TG), and glucose (GLUC) levels from six visits over 12 months, adjusted for the serum P4 level.
Results:
A higher E2 dose was significantly associated with lower TC (p = 0.02) and LDL-C (p = 0.002) and higher HDL-C (p = 0.04) levels in early, but not late, postmenopause. With longer time since menopause, the inverse association of E2 dose with TC and LDL-C and positive association with HDL-C were attenuated (interaction p < 0.05). Higher serum E2 levels were significantly associated with lower TC (p = 0.004), LDL-C (p = 0.0001), and fasting blood GLUC (p = 0.003) and higher TG (p = 0.002) levels in early postmenopause.
Conclusion:
E2 dose differentially affects metabolic measures among early compared with late postmenopausal women. No significant main effect of the serum P4 level was found. As the metabolic parameters studied are risk factors for cardiovascular events, these results support the timing hypothesis of E2 therapy and its cardiovascular benefits.
Introduction
The leading cause of death among postmenopausal women is cardiovascular disease (CVD). 1,2 Hormone therapy (HT) has been shown to reduce CVD and mortality among postmenopausal women without prior CVD when initiated at a younger age or closer to menopause. 3,4 In addition to the direct effect of estrogen on vascular endothelium and vascular smooth muscle, the protective effect of estrogen on CVD is mediated through metabolic, inflammatory, and thrombotic processes. 5 Pooled data from 107 trials, with 33,315 participants, showed an HT effect on several cardiovascular risk factors; HT increased lean body mass (fat-free body mass) and high-density lipoprotein cholesterol (HDL-C) and decreased abdominal obesity, insulin resistance, fasting glucose (GLUC), new-onset diabetes, total cholesterol (TC), low-density lipoprotein cholesterol (LDL-C), blood pressure, and procoagulant factors. 6 The aforementioned favorable effects may explain the protective effects of HT on atherosclerosis and CVD.
Estrogen alone and estrogen plus progestin affect changes in lipid and carbohydrate metabolism. Conjugated equine estrogen (CEE) therapy significantly reduced LDL-C and increased HDL-C compared with placebo over a 3-month follow-up period, and the effect was dose dependent. 7 The Postmenopausal Estrogen/Progestin Intervention (PEPI) trial tested the effect of 4 different HT regimens on CVD risk factors during a period of 3 years. CEE alone, CEE plus sequential medroxyprogesterone acetate (MPA), CEE plus continuous MPA, and CEE plus progesterone (P4) significantly reduced LDL-C, GLUC, and insulin and increased HDL-C and triglyceride (TG) levels. 8 The HT effect on metabolic measures is dose dependent, as shown in a meta-analysis of 28 randomized clinical trials, with a significantly stronger effect of conventional-dose HT (0.625 mg CEE and equivalent doses of other formulations) compared with low-dose HT (≤0.3 mg CEE and equivalent doses of other formulations). 9
As the beneficial E2 effect on atherosclerosis is mediated through metabolic measures and E2 has a differential effect on atherosclerosis according to the time since menopause when it is initiated, 10 –13 we hypothesized that E2 has a differential effect on metabolic measures according to time since menopause. We tested the effects of E2 dose and E2 levels on several metabolic measures by time since menopause in a post hoc analysis of data from the REPLENISH trial. 14
Materials and Methods
REPLENISH study
The REPLENISH trial was a phase 3, randomized, double-blinded, placebo-controlled multicenter trial (80 sites in the United States) testing a new formulation of HT, TX-001HR (TherapeuticsMD, Inc., Boca Raton, FL), E2 and bioidentical P4 combined in a single gelatin capsule. TX-001HR is molecularly identical to endogenous E2 and P4 with bioavailability similar to E2 tablets and micronized P4 capsules administered together.
15
The purpose of the REPLENISH trial was to determine the efficacy of TX-001HR on reduction of vasomotor symptoms (VMS) compared with placebo and endometrial safety. The trial was registered with
Eligible participants were healthy postmenopausal women (defined as ≥12 months of spontaneous amenorrhea or ≥6 months of spontaneous amenorrhea with follicular stimulating hormone (FSH) >40 mIU/mL or ≥6 weeks postsurgical bilateral oophorectomy), aged 40–65 years, with a uterus, who were seeking treatment for VMS with serum E2 ≤ 50 pg/mL, with body–mass index ≤34 kg/m2, using ≤2 antihypertensive drugs, and with a negative screening mammogram, normal breast examination, and endometrial biopsy. Exclusion criteria were contraindications to HT, heavy smokers, history of endometrial hyperplasia or undiagnosed vaginal bleeding, history of cancer, or clinically significant physical or mental illness.
The primary REPLENISH study randomly assigned 1,845 eligible participants to 1 of 5 intervention groups of daily E2/P4 (1/100 mg, 0.5/100 mg, 0.5/50 mg, and 0.25/50 mg) or placebo. Randomization at each study site used a reproducible, computer-generated, block randomization schedule. Study participants and staff were blinded to the assigned intervention throughout the study. Participants were followed for 6 postrandomization visits (at 1, 2, 3, 6, 9, and 12 months or early termination) when specified safety outcomes were evaluated. 14,16 –18
The analysis reported here included REPLENISH participants who were in early (<6 years since menopause) or late (≥10 years since menopause) postmenopause with available data on the received E2 dose, serum E2 levels, and metabolic measures at baseline with at least one follow-up visit. The cut points for early and late postmenopause used in this study were derived from prior nonhuman primate 19 and human studies, 13 indicating a differential effect of HT on CVD among women (<6 years since menopause and ≥10 years since menopause). Participants who were 6–9 years since menopause were not included in the analysis to allow for two distinct groups for comparison.
Metabolic measures, estradiol doses, estradiol levels, and progesterone levels
At least 8-hour fasting blood samples were collected and measured for TC, LDL-C, HDL-C, TG, and GLUC at baseline and 3, 6, 9, and 12 months. Serum E2 levels were centrally measured at screening and at postrandomization months 1, 3, 6, 9, and 12 with a single gas chromatography-Tandem Mass Spectrometry (GC-MS/MS) method that was validated for human serum in the range of 2–500 pg/mL; the interassay coefficient of variation was <8.5% (Ventiv Health Clinical Lab, Inc., Princeton, NJ). Serum P4 levels were measured at screening and at months 1, 3, and 12 with an liquid chromatography-Mass Spectrometry (LC-MS/MS) assay that was validated for human serum in the range of 0.05–50 ng/mL; the interassay coefficient of variation was <5.5% (Ventiv Health Clinical Lab, Inc.).
Statistical methods
Baseline characteristics were reported separately for each time-since-menopause stratum (early and late postmenopause). Continuous variables were compared between time-since-menopause strata using two-sample t tests. The comparisons of mean continuous variables among E2 doses (1, 0.5, 0.25, and 0 mg) were performed with analysis of variance. Categorical variables were compared between time-since-menopause strata and across different E2 doses with chi-square tests. Pearson correlation was used to evaluate the correlation between E2 dose and mean E2 levels.
On-trial levels of metabolic measures were compared between time-since-menopause strata and across different E2 doses using linear mixed-effects models. Per-participant changes from baseline in metabolic measures over 12 months were analyzed as repeated measures dependent variables; E2 dose and E2 levels were included as main independent variables, along with time since randomization (number of months from randomization as a time variable in the mixed model). Random effects were specified for participant-specific intercepts (baseline values of metabolic measures). An interaction between E2 dose or E2 levels and time-since-menopause strata tested whether the association of E2 dose and E2 levels with the change in metabolic measures from baseline was modified by time since menopause. Analyses were adjusted for baseline metabolic levels, age, and mean on-trial serum P4 levels. The effect of the serum P4 level on changes in metabolic measures was also evaluated. Use of lipid-lowering medication was also tested as a possible confounder and effect modifier.
Model-based estimates (and standard errors [SEs]) of the changes in metabolic measures were calculated per 0.25-mg increase in E2 dose and per 1-pg/mL increase in serum E2 levels separately for early and late postmenopause. All analyses used SAS (version 9.4; Cary, NC); a two-sided p-value <0.05 was considered as statistically significant.
Results
Baseline characteristics
A total of 1,216 early (<6 years since menopause) and 297 late (≥10 years since menopause) postmenopausal women were included in the analysis. Mean age (standard deviation [SD]) was 53.2 (3.7) years versus 58.4 (4.1) years. Mean time since menopause (SD) was 2.4 (1.7) years versus 14.1 (3.9) years in early and late postmenopause, respectively. At baseline, late postmenopausal women had higher systolic blood pressure (p = 0.001) and lower serum E2 levels (p = 0.002) than early postmenopausal women (Table 1). Baseline demographic characteristics across randomized E2 dose groups were similar.
Baseline Characteristics by Postmenopausal Strata; Early (<6 Years Since Menopause) and Late (≥10 Years Since Menopause) Postmenopause
Continuous variables reported as mean (standard deviation), p-value from the t-test. Categorical variable reported as frequency (percent), p-value from the chi-square test.
GLUC, glucose; HDL-C, high-density lipoprotein cholesterol; LDL-C, low-density lipoprotein cholesterol; TC, total cholesterol; TG, triglyceride.
On-trial levels of hormones
Early postmenopausal women had significantly higher mean (SE) on-trial E2 levels [27.4 (0.8) pg/mL] compared with late postmenopausal women [22.9 (1.1) pg/mL, p = 0.001] despite similar compliance (76.2% in early versus 75.4% in late postmenopause, p = 0.72). On-trial E1 (p = 0.83) and P4 levels (p = 0.65) were similar between early and late postmenopausal women. Metabolic measures were similar between early and late postmenopausal women (data not shown).
Correlation between E2 dose and E2 levels
In the total cohort, E2 dose and mean E2 levels were significantly correlated (r = 0.44, p < 0.001). Late postmenopausal women (r = 0.52) had a stronger correlation between E2 dose and mean E2 levels than early postmenopausal women (r = 0.43). Mean E2 levels increased with higher E2 doses; however, the range of E2 levels substantially overlapped among E2 doses.
Association of E2 dose and E2 levels with metabolic measures
E2 dose analysis
Higher randomized E2 dose was significantly associated with lower TC (p = 0.02), lower LDL-C (p = 0.002), and higher HDL-C (p = 0.04) among early postmenopausal women, but not among late postmenopausal women. The association of E2 dose with all metabolic measures was significantly different between early and late postmenopausal women (p interaction <0.03). With longer time since menopause, the inverse associations of E2 dose with TC, LDL-C, and GLUC and the positive association of E2 dose with HDL-C and TG were attenuated (Table 2; Fig. 1).

Estimated changes from baseline of metabolic measures per 0.25-mg increase in estradiol dose by postmenopausal strata. Estimates are from linear mixed-effects models adjusted for baseline measure and P4 level. Interaction p-value tests interaction between E2 dose and time since menopause (years). *Significant change from baseline (p < 0.04). **Significant different between early and late postmenopause (p < 0.03). GLUC, glucose; HDL-C, high-density lipoprotein cholesterol; LDL-C, low-density lipoprotein cholesterol; TC, total cholesterol; TG, triglyceride.
Estimated Changes from Baseline of Metabolic Measures Per 0.25-mg Increase of E2 Dose and 1-pg/ml Serum Increase of E2 Levels by Postmenopausal Strata
Estimates are from the mixed-effects model adjusted for baseline measure and P4 level. Interaction p-value tests interaction between E2 dose or E2 level and time since menopause (years).
E2 level analysis
Higher serum E2 levels were significantly associated with lower TC (p = 0.004), lower LDL-C (p = 0.0001), lower GLUC (p = 0.003), and higher TG (p = 0.002) levels among early postmenopausal women. The direction and magnitude of change in all measures with increasing E2 levels for both early and late postmenopausal women were similar (p interaction >0.05) (Table 2; Fig. 2).
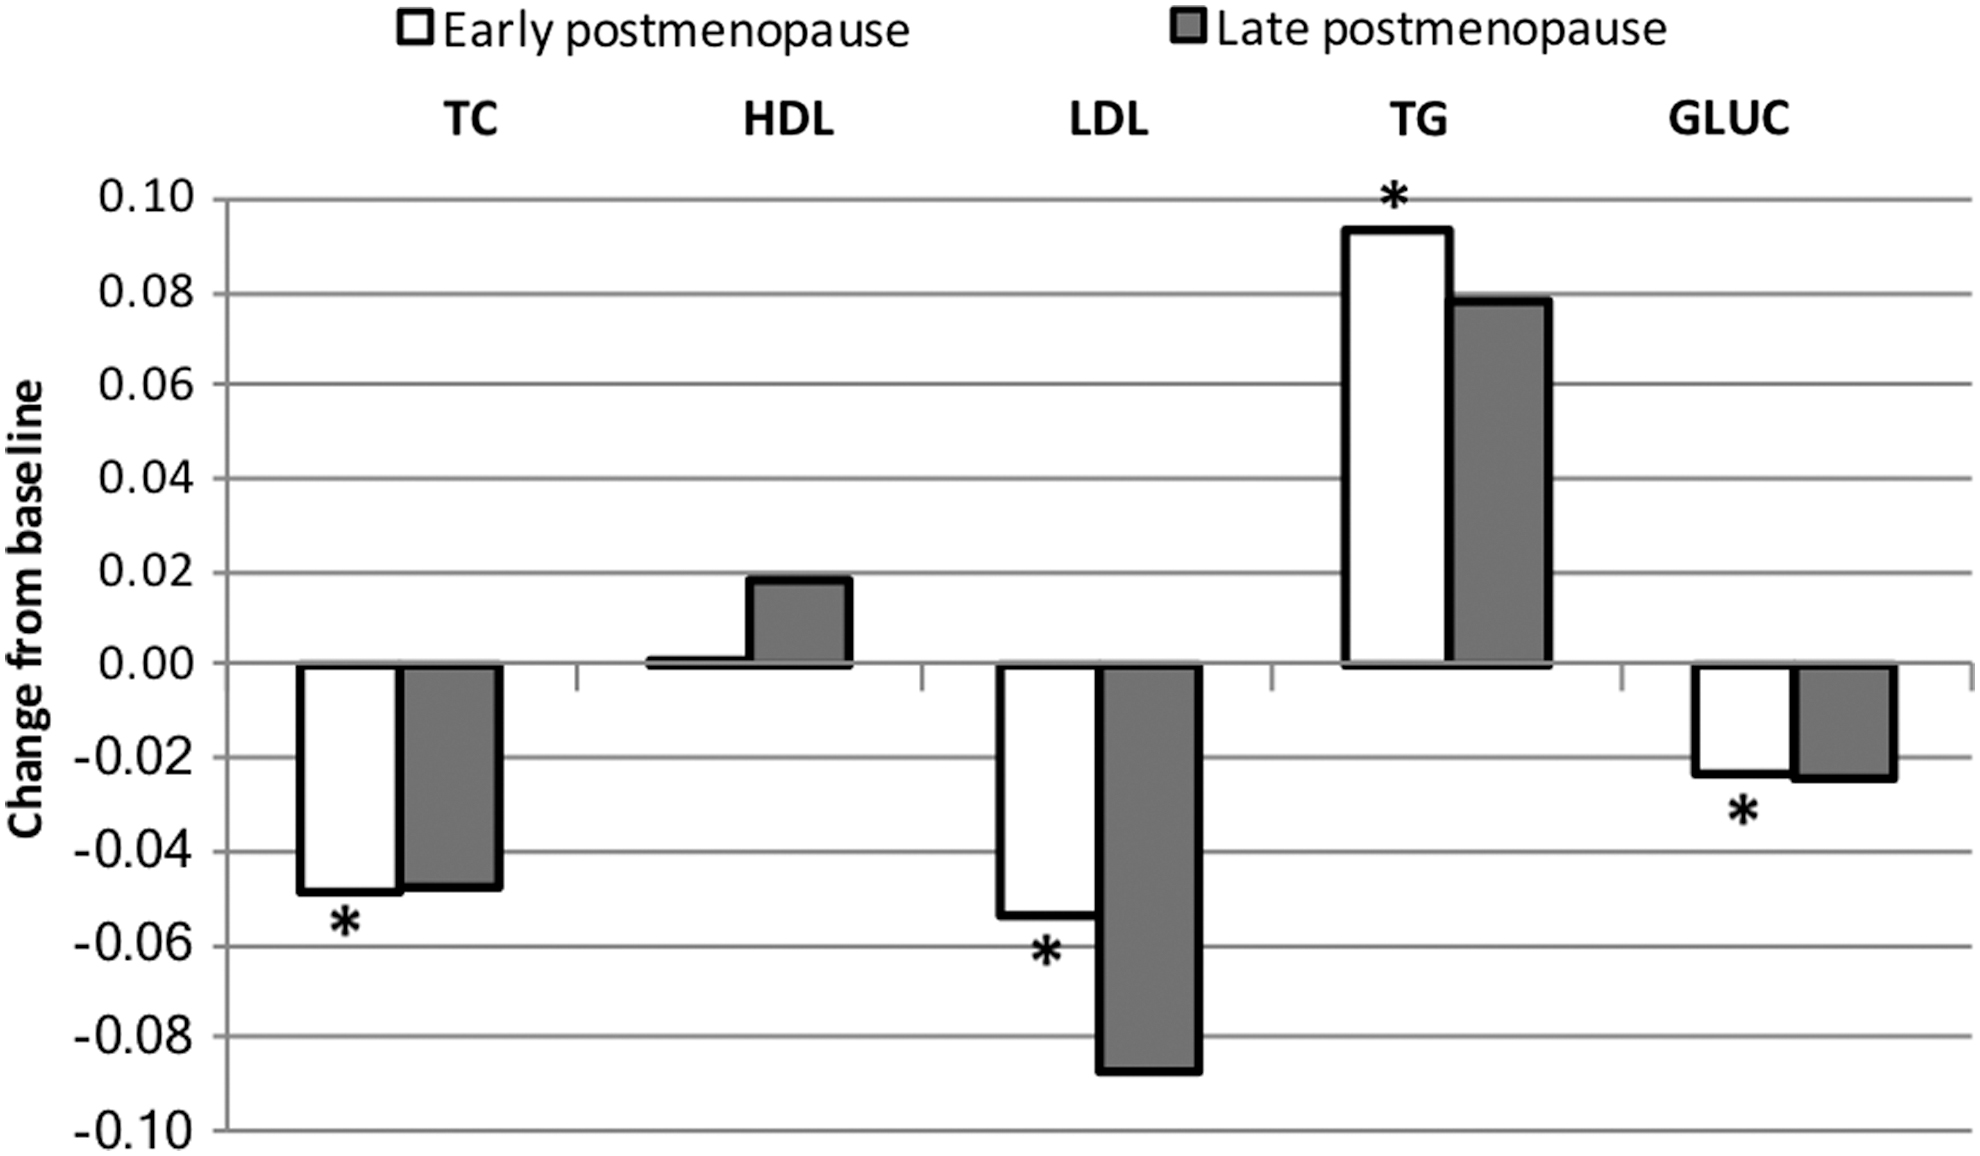
Estimated changes from baseline of metabolic measures per 1-pg/mL increase in estradiol levels by postmenopausal strata. Estimates are from linear mixed-effects models adjusted for baseline measure and P4 level. Interaction p-value tests interaction between E2 levels and time since menopause (years). *Significant change from baseline (p < 0.004).
P4 analysis
No significant main effect of the serum P4 level on any metabolic measure was found. The serum P4 level did not alter the association of E2 dose and serum E2 levels with any metabolic measure (p > 0.05).
Use of lipid-lowering medication
Current use of lipid-lowering medication was tested as a possible confounder of the associations of E2 dose, E2 levels, and P4 levels with metabolic measures. Use of lipid medication did not confound any association of interest. In addition, we stratified the analysis based on current use versus nonuse of lipid-lowering medication; the associations of E2 dose and E2 levels with metabolic measures were not different.
Discussion
This study showed that there were significant associations of E2 dose and levels with lipid and glucose levels among early postmenopausal women, and the effect of E2 dose was not apparent in late postmenopausal women 10 years or more since menopause. The E2 dose effect on lipid levels found in this study is consistent with the dose-dependent E2 effect on changes in lipid levels reported from a meta-analysis comparing the effect of conventional-dose HT (0.625 mg CEE and equivalent doses of other formulations) with low-dose HT (≤0.3 mg CEE and equivalent doses of other formulations) on CHD risk factors among 3,360 women. 9 Although when compared with placebo, low-dose HT significantly decreased TC and LDL-C levels, the effect of low-dose HT on lipid level reduction was not as strong as conventional-dose HT, which showed the lowest TC and LDL-C levels when compared with low-dose HT and placebo. 9
The E2 dose was positively associated with the HDL-C level, but inversely associated with TC and LDL-C levels among early postmenopausal women. With increasing E2 dose, the decreased TC, LDL-C, and GLUC levels and increased HDL-C and TG levels from baseline statistically significantly differed between early and late postmenopausal women (interaction p < 0.03). The more favorable effect of E2 dose on TC, LDL-C, HDL-C, TG, and GLUC among early postmenopausal women may explain, in part, the beneficial E2 effect on atherosclerosis in early, but not late, postmenopausal women as reported in the Early versus Late Intervention Trial with Estradiol (ELITE), 13 a randomized, double-blinded placebo-controlled trial that showed a differential effect of E2 on atherosclerosis progression between early and late postmenopausal women.
On examining associations of E2 levels with metabolic variables, TC, LDL-C, and GLUC were decreased and HDL-C and TG levels were increased with higher E2 levels; estimates of associations were of similar magnitude among both early and late postmenopausal women. The statistically significant change among early, but not late, postmenopausal women may be due to the larger sample size of the early postmenopausal group yielding higher power of statistical results. However, on examining associations of the E2 dose with metabolic variables, associations were of smaller magnitude in early compared with late postmenopausal women, with significant tests of interaction. These associations with E2 dose provide support for the conclusion that the effects of E2 dose (but not E2 level) on these metabolic variables differ by time of initiation of HT relative to menopause.
Associations of higher E2 dose and E2 levels with a favorable lipid profile and lowered GLUC level found in this study were consistent with the meta-analysis that HT had favorable metabolic effects when compared with placebo. 6 In addition, HT has been shown to significantly decrease the incidence of diabetes by 12%–35%. 20 –22 A pooled analysis demonstrated that HT decreased new-onset diabetes by 30% (hazard ratio = 0.7; 95% confidence interval 0.6–0.9) compared with placebo. 6 Our analysis showed significant GLUC reduction with higher E2 dose and E2 levels among early, but not late, postmenopausal women.
We were not able to identify explanatory factors related to these different results between E2 dose and E2 levels in the REPLENISH data. Time-since-menopause strata, current smoking, race, weight, body–mass index, and use of lipid-lowering medication were equally distributed among all E2 doses. An analysis restricted to women who were treated (excluding women who received placebo) showed similar results to the analysis among the total sample. The different effects of E2 dose and E2 levels on metabolic factors in this study may be due to differences in pharmacokinetics of E2 between early and late postmenopausal women. The change in lipid levels from statin therapy differs by age in both men and women, although the precise mechanism is unknown. 23 This different association of E2 dose and E2 levels with metabolic factors requires further exploration; future studies will evaluate determinants of attained E2 levels in response to HT.
Serum P4 showed no significant effect on metabolic measures, nor did it have a confounding effect of E2 dose and E2 levels on any metabolic measure. A pooled analysis of 248 prospective studies showed that progestin had some opposing effect on estrogen-induced reduction of TC and LDL-C; in addition, progestin attenuated the estrogen effect on increased HDL-C and TG levels among postmenopausal women. 24 Although progestin may attenuate the estrogen effect on certain lipid levels, previous studies showed that P4 had no significant effect. In the PEPI trial, CEE plus P4 increased HDL-C similarly to CEE alone, which was significantly higher than CEE plus MPA. There was no significant difference of LDL-C and TG levels between CEE alone, CEE plus P4, and CEE plus MPA. 8
Among early postmenopausal women, the higher E2 dose and E2 levels were associated with a more desirable metabolic profile. With a higher E2 dose, changes in lipid and glucose levels were attenuated with longer time since menopause. As E2 was reported to significantly reduce atherosclerosis progression compared with placebo among early postmenopausal women, 13,25 findings from this study suggest that the protective E2 effect on atherosclerosis in early postmenopause may be explained, in part, through the E2 effect on changes in lipid and glucose levels. According to the HT timing hypothesis, women benefit more from HT when it is initiated closer to menopause; this study supports the idea that the benefit could be due to favorable changes in lipid and glucose levels, especially LDL-C and HDL-C.
Although the findings from this study support the HT timing hypothesis, further study is needed to explain biological mechanisms that may underlie the differential effects of E2 dose and E2 levels on metabolic measures in early and late postmenopausal women. Metabolism of exogenous E2 occurs mainly in the liver through cytochrome P450, which is also involved in lipid metabolism. 26 Metabolism of E2 through several types of E2 receptors in the liver is complex and needs further investigation. 27 We propose that the differential effect between early and late postmenopausal women may be due to reduced E2 responsiveness resulting from reduced E2 receptor number and/or function with aging. 28
The strengths of this analysis include use of data from a randomized, placebo-controlled clinical trial with balanced baseline characteristics among 4 different randomized doses of E2. This is the first study to explore the effects of different doses of combined oral E2 and P4 regimens on metabolic factors according to time since menopause. The analysis using repeated measures over a 12-month follow-up period reduces the variability of measures, reducing measurement errors. Results from this study may be generalizable to healthy White or African American postmenopausal women using HT who are within 6 years since menopause or ≥10 years since menopause and with body–mass index ≤34 kg/m2. Limitations included a limited sample size in the late postmenopausal group, which could limit the statistical power to detect associations, and lack of other CVD-related metabolic measures such as apolipoprotein particles, insulin, and homeostasis model assessment of insulin resistance score. The generalization of results may be limited to healthy postmenopausal women as we excluded participants with high risk for CVD. Late postmenopausal women in this study were relatively young (≤60 years old) when randomized to HT, suggesting premature and early menopause in the study sample that may not be generalizable to the majority of women who experience natural menopause. However, with similar age among early and late postmenopausal women, these data allow for a stronger test of the hypothesis of time since menopause with less confounding by age.
Conclusions
This study showed that there were significant associations of both E2 dose and serum E2 levels with lipid and glucose levels among early postmenopausal women. The effect of the E2 dose was not apparent in late postmenopausal women with 10 or more years since menopause. The differential effects of E2 dose on metabolic measures among early compared with late postmenopausal women support the timing hypothesis of E2 therapy and its cardiovascular benefits.
Authors' Contributions
I.S. conducted the analysis, interpreted results, and wrote the article. H.N.H. designed the study, interpreted results, and wrote the article. B.B. provided the dataset and commented on the article. S.M. provided the dataset and commented on the article. W.J.M. designed the study, supervised the analysis, interpreted results, and wrote the article.
Disclaimer
The current study was USC investigator initiated, and TherapeuticsMD and its employees had no role in generation of the hypothesis, design of the data analysis, conduct of the data analysis, or interpretation of data, and USC investigators authored the article independently of TherapeuticsMD.
Footnotes
Author Disclosure Statement
I.S., H.N.H., and W.J.M. received an unrestricted research grant from TherapeuticsMD. B.B. and S.M. are employees of TherapeuticsMD and own stock/stock options of the company. B.B. is also a board member of the company.
Funding Information
This study was supported by an unrestricted research grant from TherapeuticsMD.