




Abstract
Background:
Preterm delivery is associated with a 1.4- to 2-fold increased risk of cardiovascular disease (CVD), but inclusion of preterm delivery in CVD risk prediction algorithms has not been tested. We evaluated whether including preterm delivery and parity in CVD risk scores improved identification of women at high risk versus scores based on traditional risk factors.
Methods:
We predicted 10-year CVD risk using 119,587 observations contributed by 76,512 women ≥40 years of age and 20-year CVD risk with 72,533 women ≥40 years of age and 72,872 women ≥30 years of age from the Nurses' Health Study II. Cox proportional hazards models were fit with established CVD risk factors (Model 1) and established risk factors plus preterm delivery and parity (Model 2). We evaluated model fit, calibration, discrimination, and risk reclassification.
Results:
Very preterm delivery (<32 weeks) was associated with CVD in all 10- and 20-year models that included the established CVD risk factors (e.g., hazard ratio: 1.61, 95% confidence interval: 1.19 to 2.20 in 10-year risk model). Model 2 had improved fit relative to Model 1, but discrimination was not improved in Model 2 based on the C-difference or net reclassification index. Similar models for 20-year CVD risk prediction at age ≥30 years indicated improved discrimination when including preterm delivery and parity.
Conclusions:
Incorporating preterm delivery and parity into CVD risk scores appears most useful when women are young, before they develop established CVD risk factors. Observed improvements in risk prediction were small and warrant further investigation to confirm our findings and assess utility in a clinical setting.
Introduction
Cardiovascular disease (CVD) is the leading cause of morbidity and mortality in the United States, resulting in over 800,000 deaths in 2014. 1 Identification of individuals at high risk for CVD is essential to prevent its development, target screening, and ultimately reduce the burden of CVD.
To identify people at high risk, established CVD risk factors, including blood pressure, antihypertensive medication use, total and high-density lipoprotein (HDL) cholesterol, smoking, and diabetes, have been incorporated into risk scores to predict 10-year and long-term CVD risk. 2 –5 More recently, female-specific CVD markers, such as preeclampsia, gestational diabetes mellitus, preterm delivery, and birth of an infant small for gestational age, have been recognized as predictors of CVD. 6 In 2011, the American Heart Association (AHA) endorsed some pregnancy complications as risk factors for CVD in women and suggested that clinicians obtain a pregnancy history. 6
Ten percent of deliveries in the United States are preterm 7 and women who have delivered an infant preterm have a 1.4- to 2-fold increased risk of CVD. 8 –16 In addition, <20% of this elevated CVD risk appears due to development of classic CVD risk factors such as hypertension, hypercholesterolemia, and type 2 diabetes mellitus after pregnancy. 16 Since traditional CVD risk scores utilize information on blood pressure, diabetes, and lipids and much of the increased risk associated with preterm delivery is independent of these, 16 the addition of preterm delivery into risk algorithms has the potential to improve CVD risk prediction in women. Furthermore, information on history of preterm delivery is available at no cost and typically before development of CVD risk factors (i.e., when women are in their 20s and 30s). As such, preterm delivery may offer practical advantages over risk factors already included in CVD risk scores.
To evaluate whether inclusion of preterm delivery into 10-year and long-term CVD risk scores improves prediction in women, we compared the performance of models using established CVD risk factors to models that additionally included preterm delivery and parity. We hypothesized that incorporation of preterm delivery would improve identification of women at high risk. Furthermore, since preterm delivery typically occurs in young adulthood before development of clinical CVD risk factors, we hypothesized that its utility would be greatest at younger ages.
Methods
Study population
The Nurses' Health Study II (NHSII) is a longitudinal, prospective cohort of 116,429 nurses with follow-up beginning in 1989, when participants were 25–42 years of age. Participants were mailed questionnaires biennially, which collected information on lifestyle and behavioral factors and incident disease. The response rate for each questionnaire cycle is >90%. This study was approved by the Partners Human Research Committee of Brigham and Women's Hospital (IRB protocol number: 1999P003389). Questionnaire return was considered informed consent.
Established CVD risk factors
Participants reported current smoking, antihypertensive medication use, and incident diabetes diagnoses (not during pregnancy) on all biennial questionnaires. Self-reported diabetes was confirmed by American Diabetes Association criteria 17,18 using a supplemental questionnaire regarding symptoms, diagnostic tests, and treatment. A validation study in a similar cohort confirmed 98% of self-reported diabetes diagnoses. 19 In 1989 and 1999, participants self-reported “current usual blood pressure (if checked within 2 years)” in categories. The midpoint of each systolic blood pressure (SBP) category was assigned as the continuous SBP for each woman. Validation of self-reported hypertension in a subset of NHSII participants resulted in 94% sensitivity and 85% specificity. 20
Plasma total and HDL cholesterol were measured in blood samples in a subset of NHSII women who were included in previous substudies (nested case–control studies of chronic disease or cohort studies of lifestyle exposures). In total, 29,611 women provided a blood sample between 1996 and 2001. Measured total cholesterol was available in 3,994 participants after excluding women who did not complete the questionnaire at the time of blood draw (n = 373), did not have total cholesterol measured in their blood sample (n = 24,923), had cancer before the blood draw (n = 13), were missing laboratory information (n = 2) or data on diet or body mass index (BMI) before blood draw (n = 305), or had measured cholesterol >500 mg/dL (n = 1). Measured HDL cholesterol was available for 1,182 women after excluding those who did not complete the questionnaire at the time of blood draw (n = 373), did not have HDL cholesterol measured in their blood sample (n = 28,000), had cancer before the blood draw (n = 13), or were missing data on diet or BMI before blood draw (n = 43).
Multivariable linear regression models were fit separately in women with measured total and HDL cholesterol and included the following covariates as predictors: age, race, smoking, alcohol consumption, BMI, physical activity, menopausal status, postmenopausal hormone use, hypertension, type 2 diabetes mellitus, serum cholesterol (self-reported in categories in 1989), elevated cholesterol, family history of CVD before age 60, fiber intake, total caloric intake, and percent calories from polyunsaturated fatty acids, monounsaturated fatty acids, saturated fat, trans fat, and protein. Covariate information was taken from the blood questionnaire or the biennial questionnaire closest, but prior, to the blood draw. Women who were missing information on the covariates included in the total and HDL cholesterol prediction models were assigned missing total and HDL cholesterol values and were excluded from the CVD risk prediction analysis.
Predicted total and HDL cholesterol were calculated for each woman in NHSII at each questionnaire cycle by multiplying each regression coefficient by that woman's covariate values and summing across covariates. The top and bottom 0.5% of predicted total and HDL cholesterol at each questionnaire cycle were set to missing to avoid extreme values. For the subset of women with measured total and HDL cholesterol, we calculated Spearman correlations between their measured values and predicted values in 1997 and 1999, the questionnaire cycles closest to the blood draw. In 1997 and 1999, we observed correlations of 0.56 and 0.58, respectively, for total cholesterol and 0.52 and 0.50, respectively, for HDL cholesterol.
Preterm delivery and parity
In 2009, women provided the gestation length of all pregnancies (<8, 8–11, 12–19, 20–27, 28–31, 32–36, 37–39, 40–42, and ≥43 weeks). For women who did not complete the 2009 questionnaire (n = 10,644), data from the 2001 questionnaire (which queried gestation length of pregnancies lasting ≥12 weeks) were used. Gestation length categories were collapsed into term (≥37 weeks), moderate preterm (32 to <37), and very preterm (20 to <32). Women were assigned to the category that corresponded to their shortest gestation length at the time of entry into the risk prediction model. Women who reported at least one pregnancy lasting ≥20 weeks were considered parous. Gestation length and parity were combined into a four-category variable: nulliparous, term, moderate preterm, and very preterm.
Self-reported gestation length was validated against medical records in 403 NHSII participants who reported preeclampsia/toxemia between 1991 and 2001. This yielded an 81% sensitivity and 92% specificity for dichotomous preterm delivery (term and preterm) and a Kappa statistic of 0.74 for three categories of preterm delivery (term, moderate preterm, and very preterm), suggesting good validity.
CVD endpoints
In 1989, participants reported previous diagnoses of “myocardial infarction (MI) or angina” and “stroke (CVA) or transient ischemic attack (TIA).” On subsequent biennial questionnaires, participants self-reported physician diagnoses and year of incident MI or stroke. Permission to obtain medical records was requested from participants who reported a diagnosis or their next of kin. MIs were confirmed using World Health Organization criteria of acute symptoms plus elevated cardiac enzymes or diagnostic electrocardiographic findings, 21 while fatal coronary heart disease (CHD) was confirmed with hospital or autopsy records if CHD was noted as the cause of death in a woman with a history of CHD. Strokes were classified using National Survey of Stroke criteria, which require neurological deficit with sudden or rapid onset that persisted for ≥24 hours or until death. 22 Events for which medical records were obtained and met the above criteria were considered definite, while those acknowledged by the participant or next of kin, but for which records were not acquired were considered probable. Our analysis included definite or probable MI, fatal CHD, and fatal and nonfatal stroke.
Exclusions
To maximize the 25 years of follow-up from 1989 to 2013 in 10-year risk prediction, we divided the time into three independent intervals of ≤10 years: 1989–1993, 1994–2003, and 2004–2013. We created these ≤10-year intervals starting at the end of follow-up in 2013 and going backwards to enable the complete 10-year intervals to capture the years when we expected women to be at the highest risk of CVD. Women contributed person-time to one or more of these intervals if they met the eligibility criteria at the start of each interval. The following exclusion criteria were applied at each interval: <40 years of age (since the Pooled Cohort Equations were developed in people ≥40 years of age 2 ); CVD, death, or lost to follow-up; missing pregnancy history; missing year of pregnancy; ≤13 or >50 years of age at first birth; or missing model covariate information. This yielded 119,587 observations contributed by 76,512 women (Fig. 1).
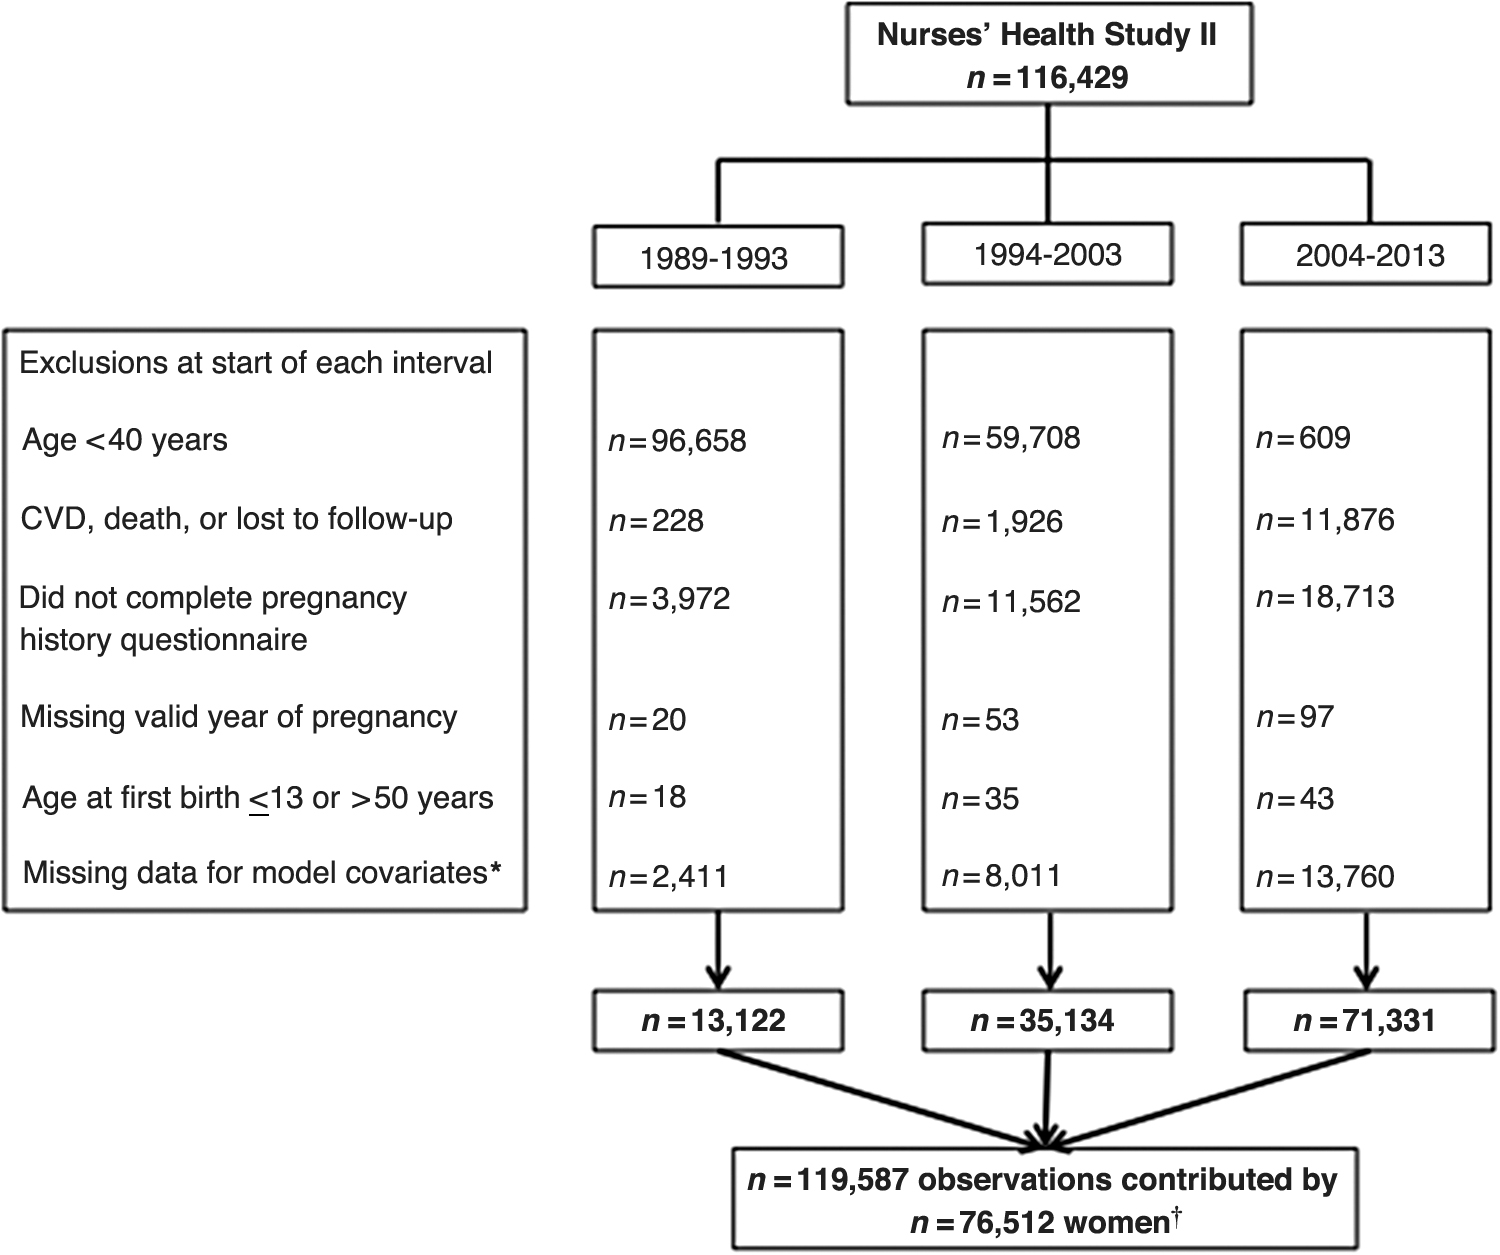
Flow diagram of NHSII participants and exclusion criteria by time period of follow-up for 10-year CVD risk prediction. *Current smoking, SBP, total cholesterol, or HDL-cholesterol. † N = 44,130 women contributed person-time to the analysis from only one interval, n = 21,689 women contributed person-time to the analysis from two intervals, and n = 10,693 women contributed person-time to the analysis from all three intervals. CVD, cardiovascular disease; HDL, high-density lipoprotein; NHSII, Nurses' Health Study II; SBP, systolic blood pressure.
For longer term CVD risk prediction, we did not divide active follow-up into intervals. Rather, we employed 20-year risk prediction models in which women contributed person-time from the first questionnaire cycle in which they reached the eligible age for entry (≥40 or ≥30 years of age depending on the model), were under active follow-up, and were not excluded based on the other criteria listed above. For 20-year risk prediction, we tested separate models, including women ≥30 years (n = 72,872) and ≥40 years (n = 72,533) of age.
Statistical analysis
Baseline characteristics were age standardized and compared by preterm delivery and parity. The parameterization of the established CVD risk factor model was adapted from the Pooled Cohort Equation for white women, 2 as 93% of our sample was white. The Pooled Cohort Equation is based on a Cox proportional hazards model, including log transformations of age, age squared, total and HDL cholesterol, treated SBP (if on antihypertensive medication, 0 otherwise) and untreated SBP (if not using antihypertensive medication, 0 otherwise), indicators for current smoking and diabetes, and interactions between age and all variables, except diabetes. We evaluated the fit of this model in our data compared to simpler models without log transformations and age interactions and found similar or better fit with a simpler model. Thus, our final model with established CVD risk factors (Model 1) included (untransformed) age, age squared, total and HDL cholesterol, treated SBP, untreated SBP, and indicators for current smoking and diabetes. The new model (Model 2) additionally included indicators for nulliparity, moderate preterm, and very preterm.
To evaluate the utility of preterm delivery and parity in CVD risk prediction, we followed the criteria for evaluation of novel risk markers from the AHA. 23 Multivariable Cox proportional hazards models were fit with the established CVD risk factors (Model 1) and with the established risk factors plus preterm delivery and parity (Model 2). For 10-year risk prediction, in which women could contribute multiple observations, we incorporated the robust sandwich covariance matrix estimate to account for correlated data. We compared the fit of these two models using the Akaike information criterion (AIC) and a likelihood ratio test. Calibration of each model was investigated using the Greenwood-Nam-D'Agostino test in which a nonsignificant p-value signifies sufficient calibration. 24 Discrimination was determined by calculating the C-index, an extension of the area under the receiver-operating characteristic curve for censored data, 25 for Model 1 and Model 2, and the difference in C-indices. 26 Net reclassification statistics, including the overall net reclassification index (NRI), and the NRIs separately for women with and without a CVD event, were calculated using predetermined categories of low (<5%), intermediate (5 to <10%), and high (≥10%) risk, given the lower predicted risk of CVD in women compared to men. 27,28 Reclassification was also assessed using the continuous NRI and integrated discrimination improvement, which are not based on risk categories. Confidence intervals (CIs) for discrimination and reclassification statistics were calculated using 1,000 bootstrap samples. Calibration, discrimination, and reclassification statistics were estimated using publicly available SAS macros. 29
Sensitivity analyses
An alternative dichotomous risk cut point of 7.5% was employed for the net reclassification statistics based on the American College of Cardiology and AHA's 2013 recommendations for initiation of statin therapy. 30 We also utilized BMI in place of predicted total and HDL cholesterol based on a previously proposed nonlaboratory-based CVD risk score. 31 We corrected for potential overfitting by adjusting for optimism using 1,000 bootstrap samples in discrimination and reclassification statistics. Finally, given that hypertensive disorders of pregnancy (HDP) are associated with CVD 32,33 and are an indication for preterm delivery, 34 we excluded women with HDP. All analyses were conducted using SAS 9.4 (SAS Institute, Inc., Cary, NC).
Results
Table 1 summarizes age-standardized characteristics at each entry into the 10-year risk prediction model. Each woman is represented up to three times based on the number of intervals to which she contributed person-time in 10-year risk prediction since her covariate values were allowed to change each time she entered the analysis. Approximately 4% of parous observations delivered at least one infant very preterm (20 to <32 weeks) and about 10% delivered moderately preterm (32 to <37 weeks). Nulliparous women contributed 18% of observations. Established CVD risk factors were generally similar across preterm delivery and parity status, although women who delivered very preterm were slightly more likely to use antihypertensive medication and women who had term births (≥37 weeks) were less likely to be smokers and have diabetes.
Age-Standardized Characteristics of Nurses' Health Study II Participants by Preterm Delivery Status for 10-Year CVD Risk Prediction
Values are means (SD) or percentages and are standardized to the age distribution of the study population.
Values of polytomous variables may not sum to 100% due to rounding.
Each woman is represented up to three times based on the number of intervals to which she contributed person-time in the 10-year risk prediction, since her covariate values were allowed to change each time she entered the analysis.
Moderate preterm delivery is delivery of an infant ≥32 to <37 weeks of gestation. Very preterm delivery is delivery of an infant ≥20 to <32 weeks of gestation.
Value is not age adjusted.
Total cholesterol and HDL-cholesterol are predicted from measured values in a subset of women.
CVD, cardiovascular disease; HDL cholesterol, high-density lipoprotein cholesterol; SBP, systolic blood pressure; SD, standard deviation.
Ten-year risk prediction at ≥40 years of age
We observed 816 incident cases of CVD. All established CVD risk factors were associated with an increased risk of CVD, except HDL cholesterol in which higher levels reduced risk of CVD (Table 2, Model 1). In a crude model, very preterm delivery was associated with an increased rate of CVD (hazard ratio [HR]: 1.74, 95% CI: 1.28 to 2.37), which was slightly attenuated, but persisted in the model, including the established CVD risk factors (HR: 1.61, 95% CI: 1.19 to 2.20; Table 2, Model 2). HRs for moderate preterm delivery suggested an increased risk of CVD, but were not significant in crude (HR: 1.17, 95% CI: 0.91 to 1.50) or adjusted (HR: 1.12, 95% CI: 0.88 to 1.44) models (Table 2).
HRs, 95% CIs, and p-Values for Preterm Delivery and Parity in Crude Models, for the Risk Factors in the Established 10-Year CVD Risk Model (Model 1), and for the Risk Factors, Preterm, and Parity in the Established 10-Year CVD Risk Model Plus Preterm and Parity (Model 2)
Continuous variables centered at the mean.
Reference group for preterm and parity is term delivery.
CI, confidence interval; HR, hazard ratio.
Model 2 offered improved fit with a lower AIC and significant likelihood ratio test (p = 0.03; Table 3) in 10-year CVD risk prediction. However, the addition of preterm delivery and parity did not improve discrimination (C-index: Model 1 = 0.69 and Model 2 = 0.69; C-difference: 0.002, 95% CI: −0.001 to 0.004) or calibration. While Model 1 was adequately calibrated (p = 0.06), Model 2 was not, which was driven by poor calibration in the fifth decile of predicted risk based on its larger contribution to the Greenwood-Nam-D'Agostino test statistic (Table 3 and Supplementary Fig. S1). Similarly, overall net reclassification was not improved by Model 2 (NRI: 0.002, 95% CI: −0.005 to 0.008) nor was the NRI for CVD events (NRI for events: 0.002, 95% CI: −0.004 to 0.009; Table 4). In contrast, the NRI for nonevents was worsened with inclusion of preterm delivery and parity as 58 observations were incorrectly reclassified into higher risk categories, while only 29 were correctly reclassified into lower risk categories (NRI for nonevents: −0.0002, 95% CI: −0.0004 to −0.0001; Table 4).
Model Fit, Discrimination, and Calibration Statistics in 10- and 20-Year CVD Risk Prediction Based on Established CVD Risk Model (Model 1) and on Established CVD Risk Model Plus Preterm Delivery and Parity (Model 2)
Ten-year risk prediction model allows women to enter one, two, or three times at the start of each ≤10-year interval (1989–1993, 1994–2003, and 2004–2013) if they meet the eligibility criteria at the beginning of each interval.
p-Value is from a likelihood ratio test comparing nested models.
GND test; nonsignificant p-value indicates sufficient calibration.
Overall NRI using three categories: <5%, 5% to <10%, and ≥10%.
Women enter the 20-year risk prediction models once: the first questionnaire cycle at which they are ≥40 years of age and meet the eligibility criteria.
Women enter the 20-year risk prediction models once: the first questionnaire cycle at which they are ≥30 years of age and meet the eligibility criteria.
AIC, Akaike information criterion; GND, Greenwood-Nam-D'Agostino; NRI, net reclassification index.
Net Reclassification of 10-Year CVD Risk at ≥40 Years of Age into Low (<5%), Intermediate (≥5 to <10%), and High (≥10%) Risk Groups Comparing the Established Risk Factor Model (Model 1) to a Model with the Established Risk Factors Plus Preterm Delivery and Parity (Model 2)
NRI: 0.002, 95% CI: −0.005 to 0.008, p = 0.52.
NRI for events: 0.002, 95% CI: −0.004 to 0.009, p = 0.47.
NRI for nonevents: −0.0002, 95% CI: −0.0004 to −0.0001, p = 0.002.
Continuous NRI: 0.06, 95% CI: −0.003 to 0.13, p = 0.07.
IDI: 0.0002, 95% CI: 0.0001 to 0.0003, p < 0.0001.
IDI, integrated discrimination improvement.
Twenty-year risk prediction at ≥40 years of age
Very preterm delivery was associated with a 78% (95% CI: 1.34 to 2.36) increased risk of CVD in the 20-year risk model at ≥40 years of age with the established CVD risk factors (Supplementary Table S1). The inclusion of preterm delivery and parity improved model fit and yielded a lower AIC and significant likelihood ratio test (p = 0.003; Table 3). Discrimination and net reclassification statistics were not improved (Table 3 and Supplementary Table S2), but both the model with established CVD risk factors and the model that additionally included preterm delivery and parity were well calibrated (Model 1: p = 0.71 and Model 2: p = 0.78; Table 3 and Supplementary Fig. S1).
Twenty-year risk prediction at ≥30 years of age
The addition of preterm delivery and parity to a 20-year risk prediction model including established CVD risk factors for women ≥30 years of age resulted in a lower AIC and significant likelihood ratio test (p < 0.001; Table 3). Discrimination was also improved (C-difference: 0.004, 95% CI: 0.001 to 0.008), and both models were sufficiently calibrated (Model 1: p = 0.77 and Model 2: p = 0.86; Table 3 and Supplementary Fig. S1). In addition, the overall net reclassification was improved with inclusion of preterm delivery and parity; this was driven by a small improvement in women with CVD events (NRI for events: 0.01, 95% CI: 0.003 to 0.02; Table 3 and Supplementary Table S3). Model 2 correctly reclassified 11 women (1.2%) with CVD events into higher risk categories, while incorrectly reclassifying only 2 women (0.2%) into lower risk categories. However, the NRI for nonevents was significantly diminished (NRI for nonevents: −0.0005, 95% CI: −0.0008 to −0.0001; Supplementary Table S3).
Sensitivity analyses
When we used a dichotomous cut point of 7.5% for risk reclassification, results were similar, with the exception of 20-year risk prediction at ≥30 years of age in which the overall NRI and NRI for events were no longer significantly improved after adding preterm delivery and parity (NRI for events: 0.005, 95% CI: −0.003 to 0.01). Adjustment for optimism, restriction to definite cases, and exclusion of women with HDP also yielded similar results (data not shown). Finally, the use of BMI in our models instead of predicted total and HDL cholesterol largely did not change our conclusions; however, discrimination in 20-year risk prediction at ≥40 years of age was improved with the inclusion of preterm delivery and parity (C-difference: 0.006, 95% CI: 0.0005 to 0.01).
Discussion
The addition of preterm delivery and parity to a risk prediction model including established CVD risk factors improved model fit in 10- and 20-year risk prediction for women at age 40 or older and at age 30 or older. Calibration, or how close the predicted risk of CVD is to the observed risk of CVD, was similar in Models 1 and 2 for both 20-year risk prediction models. However, discrimination, or how well a model separates women who have CVD events from those who do not, and net reclassification of women with CVD events were improved only in the 20-year risk prediction model for women ≥30 years of age. These results are consistent with our hypothesis that preterm delivery and parity would be more useful in risk prediction at younger ages, before women develop established CVD risk factors.
While discrimination was improved in 20-year risk prediction at ≥30 years of age, the C-difference was only 0.004 and, thus, is unlikely to result in meaningful clinical change. However, the small change in the C-index is not surprising; the C-statistic is often insensitive to change even with the addition of predictors of the outcome. 35 While 11 women (1.2%) who went on to have a CVD event were correctly reclassified into higher risk categories based on the model with preterm delivery and parity, this came with a cost, as 93 women (0.1%) who did not have a CVD event were incorrectly reclassified into higher risk categories. Classifying women into higher risk categories may result in earlier or increased screening, lifestyle modifications, and pharmacologic therapy. These interventions would be appropriate among women who ultimately experience a CVD event, but may yield unnecessary medical care in the small proportion of women (e.g., 0.1% in our low-risk population) who do not need it for CVD risk reduction. Furthermore, of the 93 women who did not have a CVD event and were incorrectly reclassified into higher risk categories, the majority (78%, n = 73) did not cross the 7.5% risk threshold for initiation of statin therapy based on the model, including preterm delivery and parity. Thus, in this low-risk population, any additional medical care provided to these women is likely to be screening and lifestyle modifications, rather than pharmacologic therapy. Finally, whether this small improvement in risk reclassification for women with CVD events translates to improved clinical outcomes cannot be determined with these data.
Further research should assess whether use of preterm delivery in a 20-year risk prediction model improves clinical CVD outcomes relative to women who are managed using the established CVD risk score, as well as the cost-effectiveness of incorporating information on preterm delivery into clinical practice. 23 Despite the limited improvement in risk prediction with the inclusion of preterm delivery and parity, this information may offer practical advantages over established CVD risk factors in that it is easy to collect, can be provided by the patient without tests, and is generally available when women are in their 20s or 30s. In addition, given the availability of information on preterm delivery when women are young—generally before development of hypertension, hypercholesterolemia, and type 2 diabetes—preterm delivery may be particularly advantageous for use in primordial prevention.
Three studies have evaluated the utility of including pregnancy complications in 10-year CVD risk prediction scores. 36 –38 Only one assessed the utility of preterm delivery. In their Norwegian population, preterm delivery was not associated with CVD when established risk factors were included in the model. 36 This is in contrast to our results, in which very preterm delivery remained associated with an increased rate of CVD even after established risk factors were accounted for. However, both studies suggest that incorporating preterm delivery does not meaningfully improve 10-year CVD risk prediction. 36
The primary limitation in our analysis is the reliance on predicted total and HDL cholesterol rather than measured values. However, correlations between measured and predicted values suggested good validity. 39 Also, a sensitivity analysis using BMI instead of predicted total and HDL cholesterol yielded similar conclusions to our primary analysis. There may also be misclassification as nurse participants self-reported gestation length and SBP. However, previous NHSII validation studies of both suggested good validity compared to medical records. 20 In addition, the use of self-reported preterm delivery mimics the clinical setting in which women would tell their doctors if they had ever delivered an infant preterm. Given that data on gestation length were extracted from the 2001 or 2009 questionnaire, participants had to survive until these years to report the information. However, 98.3% of NHSII participants were still alive in 2009.
We were unable to evaluate the utility of including preterm delivery and parity into 30-year CVD risk prediction models 3 because the longest follow-up in our cohort was 25.6 years. While the evaluation of a 20-year risk prediction model is a first step, further research is needed to investigate longer term CVD risk prediction utilizing preterm delivery. Our study population was predominately white; thus, our results may not be generalizable to other races, particularly African Americans, in whom preterm delivery is more prevalent 40 and may impact CVD risk prediction differently. In addition, the large majority of women in our population were classified as low risk by both the established risk factor model and the model additionally incorporating preterm delivery and parity. In the 20-year risk prediction at ≥40 years of age, the analysis with the highest predicted probability of CVD, the mean predicted risk was 1.5% and 83% of women had a predicted risk <2%, making it difficult for the new model with preterm delivery and parity to reclassify a substantial proportion of women with CVD into even the intermediate risk category (5% to <10%). Finally, the relatively low prevalence of very preterm delivery may limit its utility on a population level; however, given its strong association with CVD, it remains of importance on an individual level.
Despite these limitations, our large study population with long follow-up allowed us to evaluate the inclusion of preterm delivery and parity in 10- and 20-year risk prediction models and at different ages. In addition, CVD events were confirmed by medical record review. Finally, to our knowledge, this is the first study to investigate the utility of preterm delivery in CVD risk prediction models in the United States and the first to evaluate models beyond 10-year risk.
In conclusion, incorporating preterm delivery and parity into CVD risk prediction models appears most useful when women are young before they develop the established CVD risk factors that are currently the foundation of clinically used CVD risk scores. However, the observed improvements in risk prediction with the inclusion of preterm delivery and parity were small and assessing a combination of female-specific risk factors might prove to be more clinically useful. Regardless, incorporation of preterm delivery and parity warrants further investigation to confirm our findings and assess the utility in a clinical setting.
Footnotes
Acknowledgment
We thank the Nurses' Health Study II participants and staff for their important contributions.
Author Disclosure Statement
No competing financial interests exist.
Funding Information
This work was supported by the National Heart, Lung, and Blood Institute at the National Institutes of Health under the Ruth L. Kirschstein National Research Service Award (F31HL131222 to L.J.T.); National Heart, Lung, and Blood Institute (T32HL098048 to J.J.S. and L.J.T.); National Cancer Institute (UM1 CA176726, R01 CA67262); and the American Heart Association (12PRE9110014 to J.J.S. and 13GRNT17070022 to J.W.R.-E.).
Supplementary Material
Supplementary Figure S1
Supplementary Table S1
Supplementary Table S2
Supplementary Table S3
References
Supplementary Material
Please find the following supplemental material available below.
For Open Access articles published under a Creative Commons License, all supplemental material carries the same license as the article it is associated with.
For non-Open Access articles published, all supplemental material carries a non-exclusive license, and permission requests for re-use of supplemental material or any part of supplemental material shall be sent directly to the copyright owner as specified in the copyright notice associated with the article.
