




Abstract
Background:
Excessive gestational weight gain (GWG) is consistently linked with maternal risk of obesity. However, the literature on its long-term cardiovascular risk is minimal and conflicting. We evaluated whether excessive GWG is associated with a high-risk cardiovascular profile among parous women in midlife.
Materials and Methods:
Participants were women in the multiethnic cohort Study of Women's Health Across the Nation with a history of live birth(s). Excessive GWG was defined according to Institute of Medicine guidelines and collected by self-recall. Outcomes were the atherosclerotic cardiovascular disease (ASCVD) risk score and C-reactive protein (CRP), measured at the study baseline when mean age was 47 years, and at 10 follow-up visits (1996–2017). We estimated the association of excessive GWG with outcomes through linear mixed model regression.
Results:
The analytic sample included 1318 women with 3049 singleton births. Over 40% (536) reported one or more pregnancies with excessive GWG. Longitudinal models estimated that at a mean age of 67, women with a history of excessive GWG had a 9.8% (9.2, 10.5) 10-year ASCVD risk, compared to 9.5% (8.9, 10.1) for those without, and mean CRP of 2.20 mg/L (1.89, 2.57) versus 1.85 mg/L (1.61, 2.14), respectively, adjusted for participant characteristics.
Conclusions:
In this multiethnic cohort of parous women, a history of excessive GWG was associated with a small, but statistically significant difference in ASCVD risk, and a moderate, statistically significant difference in CRP across midlife. More research is necessary to understand the mechanistic pathway between excessive GWG and long-term maternal cardiovascular health.
Introduction
Excessive gestational weight gain (GWG) is a potential prevention point for obesity. Among people who give birth, excessive GWG is common 1,2 and has consistently been linked with increased long-term weight. 3 –9 Prevention of excessive GWG could lead to population-level declines in obesity rates. 10 However, prior research has not consistently observed an association between excessive GWG and increased cardiovascular risk. 4,11,12 This could be due to difficulty in implementing studies with sufficient follow-up to observe reproductive characteristics and long-term cardiovascular outcomes.
Alternatively, excessive GWG may contribute to a low-risk phenotype of obesity. Research increasingly supports a view of obesity as a heterogeneous characteristic. 13,14 The cardiovascular risk conveyed by obesity appears to vary by metabolic function, 15 a relationship that is not well understood and may change over time. 16,17
The organizing question of this analysis is as follows: Does the increased risk of obesity associated with excessive GWG confer a clinically meaningful increase in cardiovascular risk later in life among parous people? To address this question, we consider characteristics that represent mechanisms of cardiovascular risk.
Specifically, we use the atherosclerotic cardiovascular disease (ASCVD) risk score and the inflammatory biomarker C-reactive protein (CRP) to describe participants' cardiovascular risk profile. The ASCVD score is a clinically relevant and interpretable representation of the most recent literature on the effect of traditional CVD risk factors. CRP is a biomarker of acute and chronic inflammation that has been shown to be predictive of cardiovascular disease. 18 We include inflammation, in addition to traditional cardiovascular risk factors, as it is considered a key part of the atherosclerotic process. 19,20
We use data from the multiethnic cohort Study of Women's Health Across the Nation (SWAN). The SWAN study has been an important source of data on midlife health and provides over 20 years of prospective, longitudinal follow-up. 21 We leverage these data to take a life course approach, as they include measures of both women's reproductive history and long-term cardiovascular health. We test the hypothesis that a history of excessive GWG, compared to no excessive GWG, is associated with greater ASCVD risk score and CRP among parous women in midlife, through a pathway including midlife obesity.
Materials and Methods
Participants
SWAN is an ongoing, prospective cohort study designed to observe health characteristics across the menopause transition. The SWAN cohort includes 3302 women from seven cities: Boston, MA, Chicago, IL, Detroit, MI, Los Angeles, CA, Oakland, CA, Newark, NJ, and Pittsburgh, PA. Enrollment began in 1996 with the following primary eligibility criteria: age 42–52 years, having at least one menstrual period in the previous 3 months, no exogenous hormone use in the previous 3 months, intact uterus, at least one ovary, and self-identification with a designated racial/ethnic group recruited by site.
All sites enrolled women who identified as non-Hispanic white as well as women from one additional race or ethnic group: non-Hispanic black, Hispanic, Japanese descent, or Chinese descent. Information on the sampling strategy for SWAN has been published previously. 21 Institutional review board approval was obtained with each site institution and written consent given by all participants. The SWAN study includes a baseline visit (conducted from 1996 to 1997) and 16 follow-up visits.
Figure 1 illustrates the eligibility and exclusions of the participant sample for this analysis. At the baseline visit, 2733 SWAN participants reported a history of live birth(s). All exclusions were at the participant level. No data from individual pregnancies were excluded. Women were excluded if they reported current hormone use (n = 6) or history of stillbirth or multifetal birth (n = 154) at baseline. Women with a history of underactive thyroid were also excluded (n = 195) due to known associations between hypothyroidism and pregnancy complications, 22,23 and because we did not know whether the reported thyroid condition was diagnosed before, during, or after pregnancies.
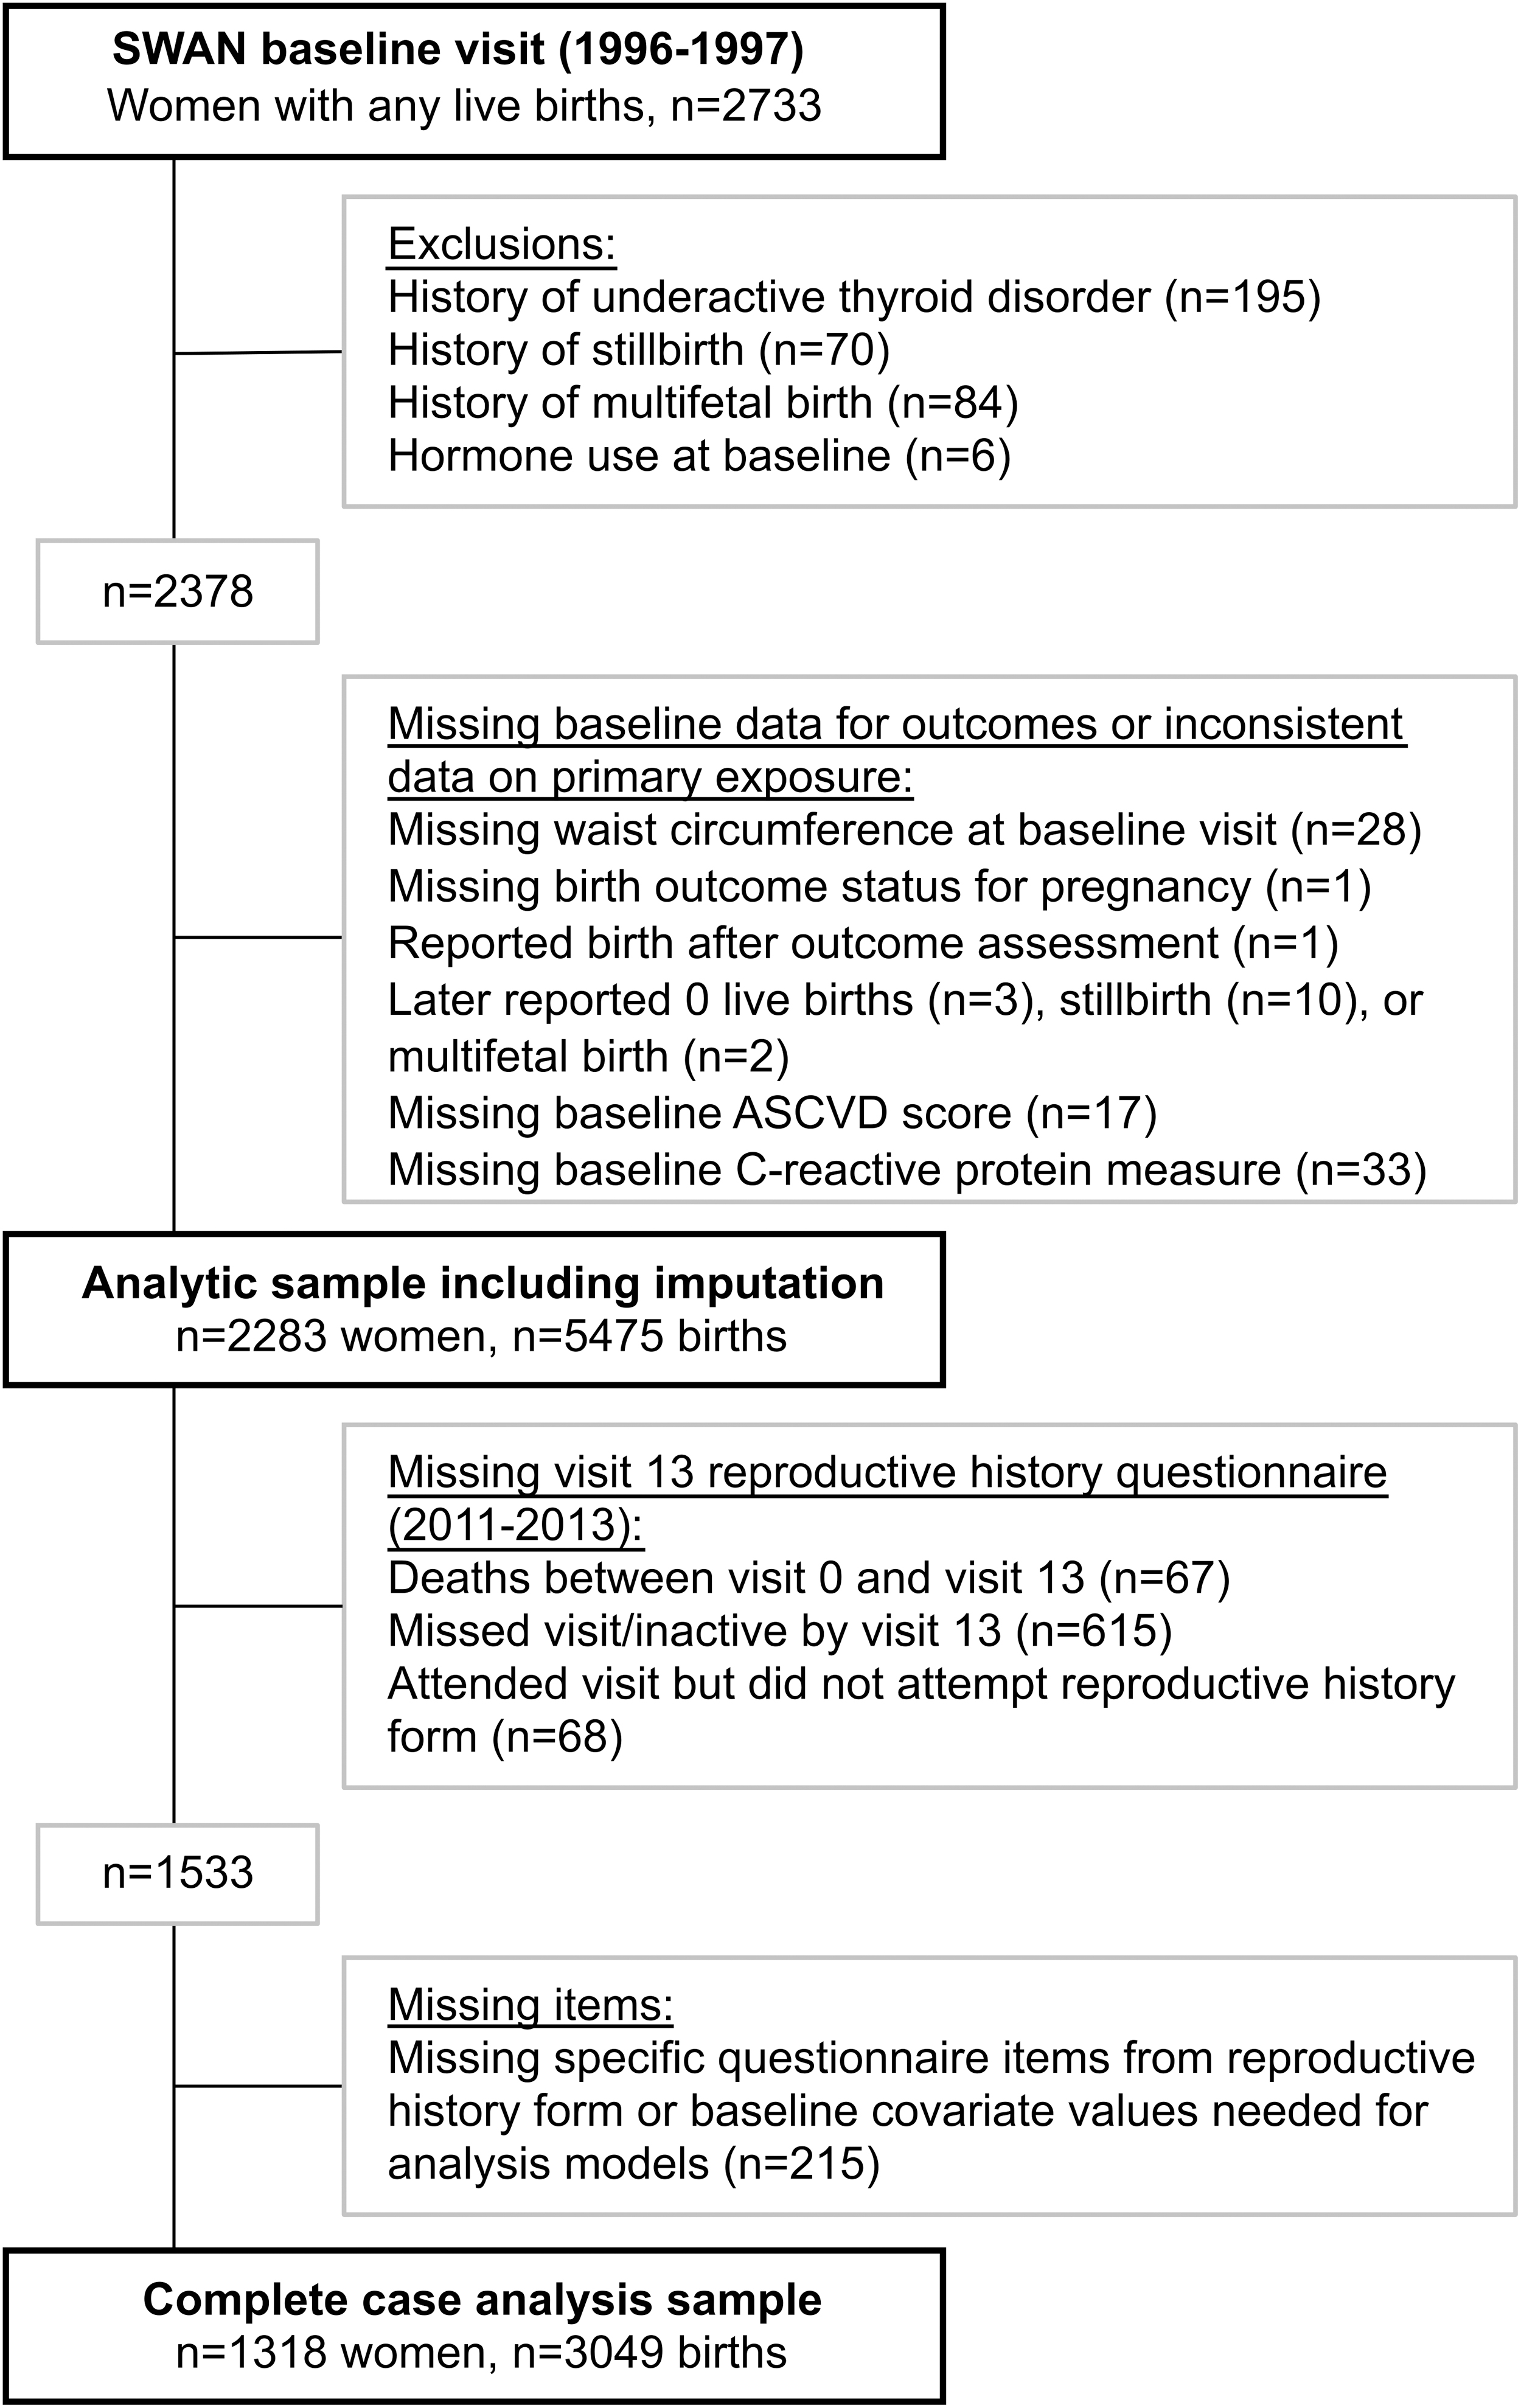
Participant flowchart. Figure details eligibility and exclusions for participants included in the complete case sample (primary analysis) and the sample used in pooled imputation results. ASCVD, atherosclerotic cardiovascular disease.
Women with missing waist circumference, ASCVD score, or CRP measure at baseline were also excluded (n = 78). An additional 17 women were excluded for reporting conflicting birth information during follow-up or reporting a birth after the baseline visit. The remaining 2283 women were considered eligible for the analysis.
A subset of these eligible women was retained through the 13th follow-up visit (conducted in 2011–2013), which included a comprehensive reproductive history questionnaire. Women who missed the reproductive history questionnaire (n = 750), questionnaire items, or covariate values measured at baseline (n = 215) were excluded from the complete case sample. The primary analytic sample was 1318 women with 3049 births who had complete data. In sensitivity analysis, we used data imputation to include the entire eligible sample of 2283 women with 5475 births.
Measures
Outcomes
The outcomes in this analysis are the ASCVD risk score and CRP. Each was collected at baseline and 10 follow-up visits for a total of 11 visit time points representing 20 years of prospective follow-up.
The ASCVD risk score predicts the 10-year risk of developing a first atherosclerotic cardiovascular event. 24 See the Supplemental Materials for details of score components and measurement. The ASCVD score is available for SWAN baseline and follow-up visits 1, 3–7, 9, 12, 13, and 15. It was set to missing if any component value was missing.
CRP was analyzed in plasma collected from fasting blood samples at baseline and follow-up visits 1, 3–7, 9, 10, 12, and 15. A calibration equation was developed by the SWAN Coordinating Center and applied to convert all assay results to be longitudinally comparable to results obtained by Human High Sensitivity CRP ELISA (DCRP00; R&D Systems). See the Supplemental Materials for details on laboratory locations, methods, and calibration.
Primary exposure
The primary exposure was a history of excessive GWG. In the SWAN cohort, this measure relies on retrospective self-report collected after the births occurred and after the study baseline visit. To address potential statistical bias that could be introduced due to self-recall or missing data, we previously conducted a quantitative bias analysis using these data. 25 This multiple-bias analysis involved misclassification weighting and data imputation. We found that estimates of association between a history of excessive GWG and midlife obesity risk were robust to error in the GWG measure.
GWG adequacy was measured as follows: total pregnancy weight gain for each birth was collected by retrospective self-report at visit 13, when women's age ranged from 56 to 68 years. Prepregnancy body mass index (BMI) was calculated using retrospective prepregnancy weight collected at visit 13 and height measured in-clinic at the baseline visit. Each pregnancy was categorized as having inadequate, adequate, or excessive GWG per the Institute of Medicine's (IOM) 2009 guidelines. 26 These guidelines provide a range of GWG amount considered clinically “adequate” depending on maternal prepregnancy BMI (see Supplementary Table S1).
Pregnancies reported as term births were categorized according to total gain, and those reported as preterm were categorized by rate of gain per IOM guidelines. Women who reported, for any pregnancy, GWG above the adequacy range for their prepregnancy BMI and the gestational age at birth were categorized as having a history of excessive GWG.
Covariates
Covariates collected at the SWAN baseline visit when women ranged in age from 42 to 53 years were baseline age, race/ethnicity, study site, education (high school or less, some college/college degree, or postcollege study), daily calorie intake (calculated from responses to a modified Block interviewer-assisted food frequency questionnaire), age first pregnant (years), time since the last birth (years), and smoking status (ever or never smoker). Abdominal obesity at the baseline visit was considered a potential mediator in this analysis and was based on waist circumference measured in clinic, defined as >80 cm for women of Japanese and Chinese descent and ≥88 for black, Hispanic, and white women.
Additional characteristics self-reported with the reproductive history questionnaire at the follow-up 13 visit were pregnancy duration (weeks) and pregnancy complications. Separate dichotomous variables were coded for each of the following: ever-had preterm birth, ever-had hypertensive disorder of pregnancy, and ever-had gestational diabetes. Preterm birth was defined as present if any birth was reported with a gestational age <37 weeks.
Participants were considered to have a history of hypertensive disorder of pregnancy if, for any birth, they answered yes to experiencing “Preeclampsia/toxemia (high blood pressure + protein in the urine) or eclampsia,” or “Gestational hypertension or pregnancy-induced hypertension.” Similarly, participants were considered to have a history of gestational diabetes if, for any birth, they answered yes to having gestational diabetes with no diabetes prepregnancy. Parity was calculated by summing the number of births reported.
Time-varying covariates were age (years), menopause status, current hormone use, difficulty paying for basics (somewhat hard/very hard or not very hard), stress score, physical activity score, and current statin use (yes/no). Menopause status was defined in SWAN as follows: premenopausal (no change in bleeding patterns), early perimenopause (bleeding in the last 3 months, but with change in bleeding pattern), late perimenopause (bleeding in the last 12 months, but no bleeding in the past 3 months), natural postmenopause (no bleeding in 12 months not due to hysterectomy), surgical menopause (bilateral oophorectomy with or without hysterectomy), hysterectomy with one or two ovaries retained, and hormone use before final menstrual period. Stress was measured using the four-item Perceived Stress Scale questionnaire. 27
The range is 4 (low stress) to 20 (high stress) and is calculated as the sum of the four-component questions regarding frequency of feeling overwhelmed during the past 2 weeks, defined as 1 = Never to 5 = Very Often. The physical activity score range is 1–15 and is derived from an adaptation of the Kaiser Permanente Health Plan Activity Survey (used previously in SWAN). 28 Some visits did not collect information on difficulty paying for basics or physical activity. Values in those visits were carried forward from the prior visit. These characteristics have been observed to be generally stable in this population. 29,30
Statistical analysis
Descriptive
Participant characteristics at baseline are presented overall and stratified by excessive GWG history. Categorical variables are shown as number with percent, and continuous variables by mean with standard deviation (SD) if normally distributed or median with first and third quartile values if skewed.
Analytic models
Analytic models were developed with the guidance of a directed acyclic graph (Supplementary Fig. S1). ASCVD score and CRP level were transformed by natural logarithm due to skewed distributions. We estimated level and change over time of ASCVD score and CRP in separate longitudinal mixed-effect regression models. Regression coefficients and 95% confidence intervals are shown as percent change using the transformation 100(eβ−1).
Outcomes were modeled as a function of excessive GWG history, participant age at the baseline visit, years since the baseline visit, and an interaction term for excessive GWG by years since baseline. The intercept and years since baseline were set as random effects. Estimates for the primary exposure (i.e., excessive GWG) represent percent change in outcome level at baseline for those with a history of excessive GWG compared to those without. These estimates should be interpreted in conjunction with estimates for years of follow-up (i.e., percent change in outcome per year since baseline), and the interaction term between excessive GWG and years of follow-up.
In addition to the minimal model, we present estimates adjusted for participant characteristics considered confounders. These characteristics were single measures of race/ethnicity, site, education level, caloric intake, smoking history, BMI before first pregnancy, age first pregnant, years between last birth and baseline visit, parity, history of inadequate GWG, and time-varying measures of menopause status, hormone use, difficulty paying for basics, stress score, and physical activity. Time-varying statin use is included as a confounder in CRP models.
Although some of these characteristics—such as menopausal status, caloric intake, and physical activity in midlife—occur after the exposure, we include them as potential mediator-outcome confounders (see Supplementary Fig. S1). We include inadequate GWG to account for the association between inadequate gain and lower maternal weight.
We present a third set of estimates from models adjusted for participant characteristics as well as pregnancy-related confounders gathered for each birth: pregnancy complications and preterm birth. Finally, to evaluate whether obesity plays a mediating role in this pathway, we present estimates from model, including confounders and abdominal obesity at the SWAN baseline visit.
For interpretation, we estimated least squares means of each outcome by excessive GWG status, back-transformed to the original scale. To accommodate possible change in slope over time, least squares means were estimated with follow-up length set to three separate time points: 0, 10, and 20 years after SWAN baseline.
Sensitivity analysis with imputation
To evaluate the susceptibility of our estimates to bias due to missing data, we conducted a sensitivity analysis using imputed data to represent the entire eligible sample. Missing reproductive history and covariate values were imputed using multiple imputation by chained equations with classification and regression trees as the internal prediction algorithm 31 using an approach described with these data previously. 25 We created 10 imputed datasets and pooled estimates of the confounder-adjusted effect of excessive GWG on each outcome.
Software
Imputation models were run using the R mice package 32 in R version 3.6.1. 33 All other analyses were run in SAS v. 9.4 (SAS Institute, Cary, NC, USA).
Results
Descriptive
Of the 2283 eligible participants, 965 were excluded for missing reproductive history data or covariates. Individuals with missing data were systematically different from complete cases in a number of ways, including race/ethnicity and educational attainment (see Supplementary Table S2). Those with missing data also had higher median ASCVD scores (1.08% vs. 0.85% 10-year risk) and higher median CRP (2.36 mg/L vs. 1.48 mg/L) at baseline compared to women in the complete case sample.
Table 1 shows participant characteristics at baseline overall and stratified by excessive GWG history. Among the 1318 participants in complete case analysis, mean (SD) age at baseline was 46.6 (2.6) years. Participants reported an average of 2.3 (1.1) births. The mean age at first pregnancy was 24 (5.5) years and the mean time between the last birth and the SWAN baseline visit was 15 (6.8) years. Excessive GWG in at least one pregnancy was reported by 536 (40.1%). Individuals with a history of excessive GWG were less likely to be of Japanese or Chinese descent, more likely to be smokers, and more likely to report an overweight or obese BMI before their first pregnancy compared to those with no excessive GWG. Individuals with excessive GWG were more likely to have abdominal obesity at midlife than those with no excessive gain (49.6% vs. 27.7%).
Participant Characteristics at Study of Women's Health Across the National Baseline (Complete Cases)
ASCVD, atherosclerotic cardiovascular disease; BMI, body mass index; CRP, C-reactive protein; GWG, gestational weight gain; pctl, percentile; SD, standard deviation.
Mean prospective follow-up time was 17.4 (3.8) years and the mean age of participants when last observed was 64 years. Supplementary Figures S2 and S3 show observed median ASCVD score and CRP by excessive GWG status across SWAN follow-up.
Analysis models
Mean ASCVD risk score increased by an estimated 12% per year (Table 2). Having a history of excessive GWG was associated with a 29.6% (95% confidence interval = 18.2–42.1) higher ASCVD risk score at the SWAN baseline visit compared to no history. This association was attenuated with adjustment for confounders. In the model including confounders and midlife abdominal obesity, excessive GWG remained associated with a 9.1% (0.7 and 18.2) higher ASCVD score. There was evidence that the impact of excessive GWG on ASCVD risk score lessened slightly over time with a statistically significant interaction between the exposure and time of −0.6% change per year consistent across models. This represents a 0.6% decrease in the relative difference between those without and with excessive GWG per year of follow-up.
Linear Mixed Model Estimates (95% Confidence Intervals) of Percent Change in Atherosclerotic Cardiovascular Disease Score (n = 1318)
Outcomes measured at SWAN baseline and at 10 follow-up visits. Mean age at the last observed outcome measure was 64 years. Model 1 is adjusted for variables shown. Model 2 is adjusted for variables shown as well as race/ethnicity, site, education, baseline caloric intake, history of smoking at baseline, parity, BMI category before the first pregnancy, age first pregnant, years between last birth and baseline, history of inadequate gestational weight gain, and the following time-varying characteristics: physical activity score, stress score, difficulty paying for basics, menopause status, and hormone use. Model 3 is adjusted as model 2 with the addition of history of gestational hypertensive disorders, history of gestational diabetes, and history of preterm birth. Model 4 is adjusted as model 3 with the addition of midlife abdominal obesity status.
NA, not applicable.
Figure 2 shows least squares means of ASCVD risk score by excessive GWG status adjusted for participant characteristics and back-transformed to the original scale to compare absolute difference. Confounder adjustment is as described for Model 2 in Table 2. With the follow-up time set to the SWAN baseline visit, the mean ASCVD risk score for those with no excessive GWG was 1.0 (0.9, 1.1)—meaning a 1% predicted risk of experiencing a cardiovascular event in the following 10 years—compared to 1.1 (1.1, 1.2) for those with a history of excessive gain. When follow-up time was set to 20 years after the baseline visit, the estimated mean ASCVD risk score, adjusted for participant characteristics, rose to 9.5 (8.9, 10.1) and 9.8 (9.2, 10.5), respectively.

Confounder-adjusted Least Squares Mean ASCVD Risk Score (%), n = 1318. Figure shows least squares means with 95% confidence intervals of percent 10-year atherosclerotic CVD risk for those without (light gray) and with (dark gray) a history of excessive GWG. Each set of least square means is estimated on the log scale in separate linear mixed models with follow-up time set to years of SWAN follow-up shown in the x-axis. Log-scale means are back-transformed to the original scale and presented as percentage. The estimation model was adjusted for baseline age, years of follow-up from baseline visit, an interaction term for excessive GWG by years follow-up, parity (per birth), race/ethnicity, site, education, baseline calorie intake, history of smoking at baseline, BMI category before the first pregnancy, age first pregnant, years between last birth and baseline, history of inadequate GWG, and the following time-varying characteristics: physical activity score, stress score, difficulty paying for basics, menopause status, and hormone use. BMI, body mass index; GWG, gestational weight gain; SWAN, Study of Women's Health Across the Nation.
There was little evidence that mean CRP changed substantively over time, with an estimated 0.4% (−0.1, 0.8) change per year of follow-up. Excessive GWG was associated with an 89.2% (63.2, 119.4) higher baseline CRP level compared to no history in the minimal model (Table 3). The addition of confounders attenuated the association. In the model that included abdominal obesity, excessive GWG remained associated with a 31.5% (15.0, 50.3) higher mean CRP. The impact of excessive GWG on CRP level decreased over time at an estimated rate of −1.2% (−1.9, −0.5) per year of follow-up, adjusted for confounders.
Linear Mixed-Model Estimates of Percent Change in C-Reactive Protein (n = 1318)
Outcomes measured at SWAN baseline and at 10 follow-up visits. Mean age at the last observed outcome measure was 64 years. Model 1 is adjusted for variables shown. Model 2 is adjusted for variables shown as well as race/ethnicity, site, education, baseline caloric intake, history of smoking at baseline, parity, BMI category before the first pregnancy, age first pregnant, years between last birth and baseline, history of inadequate gestational weight gain, and the following time-varying characteristics: statin use, physical activity score, stress score, difficulty paying for basics, menopause status, and hormone use. Model 3 is adjusted as model 2 with the addition of history of gestational hypertensive disorders, history of gestational diabetes, and history of preterm birth. Model 4 is adjusted as model 3 with the addition of midlife abdominal obesity status.
NA, not applicable.
Figure 3 presents least squares mean CRP by excessive GWG status back-transformed to the original scale (milligram per liter), adjusted for participant characteristics. Confounder adjustment is as described for Model 2 in Table 3. The estimated mean CRP level for those with no excessive GWG at 0 years follow-up was 1.64 mg/L (1.44, 1.88), compared to 2.46 mg/L (2.13, 2.85) for those with excessive GWG. At the 20-year follow-up, the confounder-adjusted means were 1.85 (1.61, 2.14) and 2.20 (1.89, 2.57) for never- and ever-had excessive GWG, respectively.
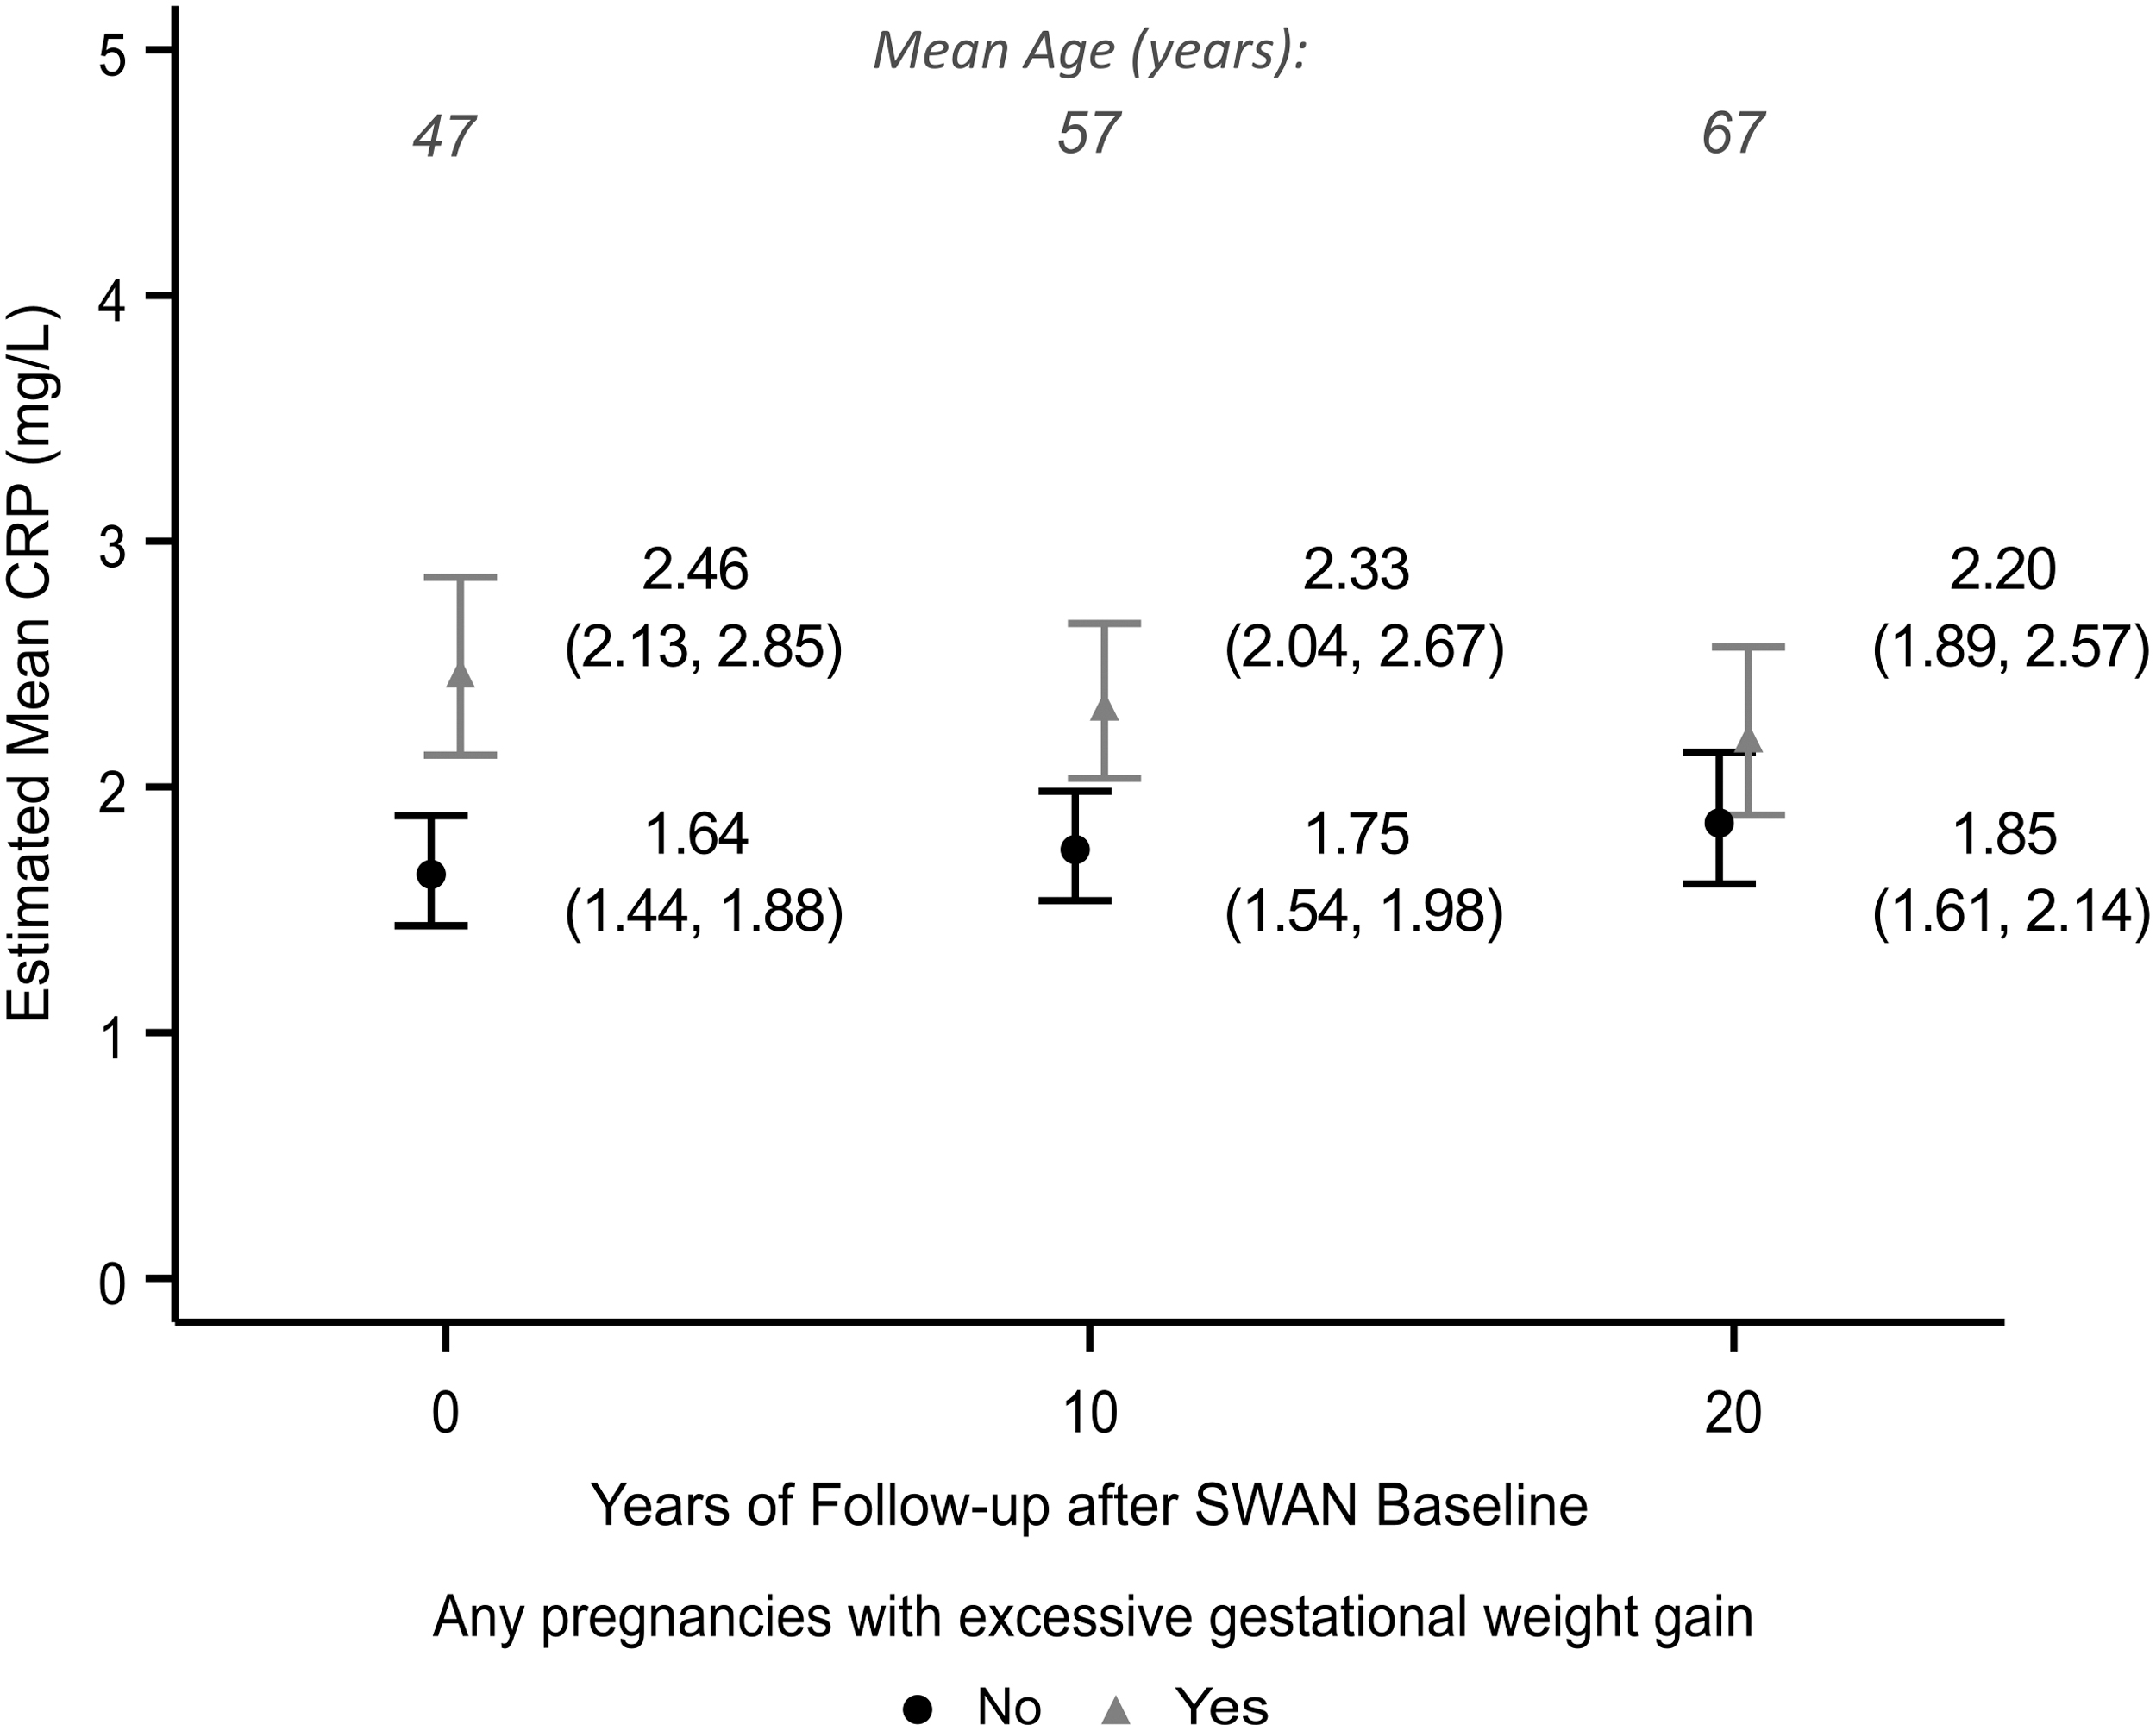
Confounder-adjusted Least Squares Mean CRP (mg/L), n = 1318. Figure shows least squares means with 95% confidence intervals of CRP level for those without (black circle) and with (gray triangle) a history of excessive GWG. Each set of least squares means is estimated on the log scale in separate linear mixed models with follow-up time set to years of SWAN follow-up shown in the x-axis. Log-scale means are back-transformed to the original scale (mg/L). The estimation model was adjusted for baseline age, years of follow-up from baseline visit, an interaction term for excessive GWG by years follow-up, parity (per birth), race/ethnicity, site, education, baseline caloric intake, history of smoking at baseline, BMI category before the first pregnancy, age first pregnant, years between last birth and baseline, history of inadequate GWG, and the following time-varying characteristics: statin use, physical activity score, stress score, difficulty paying for basics, menopause status, and hormone use. CRP, C-reactive protein.
Sensitivity analysis
In imputed data models, a history of excessive GWG was associated with a 12.7% (2.2 and 24.4) higher baseline ASCVD score and a 33.9% (18.3 and 51.7) higher baseline CRP value, compared to no history, adjusted for participant characteristics. Supplementary Table S3 shows longitudinal pooled estimates from confounder-adjusted models using imputed data.
Discussion
In this multiethnic cohort of parous women, a history of excessive GWG was associated with a small, but statistically significant higher ASCVD score, and a moderate, statistically significant higher mean CRP across midlife. At 20 years of midlife follow-up, women who reported one or more pregnancies with excessive GWG were estimated to have a marginal mean ASCVD risk score of 9.8% (9.2, 10.5) versus 9.5% (8.9 and 10.1) among those without excessive GWG, and mean CRP of 2.20 mg/L (1.89 and 2.57) versus 1.85 mg/L (1.61 and 2.14) independent of demographic, behavioral, and reproductive confounders.
The small magnitude of absolute difference in ASCVD score calls into question whether we observed a clinically meaningful risk difference. The estimated effect may be artifactual due to residual confounding, or may represent a weak association. However, the exposure represented by this small risk difference may have a cumulative effect over time. Further research is necessary to evaluate whether excessive GWG contributes to substantive change in traditional risk factors.
In contrast, the difference in mean CRP between those with and without excessive GWG that we observed at 20 years of study follow-up—2.20 mg/L versus 1.85 mg/L—represented nearly 20% absolute difference. In this population, estimated mean CRP for those with excessive GWG consistently exceeded the 2.0 mg/L threshold for inflammation as a cardiovascular risk-enhancing factor. 34
Because obesity—in particular abdominal obesity 35,36 —is associated with cardiovascular risk factors, 37 we hypothesized that excessive GWG would be associated with increased long-term maternal cardiovascular risk, mediated by abdominal obesity in midlife. However, we did not find clear evidence that excessive GWG was associated with a clinically meaningful increase in ASCVD risk score, despite differences in the prevalence of abdominal obesity by exposure status in this population.
Furthermore, the addition of abdominal obesity status to models reduced, but did not fully account for the associations between excessive GWG and either outcome. Because the mechanistic pathways currently supported in the literature are through obesity 38 –40 or pregnancy complications, 41,42 we reason that the remaining association with ASCVD score represents residual confounding or upstream factors. Excessive GWG is associated with higher rates of gestational hypertension 41,43 and gestational diabetes. 41 These characteristics may be causally linked, due to underlying subclinical factors, or represent pre-existing risk. 34,44 –46 This pathway is obscured further by glaring racial disparities in prenatal and maternal health in the United States. 47 –49 Some of the associations we observed may include confounding by health disparities not captured by our measures.
Some direct effect of excessive GWG on inflammation is biologically plausible. Inflammatory regulation and change are part of pregnancy 50 –52 and there is some evidence that pregnancy factors are associated with postpartum inflammation. 46 Whether this represents cytokine imbalance from regulatory functions of pregnancy or a consequence of excess adiposity has not been studied.
We previously described the association between multiple pregnancies with excessive GWG and increased midlife BMI in this cohort. 9 The dichotomous variable of “ever-had” excessive GWG used in this analysis does reflect gain across reproductive history. However, it does not capture the cumulative nature of multiple pregnancies with excessive GWG. It is important to consider that healthy weight gain at any point in a person's reproductive history can benefit long-term maternal health.
Our research highlights the need for nuance when considering obesity as a measure of cardiovascular risk. The stigma attached to obesity heightens the need for careful consideration in interpreting related research. Obesity stigma is endemic socially 53,54 and in clinical practice. 55,56 This stigma has been associated with worse care and health outcomes. 55,57,58 In research, a more informative approach is to design studies to test specific pathways to disease, as opposed to treating obesity as a stand-in for overall poor health in conceptual models.
Our study has many strengths. Our analysis leveraged over 20 years of prospective follow-up beginning in midlife. This allowed us to estimate the level and change over time of the cardiovascular risk outcomes, and whether the impact of excessive GWG on each outcome changed over time. The definition of our main exposure, excessive GWG, is a valid, literature-based measure that represents the health effects of pregnancy weight change. 26 The measure also allowed us to account for inadequate gain. This is preferable to comparing low versus high gain, which conflates well-supported pregnancies with higher-risk inadequate gain pregnancies.
The SWAN data were also an asset in that they provide a rich source of information on participants. This allowed us to account for a wide variety of characteristics that are likely strong confounders, but often difficult to measure such as physical activity and diet. Finally, we had high-quality outcome measures collected in a clinical setting by trained staff.
The following limitations should be considered when interpreting these results. Our primary analytic sample excluded over 40% of eligible participants due to missing data. However, we were able to control for many characteristics related to participant attrition such as socioeconomic status, health behaviors, and stress. Sensitivity analyses that included multiply imputed data attenuated estimates, but did not impact overall interpretation compared to results from the complete case sample. A second limitation to this research is the use of self-recalled measures of reproductive history. We previously demonstrated that estimates of association between excessive GWG and midlife obesity status in this cohort were robust to bias due to both missing data and self-recall. 25
Conclusion
We addressed the question of whether excessive GWG confers a clinically meaningful difference in long-term cardiovascular risk among parous people. In our analysis, a history of excessive GWG was associated with a small difference in maternal ASCVD risk score and moderate difference in CRP level over 20 years of prospective midlife follow-up, independent of demographic characteristics and health behaviors. This adds evidence to the importance of clinical focus on healthy weight gain during pregnancy to promote long-term maternal health. Further research is necessary to understand the mechanistic pathway between pregnancy weight characteristics and maternal cardiovascular risk.
Footnotes
Acknowledgments
SWAN Study acknowledgments
Clinical Centers: University of Michigan, Ann Arbor – Siobán Harlow, PI 2011–present and MaryFran Sowers, PI 1994–2011; Massachusetts General Hospital, Boston, MA—Joel Finkelstein, PI 1999–present and Robert Neer, PI 1994–1999; Rush University, Rush University Medical Center, Chicago, IL—Howard Kravitz, PI 2009–present and Lynda Powell, PI 1994–2009; University of California, Davis/Kaiser—Ellen Gold, PI; University of California, Los Angeles—Gail Greendale, PI; Albert Einstein College of Medicine, Bronx, NY—Carol Derby, PI 2011–present, Rachel Wildman, PI 2010–2011, and Nanette Santoro, PI 2004–2010; University of Medicine and Dentistry, New Jersey Medical School, Newark—Gerson Weiss, PI 1994–2004; and the University of Pittsburgh, Pittsburgh, PA—Karen Matthews, PI.
NIH Program Office: National Institute on Aging, Bethesda, MD—Chhanda Dutta 2016–present; Winifred Rossi 2012–2016; Sherry Sherman 1994–2012; Marcia Ory 1994–2001; and National Institute of Nursing Research, Bethesda, MD—Program Officers.
Central Laboratory: University of Michigan, Ann Arbor—Daniel McConnell (Central Ligand Assay Satellite Services).
Coordinating Center: University of Pittsburgh, Pittsburgh, PA—Maria Mori Brooks, PI 2012–present and Kim Sutton-Tyrrell, PI 2001–2012; New England Research Institutes, Watertown, MA—Sonja McKinlay, PI 1995–2001.
Steering Committee: Susan Johnson, Current Chair
Chris Gallagher, Former Chair
We thank the study staff at each site and all the women who participated in SWAN.
Authors' Contributions
F.H.: substantial contributions to the conception or design of the work, analysis and interpretation of data for the work, and drafting the work.
S.R.E.K., R.K., and M.M.B.: substantial contributions to the conception or design of the work, interpretation of data for the work, and revising the work critically for important intellectual content.
J.C., A.C., and E.B.-M.: substantial contributions to the conception or design of the work and revising the work critically for important intellectual content.
In addition, all authors will contribute final approval of the version to be published and agree to be accountable for all aspects of the work in ensuring that questions related to the accuracy or integrity of any part of the work are appropriately investigated and resolved.
Author Disclosure Statement
No competing financial interests exist.
Funding Information
The Study of Women's Health Across the Nation (SWAN) has grant support from the National Institutes of Health (NIH), DHHS, through the National Institute on Aging (NIA), the National Institute of Nursing Research (NINR), and the NIH Office of Research on Women's Health (ORWH) (Grant Nos. U01NR004061, U01AG012505, U01AG012535, U01AG012531, U01AG012539, U01AG012546, U01AG012553, U01AG012554, and U01AG012495). The content of this article is solely the responsibility of the authors and does not necessarily represent the official views of the NIA, NINR, ORWH, or NIH.
Supplementary Material
Supplementary Material
Supplementary Figure S1
Supplementary Figure S2
Supplementary Figure S3
Supplementary Table S1
Supplementary Table S2
Supplementary Table S3
References
Supplementary Material
Please find the following supplemental material available below.
For Open Access articles published under a Creative Commons License, all supplemental material carries the same license as the article it is associated with.
For non-Open Access articles published, all supplemental material carries a non-exclusive license, and permission requests for re-use of supplemental material or any part of supplemental material shall be sent directly to the copyright owner as specified in the copyright notice associated with the article.
