




Abstract
Background:
Positive affect and emotional resources, such as optimism, may play a major role in women's health and promote healthy well-being later in life. However, positive affect and optimism measures have not been psychometrically assessed in older women, despite relations to health. Therefore, the objective of this study was to psychometrically assess measures of positive affect and optimism and test their association with other measures of well-being.
Methods:
In a Women's Health Initiative subcohort of 58,810 women (mean age [standard deviation] 79.0 [6.1]; 89% White), positive affect and optimism were measured using the modified Differential Emotions Scale (mDES) and Life Orientation Test-Revised (LOT-R), respectively. Reliability was tested using Cronbach's alpha and McDonald's omega. Performance was assessed using item response theory. Factor analysis was used to explore the construct validity of the LOT-R. Convergent and divergent validity with other well-being measures was tested.
Results:
Results suggest good reliability (mDES: Cronbach's alpha = 0.90 and omega total = 0.92; LOT-R: Cronbach's alpha = 0.79, omega hierarchical = 0.61, and omega total = 0.83). Item response analyses indicate mDES's ability to discriminate across positive affect; LOT-R was skewed toward lower optimism levels. Exploratory factor analyses suggest a two-factor solution for the LOT-R. Significant, but small correlations in expected directions to well-being measures confirmed validity hypotheses.
Conclusions:
The mDES and LOT-R measured positive affect and optimism with good reliability, item performance, and validity in a large sample of older postmenopausal women, supporting use of these measures to quantify effects of positive affect and optimism-promoting interventions.
Introduction
Women have experienced remarkable increases in life expectancy during the past century and are projected to live longer than men. 1 This is attributed to differences in behavioral and physiologic characteristics. 2,3 Positive affect and emotional resources, such as optimism, may play a major role in women's health and promote healthy well-being at late life. 4 However, several measures of positive affect and optimism have yet to be psychometrically assessed in a large population of older women.
Positive affect, the experience or state of positive emotion, 5 and optimism, attitudes toward the expectation of positive future events, 6 can positively influence health. Optimism may increase coping strategies such as seeking social support and embracing positive aspects of stressful life events. 7,8 Positive affect and optimism are important constructs, given their association with multiple health outcomes. For example, increased positive affect is associated with lower chronic pain 9 and lower morbidity. 10 Higher optimism is associated with fewer comorbidities, lower memory impairment, sustained physical function, and longer survival. 11,12 In older women, higher optimism is associated with lower mortality and incident coronary heart disease, 13 and nonsmoking behaviors, 14 as well as higher physical activity, 15 and better diet quality. 16 Conversely, higher pessimism is associated with greater mammogram frequency. 17 Therefore, it is important to assess how well positive affect and optimism scales such as the modified Differential Emotions Scale (mDES) and six-item Life Orientation Test-Revised (LOT-R), measure these constructs to support their use in future studies.
The mDES and LOT-R were originally developed in study populations of younger age. 6,18,19 Evidence for the psychometric performance of both scales were formed in male and female populations, spanning a wide age range, which may not account for the unique characteristics of women at late life. Because positive affect and optimism may be impactful targets for health-promoting interventions, 20 adequate reliability, validity, and sensitivity in the measurement of positive affect and optimism are essential for quantifying the effects of interventions. Therefore, the objective of this study was to psychometrically assess measures of positive affect and optimism as well as test their association with other measures of health and well-being in a large cohort of older postmenopausal women. We hypothesized that the mDES and LOT-R measured positive affect and optimism with good reliability, item performance, and validity in older women.
Methods
Study population
The Women's Health Initiative (WHI) enrolled 161,809 postmenopausal women from across the United States into a clinical trial or observational study. Details of the WHI study design, recruitment, and data collection methods are published elsewhere. 21 –23 Briefly, women 50–79 years of age were recruited for the WHI study between 1993 and 1998 from 40 clinical centers in the United States. Women were eligible for enrollment if they were postmenopausal, unlikely to relocate or die within 3 years, and not enrolled in another clinical trial. The WHI project was reviewed and approved by the Fred Hutchinson Cancer Research Center Institutional Review Board. Participants provided written informed consent.
During the WHI 2014–2015 follow-up, lifestyle questionnaires including measurement of positive affect (mDES), were administered to 81,487 women between 2014 and 2015. In addition, 70,753 women were given a supplemental questionnaire, which included measurement of optimism (LOT-R). Of the 70,753 with lifestyle and supplemental questionnaire data, we excluded women with incomplete mDES data (n = 5,314), LOT-R data (n = 3,743), and data for both scales (n = 2,886). This yielded an analytic sample of 58,810 women for this study.
Measures
Modified Differential Emotions Scale
Nine items of the mDES assessed positive affect. 18 Participants rated the intensity of nine emotions in the past 24 hours: (1) Amusement; (2) Awe; (3) Gratitude; (4) Hope; (5) Interest; (6) Joy; (7) Love; (8) Pride; and (9) Serenity. Responses to each item were rated on a five-point Likert scale: (1) Not at all; (2) A little bit; (3) Somewhat; (4) Quite a bit; and (5) Very much. Ratings for all items were summed to generate a summary score, ranging from 9 to 45, with higher scores indicating greater positive affect. Negative affect items of the mDES were not assessed in the WHI.
Six-item LOT-R
The six-item LOT-R assessed optimism, and was developed to measure optimism, the belief in positive future events. 6,19 Participants responded to six items about perceptions of one's self: (1) “In unclear times, I usually expect the best.”; (2) “If something can go wrong for me, it will.”; (3) “I'm always hopeful about my future.”; (4) “I hardly ever expect things to go my way.”; (5) “I rarely count on good things happening to me.”; and (6) “Overall, I expect more good things to happen to me than bad.” Responses to each item were rated on a five-point Likert scale: (1) Strongly Disagree; (2) Disagree; (3) Neutral (In-between); (4) Agree; and (5) Strongly Agree.
Items 2, 4, and 5 were reverse coded and ratings for all items were summed to generate a summary score, ranging from 6 to 30, with higher scores indicating greater optimism. The LOT-R optimism subscale is the sum of items 1, 3, and 6, with higher scores indicating greater optimism. The LOT-R pessimism subscale is the sum of items 2, 4, and 5, with higher scores indicating greater pessimism.
Convergent and divergent validity testing
The following summary measures related to well-being were used to test for convergent validity of the mDES, LOT-R, and the LOT-R optimism subscale: Quality-of-life subscale: emotional well-being derived from 8 items from the RAND 36-Item Short Form Health Survey (QLS-EWB; range = 0–100, where higher scores indicate greater emotional well-being), 24 and 5-item satisfaction with life scale (SWLS; sum of 7-point Likert responses ranging from “strongly disagree” to “strongly agree,” where higher scores indicate higher level of satisfaction with life; range = 5–35). 25
We expected the following scales to have divergent validity with the mDES, LOT-R, and the LOT-R optimism subscale: the Burnam algorithm, which includes six items from the Center for Epidemiological Studies Depression Scale and two items from the Diagnostic Interview Schedule (range = 0–1, where higher scores suggest significant depressive symptom severity), 26 and four-item perceived stress scale construct (PSSC; sum of five-point Likert responses ranging from “never” to “very often,” where higher scores indicate greater perceived stress; range = 0–16). 27 We expected the LOT-R pessimism subscale to have convergent validity with the Burnam algorithm and PSSC, and divergent validity with the QLS-EWB and SWLS. In this sample, Cronbach's alpha was 0.80 for QLS-EWB, 0.89 for SWLS, and 0.58 for PSSC.
All scales demonstrated good internal consistency in other samples as well. For example, among 436 postmenopausal women, the Burnam algorithm had 74% sensitivity and 87% specificity for detecting depression and dysthymia. 28 Prior literature suggests good internal consistency for the QLS-EWB in three older, aged British study cohorts (Cronbach's alpha range = 0.76–0.82), 29 the PSSC in a European sample of 37,451 (Cronbach's alpha = 0.74), 30 and the SWLS among 176 college-aged students (Cronbach's alpha = 0.87) 25 and among 13,220 Mexican older adults (Cronbach's alpha = 0.74). 31
Statistical analysis
Descriptive statistics
To describe our population upon survey completion in 2014–2015, continuous participant characteristics were summarized using means and standard deviations (SD). Categorical variables were described using counts and percentages.
Item response theory and measures of internal consistency
To evaluate scale performance using item response theory, we fit nonparametric item response theory models and plotted option characteristic curves (OCCs) for the mDES and LOT-R using kernel smoothing techniques to show the probability of selecting a Likert-scale response option for an item as a function of the estimated level of the latent trait (i.e., positive affect for the mDES, and optimism for the LOT-R). Parametric graded response models (GRMs) were fit separately for each scale to assess item information by levels of the latent trait. Internal consistency was tested using Cronbach's alpha 32 and McDonald's omega total. 33 Assuming a bidimensional structure of the LOT-R, 34,35 we calculated Cronbach's alpha for the optimism and pessimism subscales, and omega hierarchical to account for overall reliability, as well as the potential subscales.
Exploratory factor analysis of the LOT-R
The factor structure of the LOT-R was assessed using factor analysis. We did not assess the mDES because negative affect items were not included in the WHI. This was included as an exploratory analysis given prior evidence of the LOT-R's bidimensional qualities. 34,35 Construct validity was assessed using a split-sample approach by defining the underlying factor structure and then validating the structure using a separate sample. 36 Using a random selection of half of our sample (n = 29,405), exploratory factor analysis (EFA) was used to examine the structure of the latent constructs using principal axis factoring. Factor loadings and communalities of >0.30 were required. Promax rotations were applied to improve interpretability and allow between-factor correlation. Using a correlation matrix, parallel analysis and scree plots were used to visualize eigenvalues and determine the optimal number of factors. To confirm EFA findings, confirmatory factor analysis (CFA) was applied to the remaining sample (n = 29,405). Model fit was assessed using comparative fit index (CFI), 37 root mean square error of approximation (RMSEA), Tucker-Lewis index (TLI), 38 and Bayesian information criterion (BIC). Values of <0.06 for the RMSEA and >0.95 for the CFI and TLI suggest good model fit. 39
Differential item functioning
Because there may be low measurement equivalence by education group, 40 differential item functioning (DIF) analysis was performed to determine whether items in the mDES and LOT-R had different psychometric properties across education subgroups. We used differential test functioning (DTF) analyses to quantify the effects of education with signed DTF (sDTF) and unsigned DTF (uDTF). 41 sDTF quantified the average scoring bias between education group response curves with possible values ranging from −45 to 45 for mDES and −30 to 30 for LOT-R (i.e., the highest possible scores). uDTF quantified the area between tests curves among education groups. Higher sDTF and uDTF suggest substantial DTF. We repeated DIF analyses for the LOT-R optimism and pessimism subscales.
Convergent and divergent validity
Validity of the mDES and LOT-R was assessed using Spearman's rank correlation coefficient. We hypothesized that the mDES, LOT-R, and LOT-R optimism subscale would be positively correlated with measures of similar latent constructs, which included the QLS-EWB and SWLS. We expected a negative correlation with the Burnam algorithm and PSSC, which measures depressive symptom severity and perceived stress, respectively. We expected the LOT-R pessimism subscale to be positively correlated with the Burnam algorithm and PSSC, and negatively correlated with the QLS-EWB and SWLS. Sample sizes for these tests differed by scales and were as follows: QLS-EWB = 55,041; SWLS = 55,568; Depressive symptom severity = 54,298; and PSSC = 55,080. In sensitivity analyses, validity tests were repeated among women with complete data on all tests of well-being (n = 49,139).
Statistical analyses were conducted in R version 4.2.2 42 using the following packages: ltm 43 for test information, KernSmoothIRT 44 for OCCs, mirt 45 for DIF, psych 46 for Cronbach's alpha, McDonald's omega, validity correlations and EFA, and lavaan 47 and semPlot 48 for CFA. Statistical tests were two tailed and statistical significance was defined at an alpha of 0.05.
Results
Descriptive statistics
Of the 58,810 women in our sample, the average mDES score was 32.9 (SD = 6.2) and LOT-R score was 24.3 (SD = 3.6). Participants were 79.0 (SD = 6.1) years of age, on average, and most were White (89.2%) and completed at least some college or vocational school (83.6%; Table 1). Forty-six percent of women rated their health as “very good.”
Baseline Characteristics Among Women's Health Initiative Extension Study 2 Participants Upon Survey Completion, 2014–2015 (n = 58,810)
GED, General Education Development; SD, standard deviation.
Item response theory models, OCCs, GRMs
Nonparametric item response theory models were assessed by OCCs. All OCCs for the mDES items, except “Felt Awe,” revealed excellent discrimination of each item response across levels of positive affect (Fig. 1). Monotonicity was clear where the probability of rating an item as “Very much” increases as levels of positive affect increase. However, the first three response options for item “Felt Awe” overlapped, which suggests that response options were unable to provide unique information. OCCs for the six LOT-R items revealed excellent discrimination across levels of optimism, especially at the lower levels (Fig. 2).
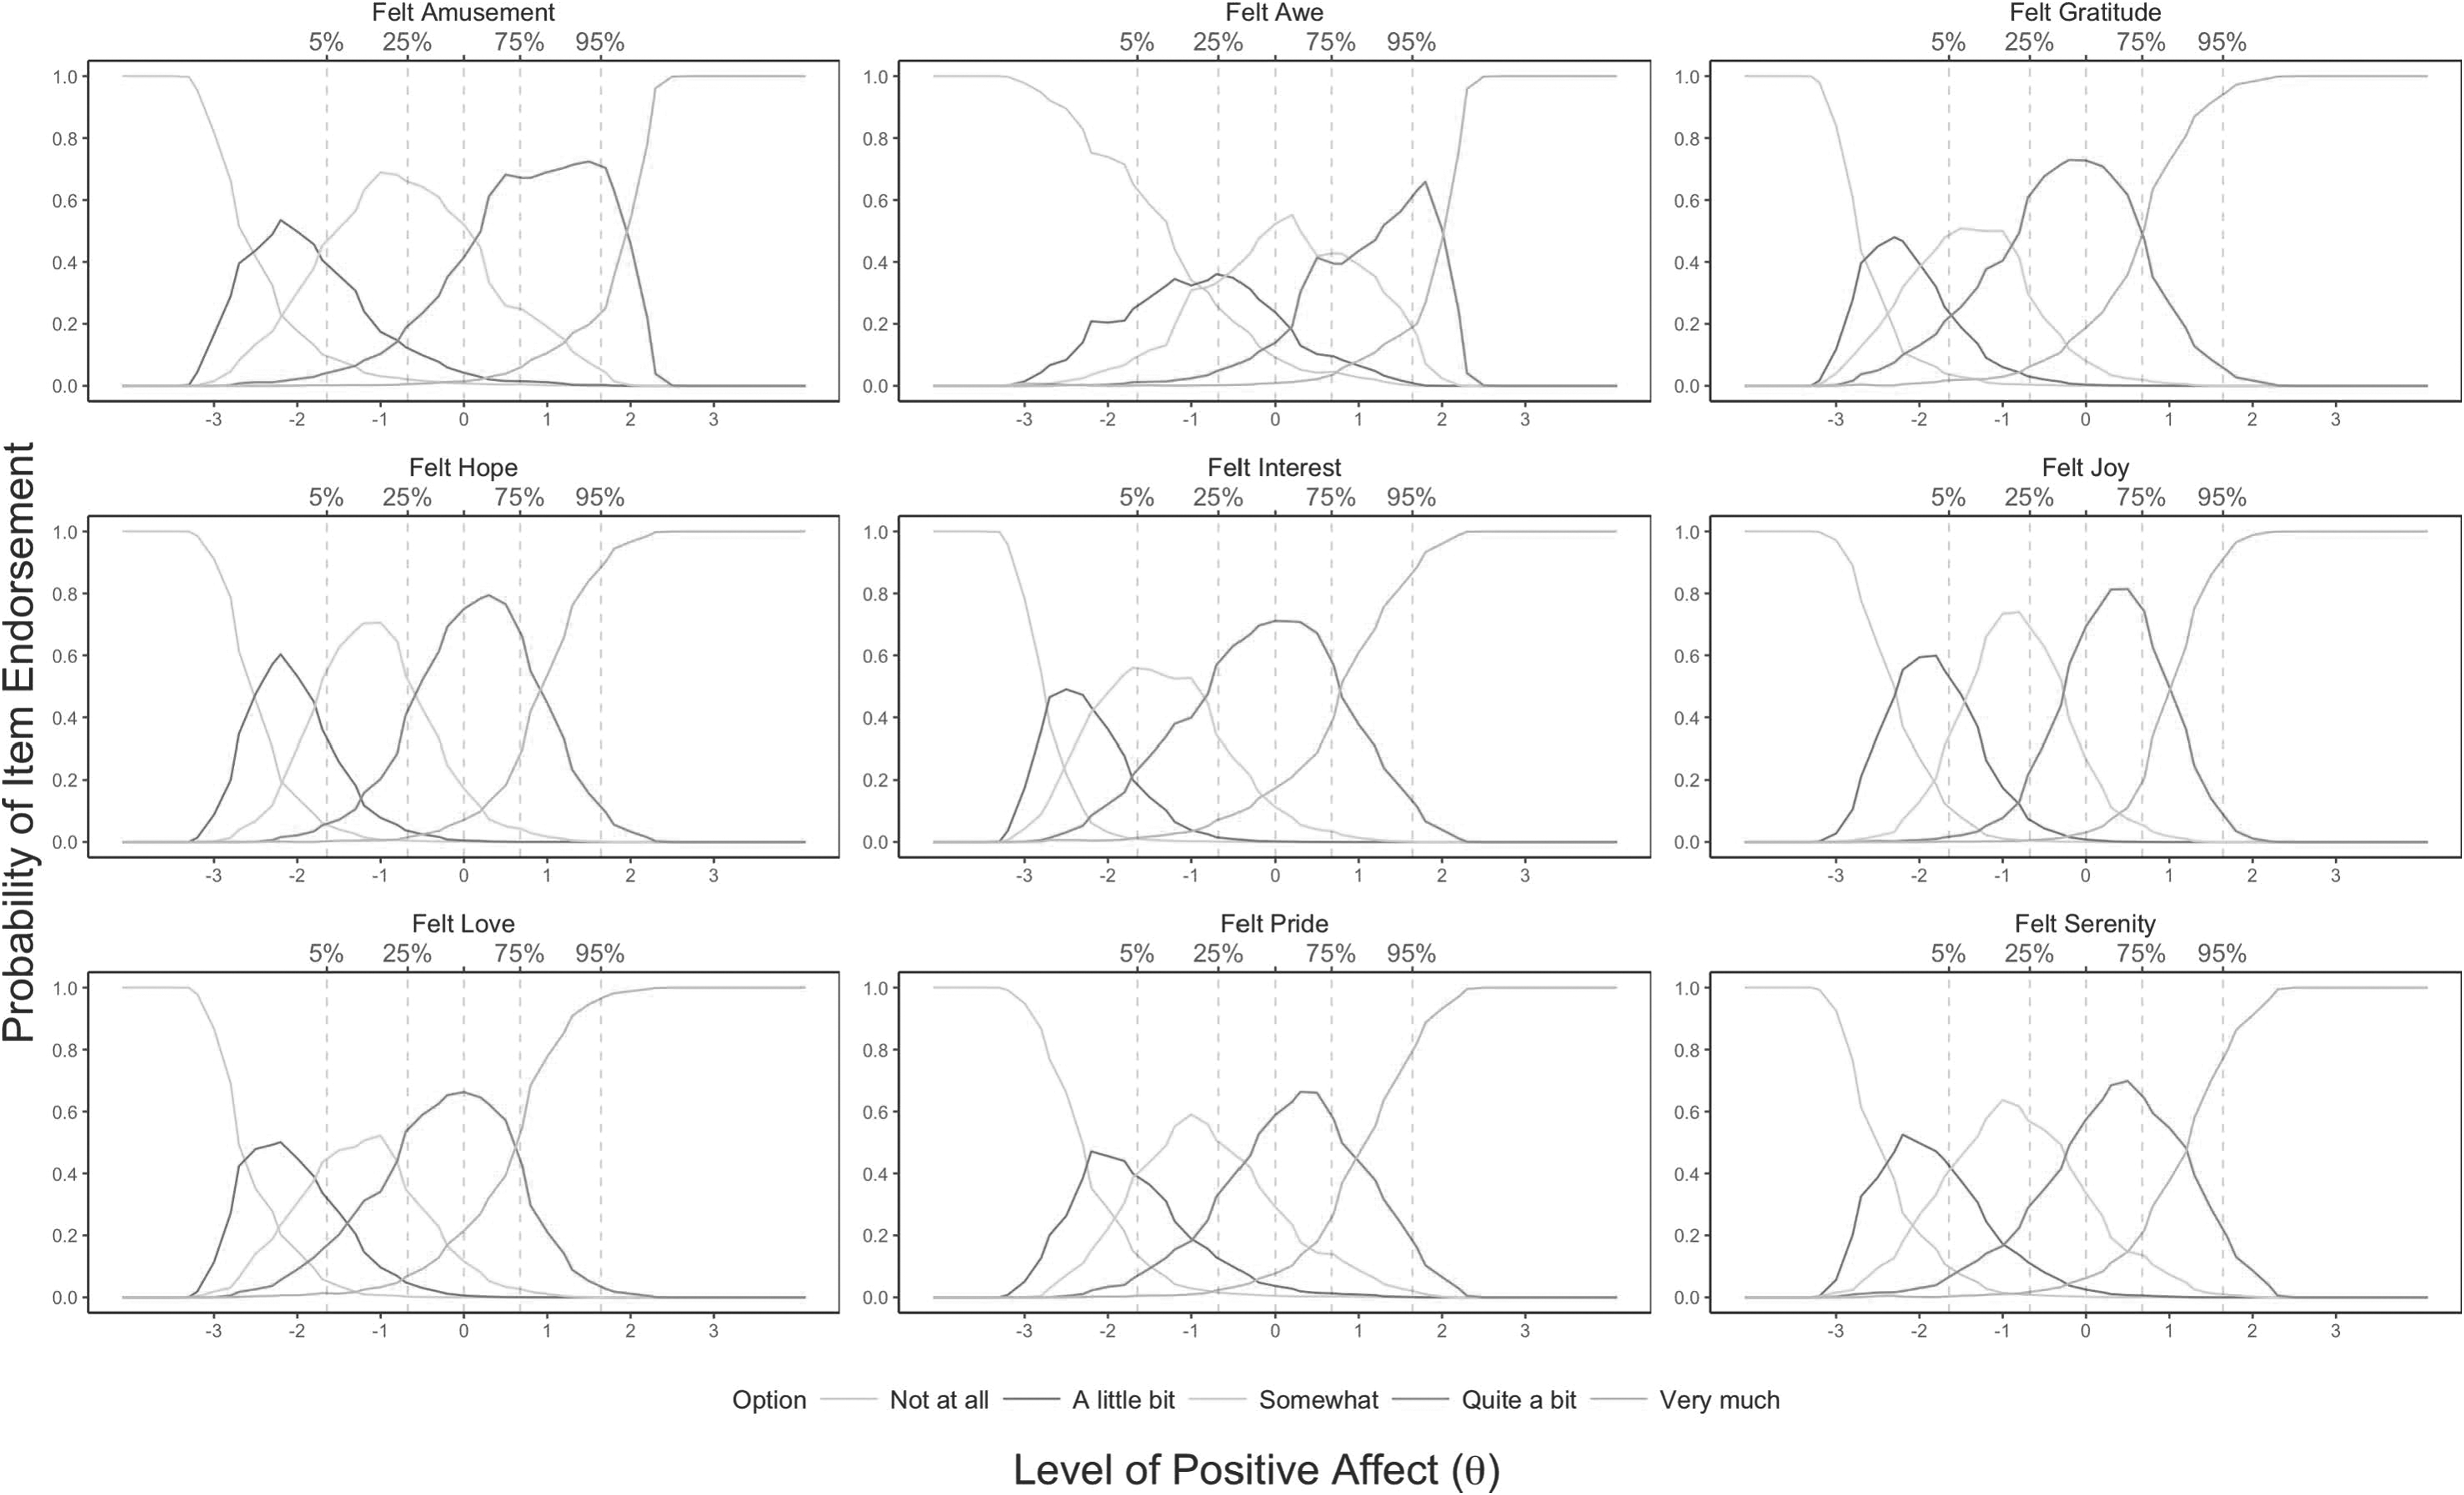
Option characteristic curves for the mDES, estimated from nonparametric item response theory models among Women's Health Initiative Extension Study 2 participants, 2014–2015 (n = 58,810). The x-axis represents the spectrum of underlying latent trait of positive affect and the y-axis represents probability of selecting an option. mDES, modified Differential Emotions Scale.
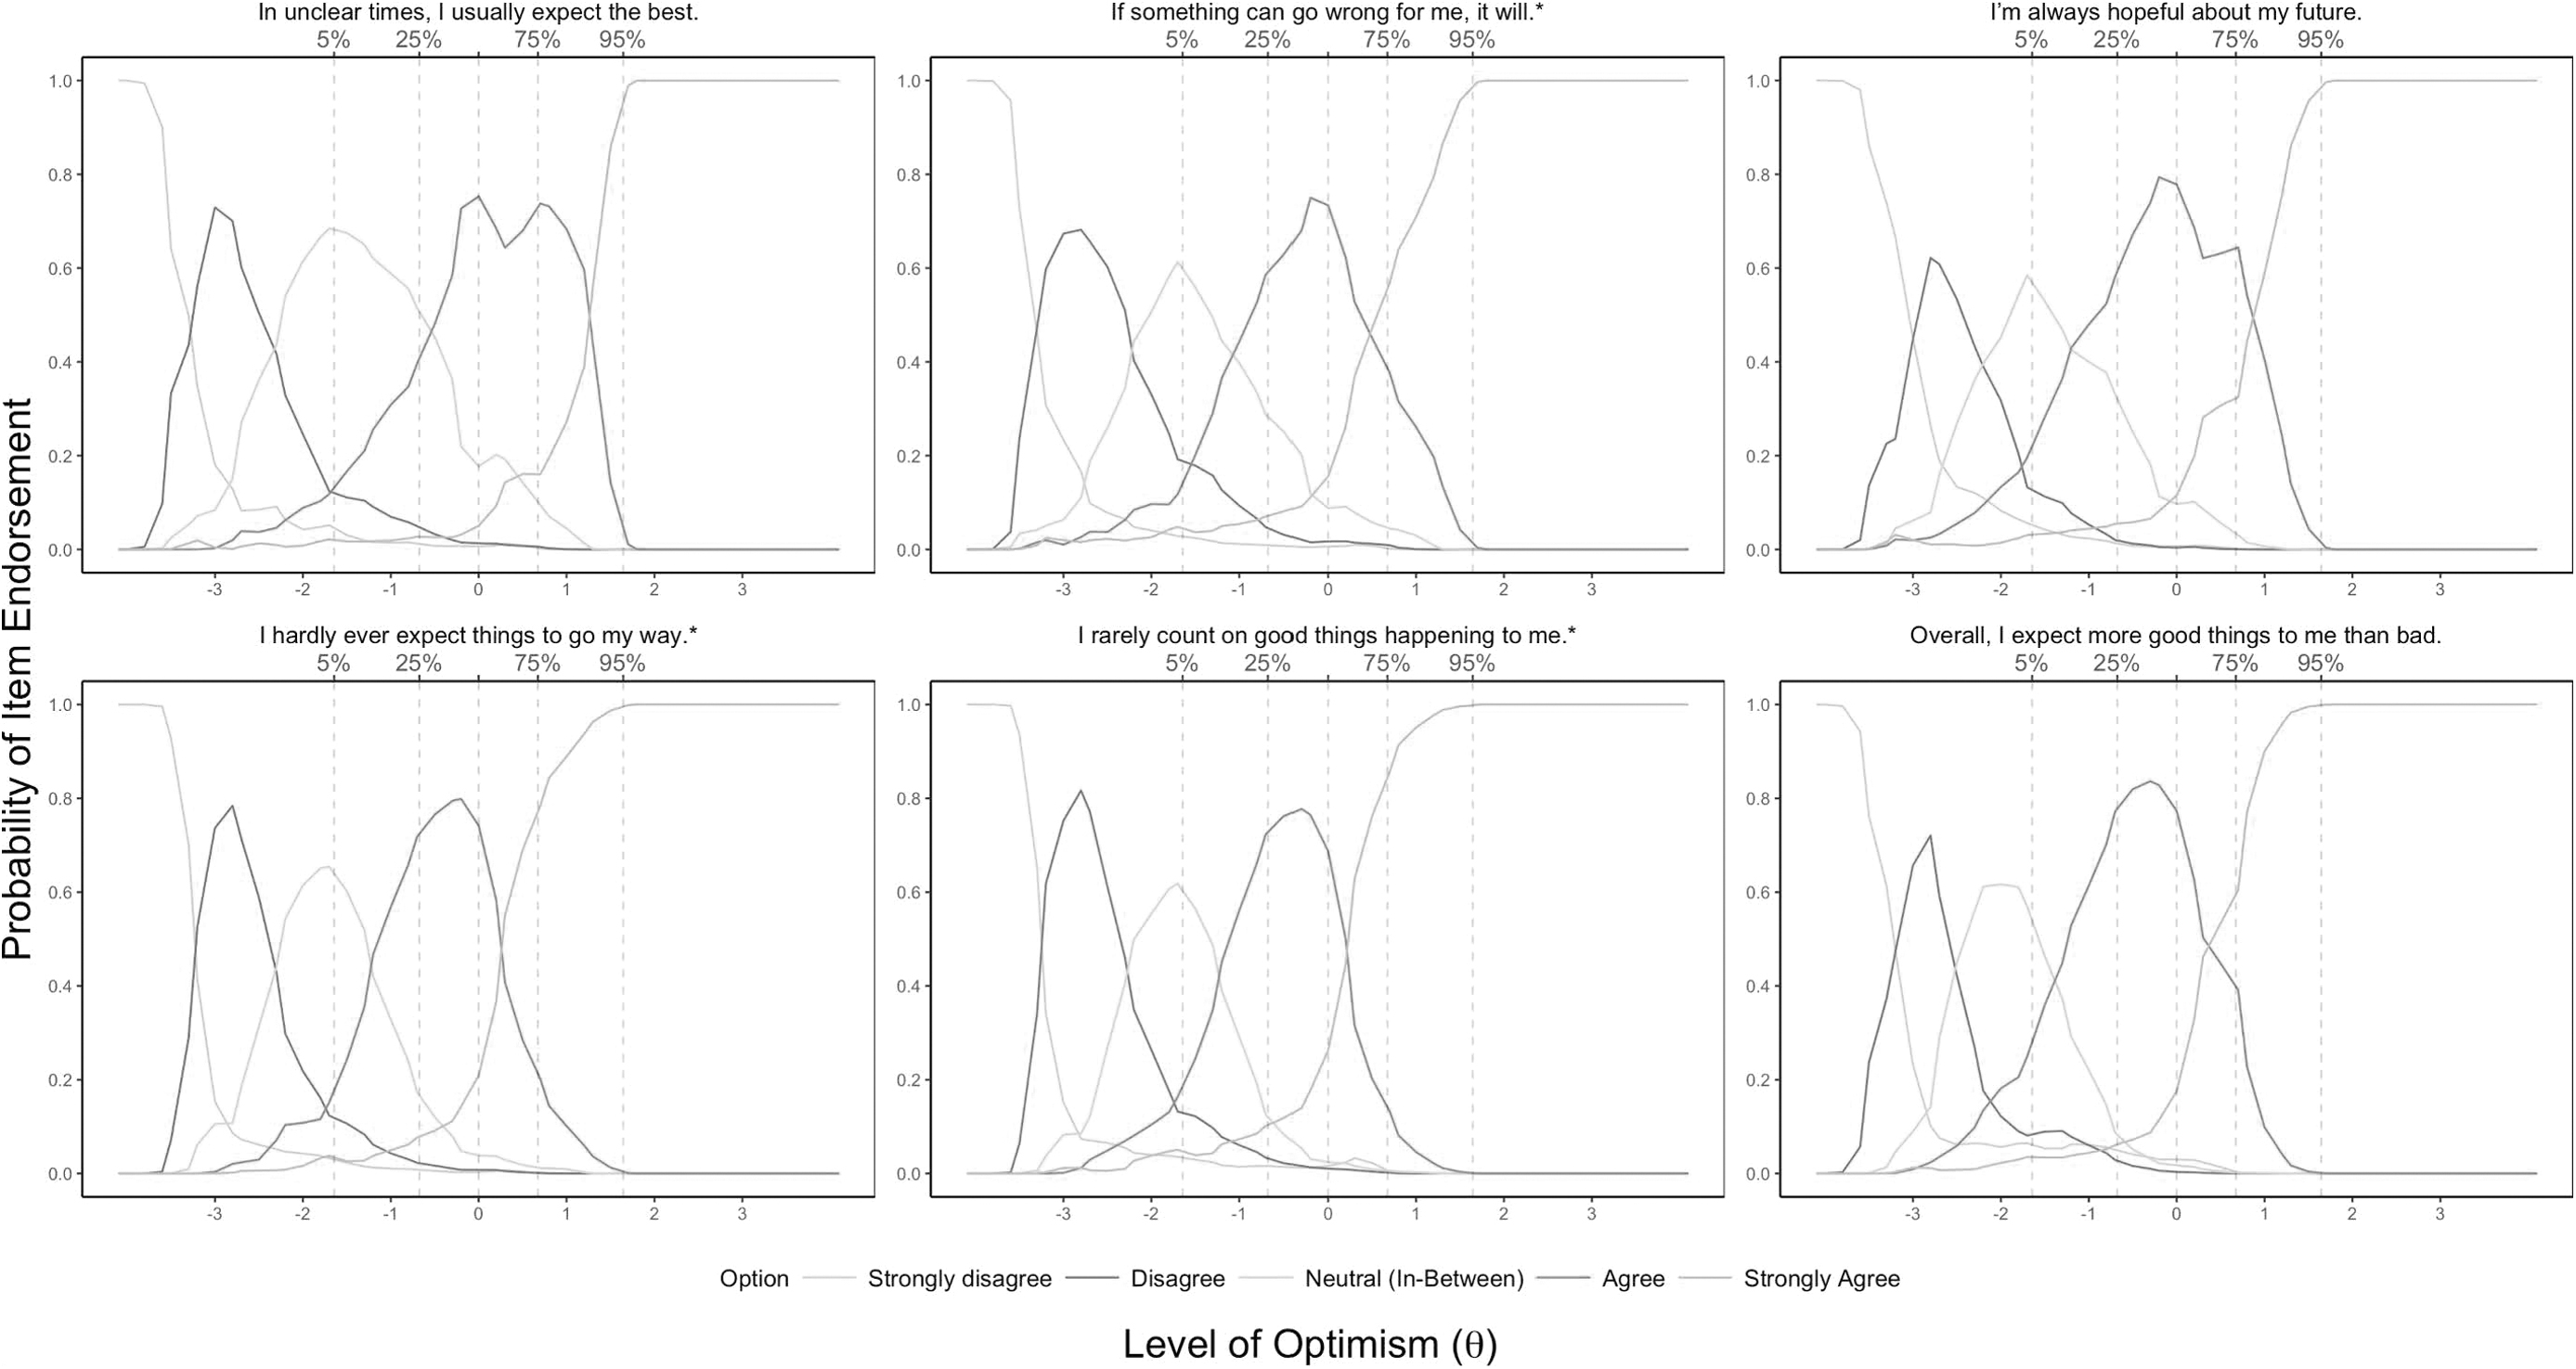
Option characteristic curves for the six-item LOT-R, estimated from nonparametric item response theory models among Women's Health Initiative Extension Study 2 participants, 2014–2015 (n = 58,810). *Indicates reverse scored item. The x-axis represents the spectrum of underlying latent trait of optimism and the y-axis represents probability of selecting an option. LOT-R, Life Orientation Test-Revised.
Parametric GRMs were fitted for mDES and LOT-R items, separately. Test information function curves suggested that most information is contained roughly 2 SD above and below the mean levels of the latent traits (Fig. 3). For the LOT-R, there were higher levels of test information at lower levels of optimism.
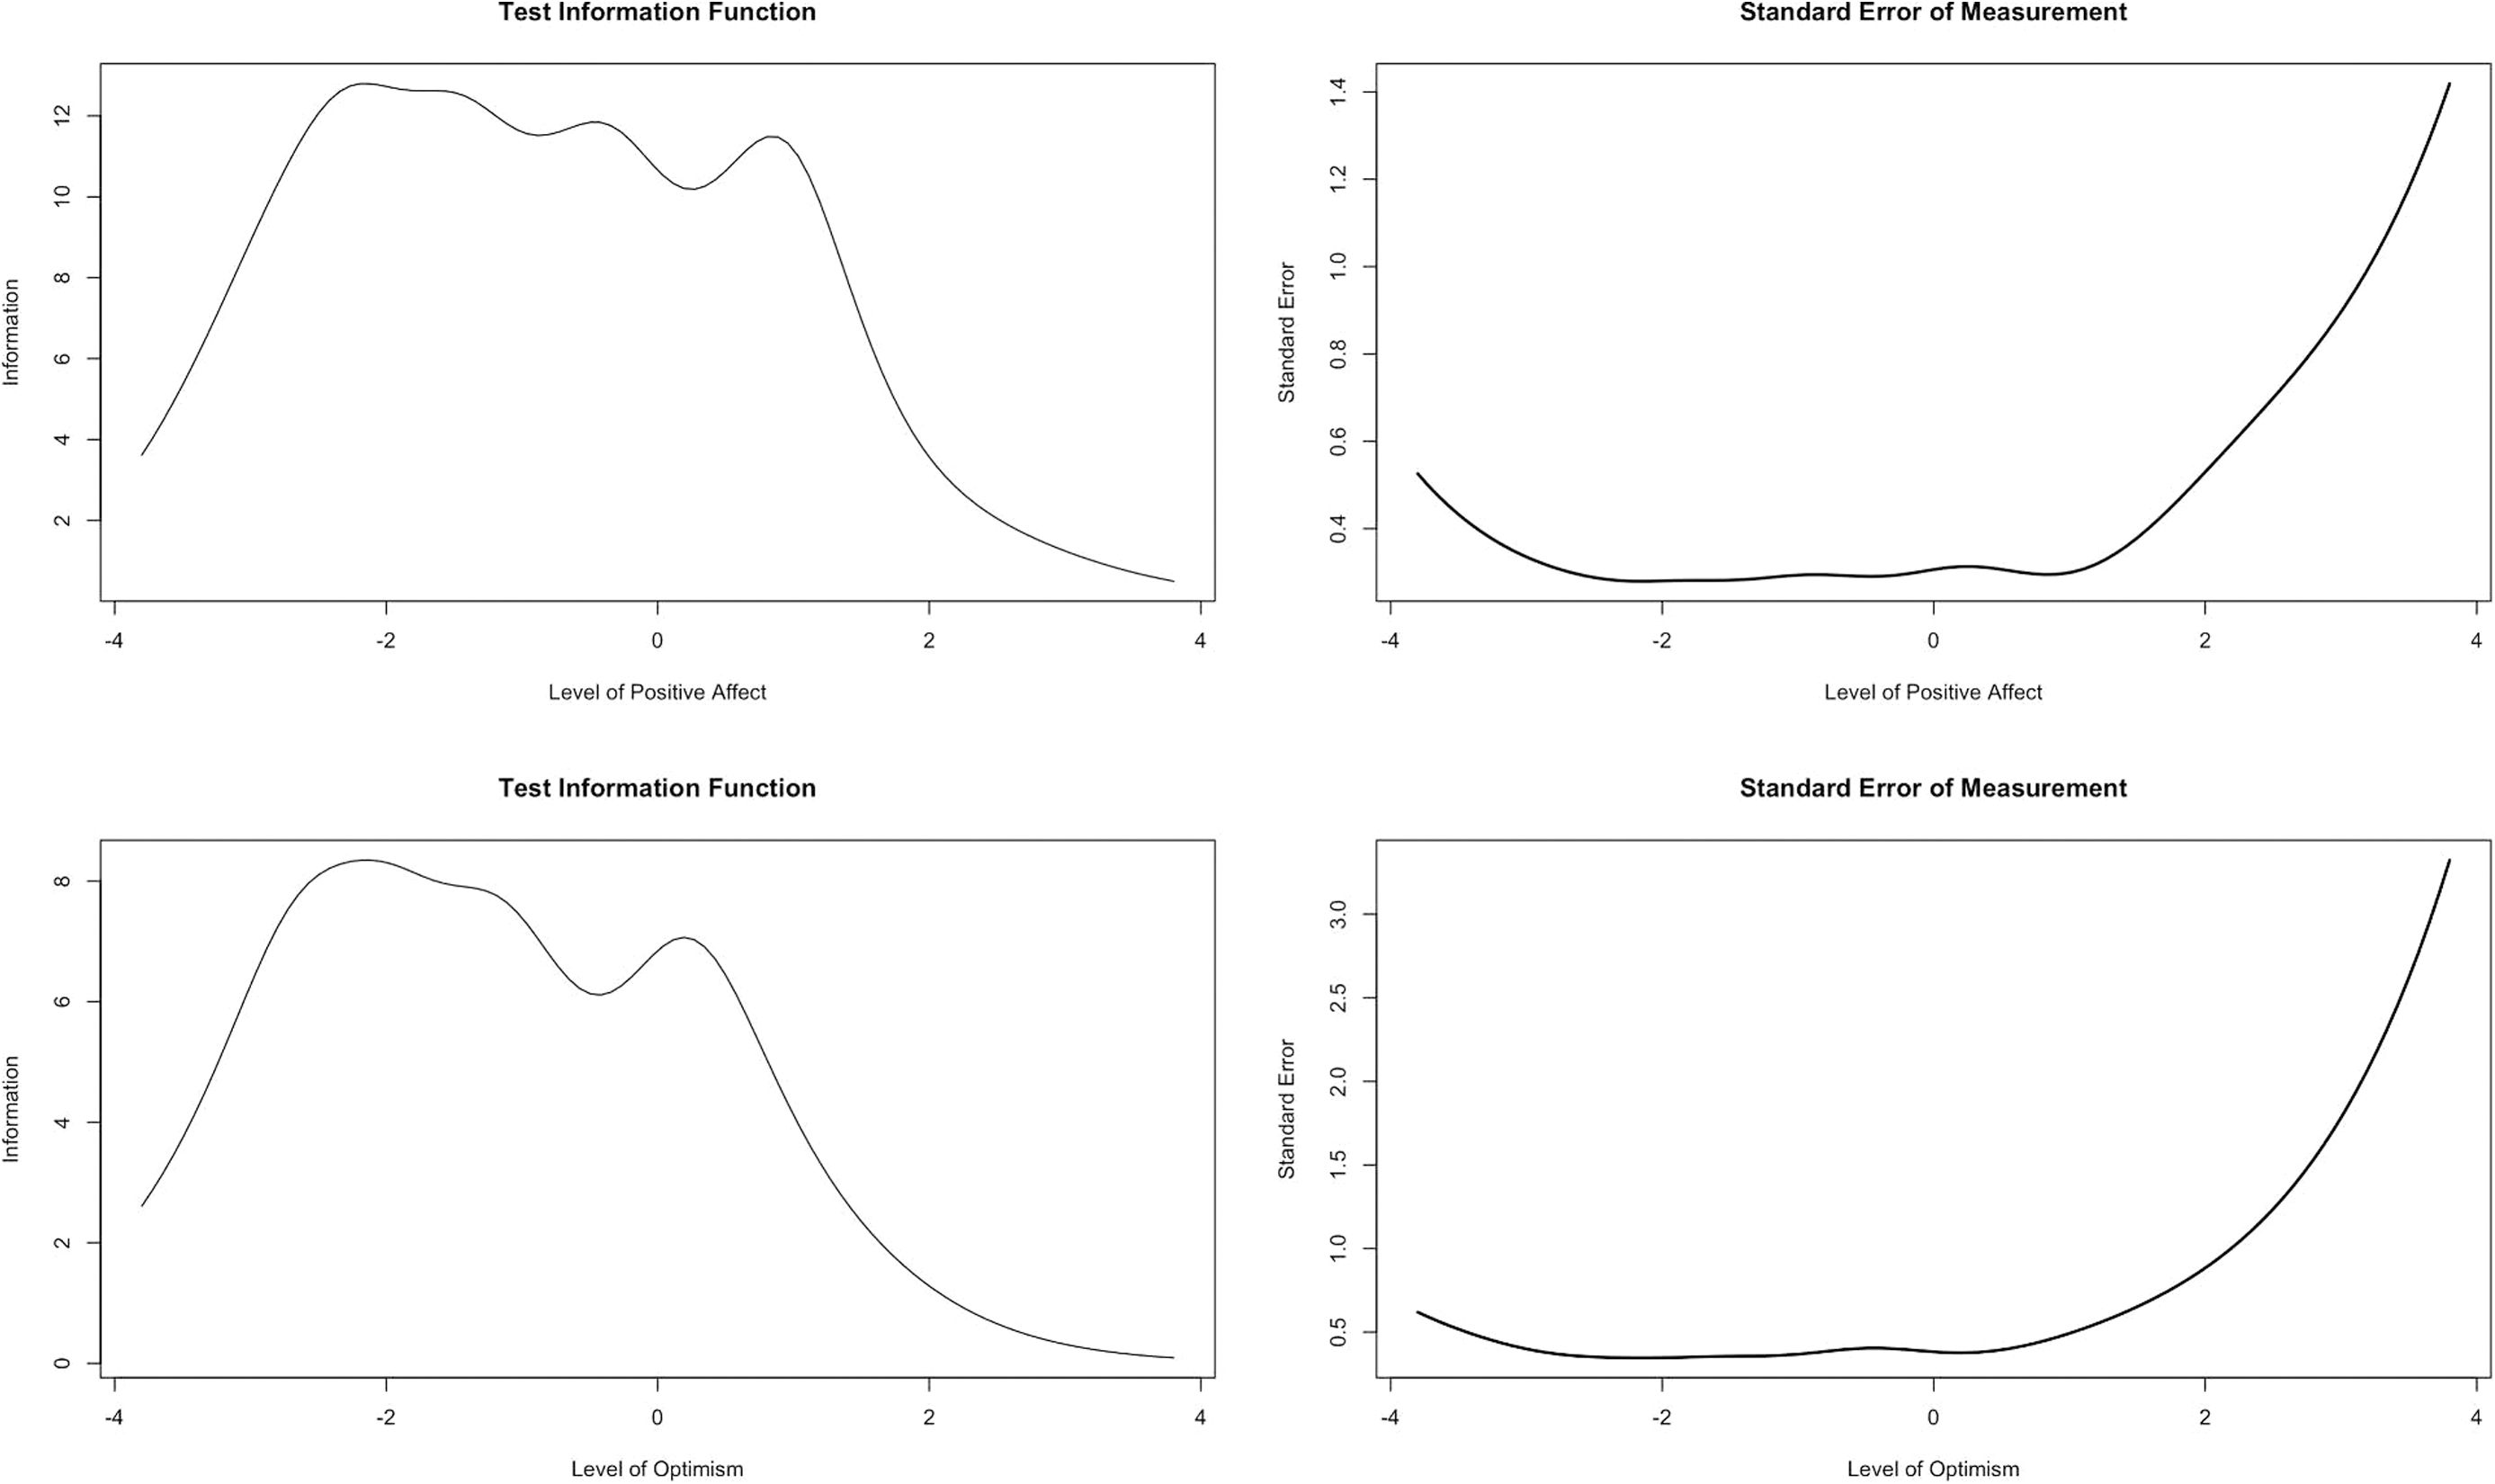
Test information and standard error of measurement curves for the mDES and six-item LOT-R items (n = 58,810). The x-axis represents the level of the underlying latent trait of optimism or positive affect. The y-axis represents the amount of information provided by the test or standard error.
Internal consistency/reliability
The mDES had high reliability with a Cronbach's alpha of 0.90, and McDonald's omega total of 0.92. The LOT-R had moderate reliability, yielding a Cronbach's alpha of 0.79. Cronbach's alpha for the LOT-R optimism and pessimism subscales was 0.72 and 0.77, respectively. McDonald's omega hierarchical was 0.61 and omega total was 0.83, after specifying two factors for the LOT-R. Omega total for the optimism and pessimism subscales was 0.73 and 0.79, respectively.
EFA of the LOT-R
The EFA and parallel analysis of scree plots supported a two-factor solution where optimism and pessimism items separated into two factors. The first factor contained all pessimism-related items (loading range = 0.71–0.91) and the second factor contained all optimism-related items (loading range = 0.67–0.87; Table 2). The parallel analysis of scree plots supported a two-factor solution, where the number of eigenvalues from the analytic dataset was greater than the number of eigenvalues generated from the simulated data (Supplementary Fig. S1). In CFA, the two-factor solution achieved good fit (CFI = 0.995; RMSEA = 0.032; TLI = 0.991; and BIC = 451,739.578; Supplementary Fig. S2).
Summary of the Six-Item Life Orientation Test-Revised Items, and Exploratory Factor Analysis Results (n = 29,405)
Indicates reverse scored item.
LOT-R, Life Orientation Test-Revised.
DIF analyses by education level
DIF by education level was apparent for all mDES and LOT-R items after visual inspection. Expected test score plots showed differences in item functioning by education group for the mDES (Fig. 4). For example, the greatest differences for the mDES were observed for “Felt Interest” (expected score standardized difference [ESSD] = −0.43) and “Felt Amusement” (ESSD = −0.25). There was a statistically significant sDTF statistic (p < 0.01) comparing expected mDES scores by education group. However, the magnitude of observed effect sizes was small, roughly half of an mDES point (sDTF = 0.46 [95% CI 0.38 to 0.54]; uDTF = 0.47 [95% CI 0.39 to 0.55]), suggesting small levels of DTF across levels of positive affect.

Differential item function plots for the mDES comparing ≤high school/GED versus at least some college (n = 58,428). The x-axis represents the spectrum of underlying latent trait of positive affect and the y-axis represents the expected score for each item. n = 382 missing education level. GED, General Education Development.
For the LOT-R, there were several differences in item functioning by education group (Fig. 5). The largest difference was observed for Item 4, “I hardly ever expect things to go my way” (ESSD = −0.47). Results were similar for the LOT-R's optimism and pessimism subscales (Supplementary Figs. S3 and S4). Upon further testing, there was a statistically significant sDTF test statistic (p < 0.01). However, the magnitudes of these differences were <1 point for the LOT-R (sDTF overall = 0.50 [95% CI 0.42 to 0.57]; uDTF overall = 0.53 [95% CI 0.49 to 0.59]; sDTF optimism subscale = 0.21 [95% CI 0.17 to 0.24]; uDTF optimism subscale = 0.21 [95% CI 0.17 to 0.24]; sDTF pessimism subscale = −0.34 [95% CI −0.37 to −0.30]; and uDTF pessimism subscale = 0.34 [95% CI 0.30 to 0.37]). Anchoring items that had small visual differences (i.e., item 3 for the LOT-R; and “Awe” and “Joy” for the mDES) did not substantially affect results (data not shown).
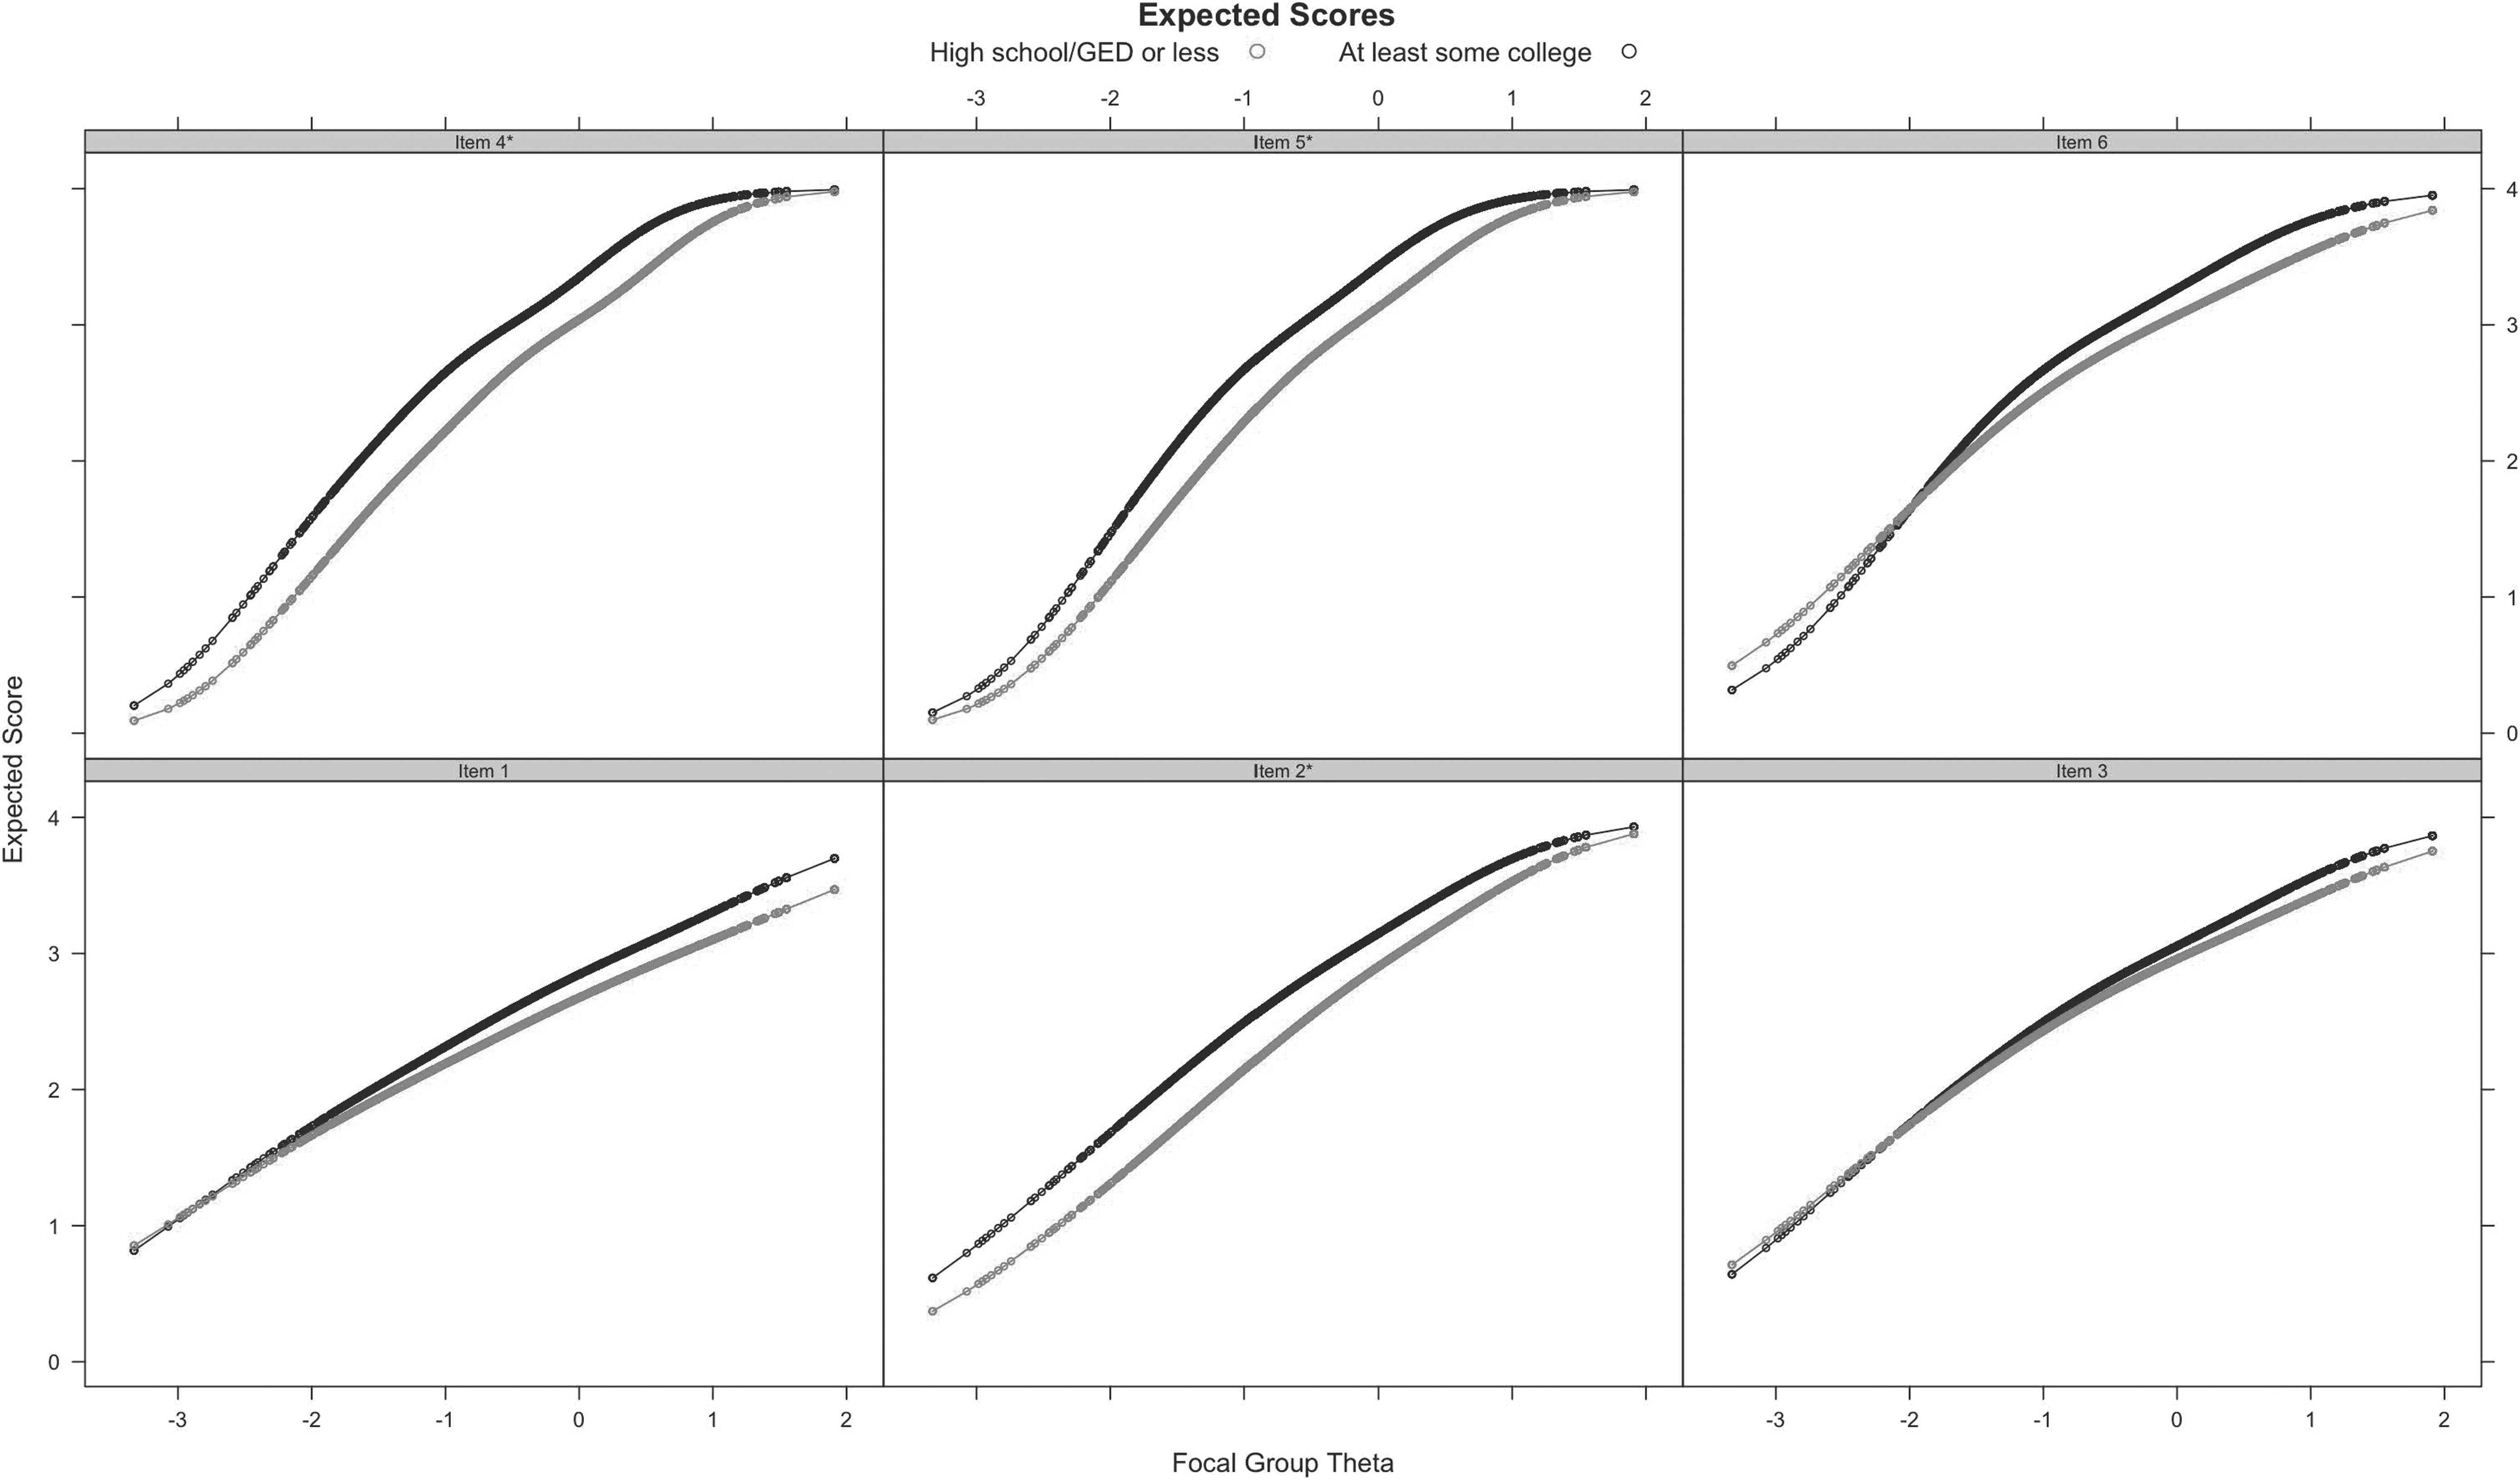
Differential item function plots for the six-item LOT-R comparing ≤high school/GED versus at least some college (n = 58,428). The x-axis represents the spectrum of underlying latent trait of optimism and the y-axis represents the expected score for each item. n = 382 missing education level. GED, General Education Development. *Indicates reverse scored item.
Convergent and divergent validity of mDES and LOT-R with related measures
Validity of the mDES and LOT-R was tested with measures hypothesized to have a positive correlation (Table 3). mDES and LOT-R were correlated with the QLS-EWB (mDES r = 0.36; LOT-R r = 0.42; and LOT-R optimism subscale r = 0.40) and SWLS (mDES r = 0.42; LOT-R r = 0.41; and LOT-R optimism subscale r = 0.41) in the expected positive direction.
Spearman's Correlation Coefficients for Select Measures with the Modified Differential Emotions Scale and Six-Item Life Orientation Test-Revised Among Women's Health Initiative Extension Study 2 participants, 2014–2015
All p-values are p < 0.001.
Depressive symptom severity was measured using the Burnam algorithm.
mDES, modified Differential Emotions Scale; LOT-R, Life Orientation Test-Revised; PSSC, perceived stress scale construct; QLS-EWB, quality-of-life subscale: emotional well-being; SWLS, satisfaction with life scale.
Next, we tested the validity of the mDES and LOT-R with two measures expected to have a negative correlation: Burnam algorithm for depressive symptom severity (mDES r = −0.17; LOT-R r = −0.20; and LOT-R optimism subscale r = −0.19) and the PSSC (mDES r = −0.21; LOT-R r = −0.35; and LOT-R optimism subscale r = −0.29). The LOT-R pessimism subscale was positively correlated with the Burnam algorithm (r = 0.16) and PSSC (r = 0.31), and negatively correlated with the QLS-EWB (r = −0.35) and SWLS (r = −0.33). Results were similar after restricting analyses to women with complete data on all well-being measures (Supplementary Table S1).
Discussion
The results of this study support the use of mDES and LOT-R instruments to measure positive affect and optimism, respectively, among a large sample of mostly non-Hispanic White, older postmenopausal women. High reliability was observed for the mDES and good reliability for the LOT-R. Item response theory-based analyses demonstrated good separation of response options across levels of positive affect and optimism, indicating their ability to detect the spectrum of their latent traits. In addition, these scales exhibited convergent and divergent validity when compared with different measures of well-being. Overall, the mDES and LOT-R are reliable, well-performing, and valid measures that capture their latent traits, demonstrating their ability to perform consistently and predictably in a large community-living sample of older postmenopausal women.
Item response theory-based analyses for the mDES indicated excellent separation of the response items along levels of positive affect. These findings support the mDES as an alternative measure of positive affect in this population. For all LOT-R items, the first three response options were skewed toward lower thresholds of optimism. Our findings showed that LOT-R items may provide more precise estimates at lower levels of optimism. This is consistent with previous research that suggests adding additional response items designed to discriminate between higher levels of optimism to account for the spectrum of optimism, in smaller samples, ranging from 205 to 2,862 participants. 49 –51 Therefore, the LOT-R may be limited in discriminating among higher levels of optimism and could lead to difficulty in measuring granular changes at the higher levels of optimism, unless modified when used in a population of older postmenopausal women.
The mDES and LOT-R demonstrated good reliability in our sample of older postmenopausal women. Our findings yielded slightly better reliability than those reported in a large sample of Greek adults, 18–83 years of age, reporting a Cronbach's alpha of 0.75 for the mDES. 52 LOT-R values in our sample were similar to another study of older adults reporting a Cronbach's alpha of 0.73, 53 as well as another sample of older adults from the University of Michigan Health and Retirement Study reporting a Cronbach's alpha of 0.75. 12 Initial assessment of the LOT-R among college students yielded a fairly high Cronbach's alpha of 0.78. 19
Psychometric assessments of LOT-R in populations of older males and females indicated good reliability. 12,53 One study of 9,711 community-dwelling adults in Germany 18–80 years of age found few differences in LOT-R across age and gender. 54 Slight differences between our findings and prior research may be due to different population characteristics (e.g., inclusion of males and females, younger ages, etc.), yet support overall reliability of both scales.
In our EFA, we found that the LOT-R separated into two factors representing optimism and pessimism. In validity analyses, these subscales correlated with different measures of well-being as hypothesized. This is consistent with others who used optimism and pessimism subscales of the LOT-R as bidimensional factors. 14,34,35,55 Future assessment of the LOT-R may benefit from reporting findings stratified by the total score alongside scores for the optimism and pessimism subscales. In a meta-analysis that included WHI data, the absence of pessimism and the presence of optimism were associated with positive physical health outcomes, 56 supporting the assessment of optimism and pessimism as separate constructs.
DIF analyses showed differences by education level for the mDES and LOT-R items. This suggests that individuals of different education levels interpreted items differently. However, the magnitude of expected score differences between groups for both scales was small (e.g., approximately half of one point of the scale). This is similar with another study that found LOT-R DIF by age and sex, yet the magnitudes of effects were small. 51 Educational attainment is associated with positive health behaviors (e.g., reducing daily smoking behavior) and other sociodemographic factors such as employment and hourly wage. 57 Therefore, future research should explore these differences in populations with a greater variety of educational attainment, given that 83.62% of our sample had at least some college education. Further research is needed to examine these differences, while accounting for differences by region, gender, race, and ethnicity. 58,59
Positive emotions and emotional resources are important factors to consider because they can serve as key targets for health-promoting interventions. 20 Further research on modifying the affective experiences of positive health behaviors have been elicited. 60 Thus, measuring positive affect and optimism using the mDES and LOT-R should be further explored in surveillance efforts and as a mediator or moderator in studies and interventions of specific health outcomes. Positive affect and optimism may contribute to promoting healthy behaviors that support healthy well-being. 4 Optimism may also increase coping strategies that support positive health outcomes. 7,8 For example, these constructs have been shown to be associated with greater physical function, 61 higher quality of life, 62 better coping, 63 and reduced coronary heart disease mortality. 53 The findings from this study suggest that both scales are reliable in a population of older postmenopausal women and would allow future research to more confidently use these measures.
There are limitations to our study. First, we were unable to use the full mDES set of items to assess negative affect to perform a complete scale assessment because negative affect items from the mDES were not included in the WHI survey design. Reverse scoring positive affect items to assess negative affect may be prone to inattention and confusion. 64 However, our results along with others suggest high reliability of only using mDES's positive affect items. 65 Future studies should use the full set of positive and negative affect mDES items.
Second, there is potential for selection bias, given that our sample consisted of women who were able to complete the supplemental questionnaire in 2014–2015. Participant race and ethnicity distributions were similar to WHI baseline. 23 However, we could not determine whether selection was differential by optimism or positive affect levels because we used questionnaire data after WHI baseline.
Third, we did not have repeated measures of either scale and could not assess test-retest reliability or sensitivity to change of positive affect and optimism. Incorporating repeated measures will be crucial to understanding how these latent traits change over time and in response to intervention. This can help contextualize findings from epidemiologic studies of how they affect health over the life course.
Fourth, the Positive and Negative Affect Schedule (PANAS) scale, a commonly used measure of positive affect, was not administered in the WHI study. To further assess the psychometric properties of the mDES, future studies should consider comparing both scales.
Finally, most of our sample were non-Hispanic White, older women. Future research is needed to investigate the reliability and performance of mDES and LOT-R in cohorts that include men and people from diverse racial, ethnic, and sociodemographic backgrounds.
This study had several strengths, which included a large sample of older women across the United States. With this large population, we were able to conduct factor analysis using a split-sample approach. In addition, data were available to test the convergent and divergent validity of mDES and LOT-R with four other scales.
Conclusions
In this large sample of mostly non-Hispanic White, older postmenopausal women, the mDES and LOT-R measured positive affect and optimism with good reliability, item performance, and concurrent and divergent validity. The LOT-R contained more test information at lower levels of optimism, supporting recommendations of scale modification to capture the full spectrum of optimism. Given the reliability and performance of these scales in a population of older women, subsequent research can more confidently examine relationships between the mDES and LOT-R with health-promoting behaviors and other important factors of aging.
Footnotes
Acknowledgments
The authors would like to thank Drs. David Strong and Andrea LaCroix for their support on this project. The authors would like to acknowledge the WHI Investigators listed below. For a list of all the investigators who have contributed to WHI science, please visit:
Program Office: National Heart, Lung, and Blood Institute, Bethesda, MD (Jacques Rossouw, Shari Ludlam, Joan McGowan, Leslie Ford, and Nancy Geller). Clinical Coordinating Center: Fred Hutchinson Cancer Research Center, Seattle, WA (Garnet Anderson, Ross Prentice, Andrea LaCroix, and Charles Kooperberg). Investigators and Academic Centers: Brigham and Women's Hospital, Harvard Medical School, Boston, MA (JoAnn E. Manson); MedStar Health Research Institute/Howard University, Washington, DC (Barbara V. Howard); Stanford Prevention Research Center, Stanford, CA (Marcia L. Stefanick); The Ohio State University, Columbus, OH (Rebecca Jackson); University of Arizona, Tucson/Phoenix, AZ (Cynthia A. Thomson); University at Buffalo, Buffalo, NY (Jean Wactawski-Wende); University of Florida, Gainesville/Jacksonville, FL (Marian Limacher); University of Iowa, Iowa City/Davenport, IA (Jennifer Robinson); University of Pittsburgh, Pittsburgh, PA (Lewis Kuller); Wake Forest University School of Medicine, Winston-Salem, NC (Sally Shumaker); and University of Nevada, Reno, NV (Robert Brunner). Women's Health Initiative Memory Study: Wake Forest University School of Medicine, Winston-Salem, NC (Mark Espeland).
Authors' Contributions
A.I.B.P. drafted the article. A.I.B.P., N.M.Y., and J.B. led the statistical analysis. N.M.Y. and R.H.R. provided positive psychology content expertise. All authors contributed to the study design and interpretation of data, as well as providing critical revision of the article for intellectual content. All authors read and approved the final article.
Author Disclosure Statement
No competing financial interests exist.
Funding Information
Alexander Ivan B. Posis is supported by the National Institute on Aging (NIA) of the National Institutes of Health (NIH) through a T32 Predoctoral Training Fellowship under award number T32 AG058529. Natalie M. Yarish is supported by an award from the National Heart, Lung, Blood Institute (K01 HL15934801). John Bellettiere was funded by TRDRP grant number T31KT1501. The WHI program is funded by the National Heart, Lung, and Blood Institute, NIH, United States. Department of Health and Human Services through 75N92021D00001, 75N92021D00002, 75N92021D00003, 75N92021D00004, and 75N92021D00005. The content is solely the responsibility of the authors and does not necessarily represent the official views of the NIH.
Supplementary Material
Supplementary Figure S1
Supplementary Figure S2
Supplementary Figure S3
Supplementary Figure S4
Supplementary Table S1
References
Supplementary Material
Please find the following supplemental material available below.
For Open Access articles published under a Creative Commons License, all supplemental material carries the same license as the article it is associated with.
For non-Open Access articles published, all supplemental material carries a non-exclusive license, and permission requests for re-use of supplemental material or any part of supplemental material shall be sent directly to the copyright owner as specified in the copyright notice associated with the article.
