




Abstract
Background:
Racial and socioeconomic status (SES) disparities in preterm delivery (PTD) have existed in the United States for decades. Disproportionate maternal exposures to adverse childhood experiences (ACEs) may increase the risk for adverse birth outcomes. Moreover, racial and SES disparities exist in the prevalence of ACEs, underscoring the need for research that examines whether ACEs contribute to racial and SES disparities in PTD.
Methods:
We examined the relationship between ACEs and PTD in a longitudinal sample of N = 3,884 women from the National Longitudinal Study of Adolescent to Adult Health (1994–2018). We applied latent class analysis to (1) identify subgroups of women characterized by patterns of ACE occurrence; (2) estimate the association between latent class membership (LCM) and PTD, and (3) examine whether race and SES influence LCM or the association between LCM and PTD.
Results:
Two latent classes were identified, with women in the high ACEs class characterized by a higher probability of emotional abuse, physical abuse, sexual abuse, and foster care placement compared with the low ACEs class, but neither class was associated with PTD. Race and SES did not predict LCM.
Conclusions:
Our findings suggest that ACEs may not impact PTD risk in previously hypothesized ways. Future research should assess the impact of ACEs on the probability of having live birth pregnancies as well as the role of potential protective factors in mitigating the impact of ACEs on PTD.
Introduction
Significant racial and socioeconomic disparities in preterm delivery (PTD) have existed in the United States for decades. 1 –5 Specifically, Black women and women with low socioeconomic status (SES) experience a higher prevalence of PTD compared with other women. 2 Although the cause of these disparities is likely influenced by factors at multiple socio-ecological levels (individual, interpersonal, community, and institutional), one hypothesized mechanism is that disproportionate exposures to significant life stressors for these women may increase their risk for adverse birth outcomes. 6,7
Adverse childhood experiences (ACEs), or negative life events occurring before 18 years of age, are a category of life stressors with significant implications for preconception and pregnancy health. However, the literature to date has predominantly focused on chronic disease-related conditions and mental health. 8,9 An emerging body of literature has begun to link ACEs with adverse reproductive and pregnancy outcomes, including unintended pregnancy, depression, anxiety, and alcohol use during pregnancy, and adverse birth outcomes. 10 –15
Studies have investigated the impact of ACEs on PTD in recognition that adverse events occurring early in an individual's life may influence future pregnancy health. 11 Moreover, racial and socioeconomic disparities exist in ACE prevalence, with Black and American Indian or Alaska Native individuals experiencing a higher prevalence compared with White individuals, 16 underscoring the importance of research examining whether ACEs contribute to racial and socioeconomic disparities in PTD.
To date, the evidence linking ACEs and PTD is mixed, 11,17 –19 and methodologic gaps remain. First, most studies do not include nationally representative datasets or sufficiently diverse racial and SES samples, which limits generalizability and impedes the identification of subgroups at highest risk for adverse birth outcomes. Second, most samples have been relatively small, which undermines power and could lead to inaccurate findings. Third, most studies have only assessed ACEs during pregnancy or the postpartum period, which may increase the likelihood for recall bias. For example, women might be more likely to overreport adverse life experiences during pregnancy or postpartum if they have had a particularly difficult or traumatic pregnancy experience. Fourth, most studies have primarily assessed ACEs using count and sum scores that capture the cumulative total of ACEs experienced and give each item equal weight. However, as ACEs co-occur 20 and exert synergistic effects on health outcomes, 21 this method of operationalization may not capture the full impact of ACEs on maternal health outcomes.
To address these gaps, our study examines the relationship between ACEs and PTB in a longitudinal sample of women from the National Longitudinal Study of Adolescent to Adult Health (Add Health; 1994–2018). Specifically, we apply latent class techniques to (1) identify subgroups of women characterized by early life patterns of ACE occurrence; (2) estimate the association between latent class membership (LCM) and PTD; and (3) examine whether race and SES influence LCM or the association between LCM and PTD.
Methods
Study design, dataset, and study population
We used the National Longitudinal Study of Adolescent to Adult Health (Add Health) dataset, a nationally representative, prospective study of adolescents in grades 7–12 initiated in 1994 by the Carolina Population Center and the University of North Carolina at Chapel Hill. Add Health examines the diverse social, behavioral, and biological influences on adolescent health and well-being, along with their development into adulthood. 22,23 Add Health used a multistage, stratified cluster sampling design to recruit a sample of adolescents from middle and high schools across the United States. 23 Add Health entails five waves of follow-up: Wave I (1994–1995), Wave II (1996), Wave III (2001–2002), Wave IV (2008–2009), and Wave V (2016–2018). 22,23
This study focuses on the Add Health source population of n = 20,745 students selected to participate in the at-home survey component and to be followed up in all subsequent waves of follow-up. 23 After excluding male adolescents (n = 10,263), female adolescents who did not have a pregnancy that resulted in a live birth by 2018 (n = 6,446), female adolescents who did not report information on gestational age for the first birth in Wave V (n = 71), female adolescents who were missing information on any weighting variables provided to account for the stratified, clustered sampling design of Add Health 24 (n = 66), and female adolescents who were missing information on race (n = 13), our final analytic sample included N = 3,884 women (Fig. 1).
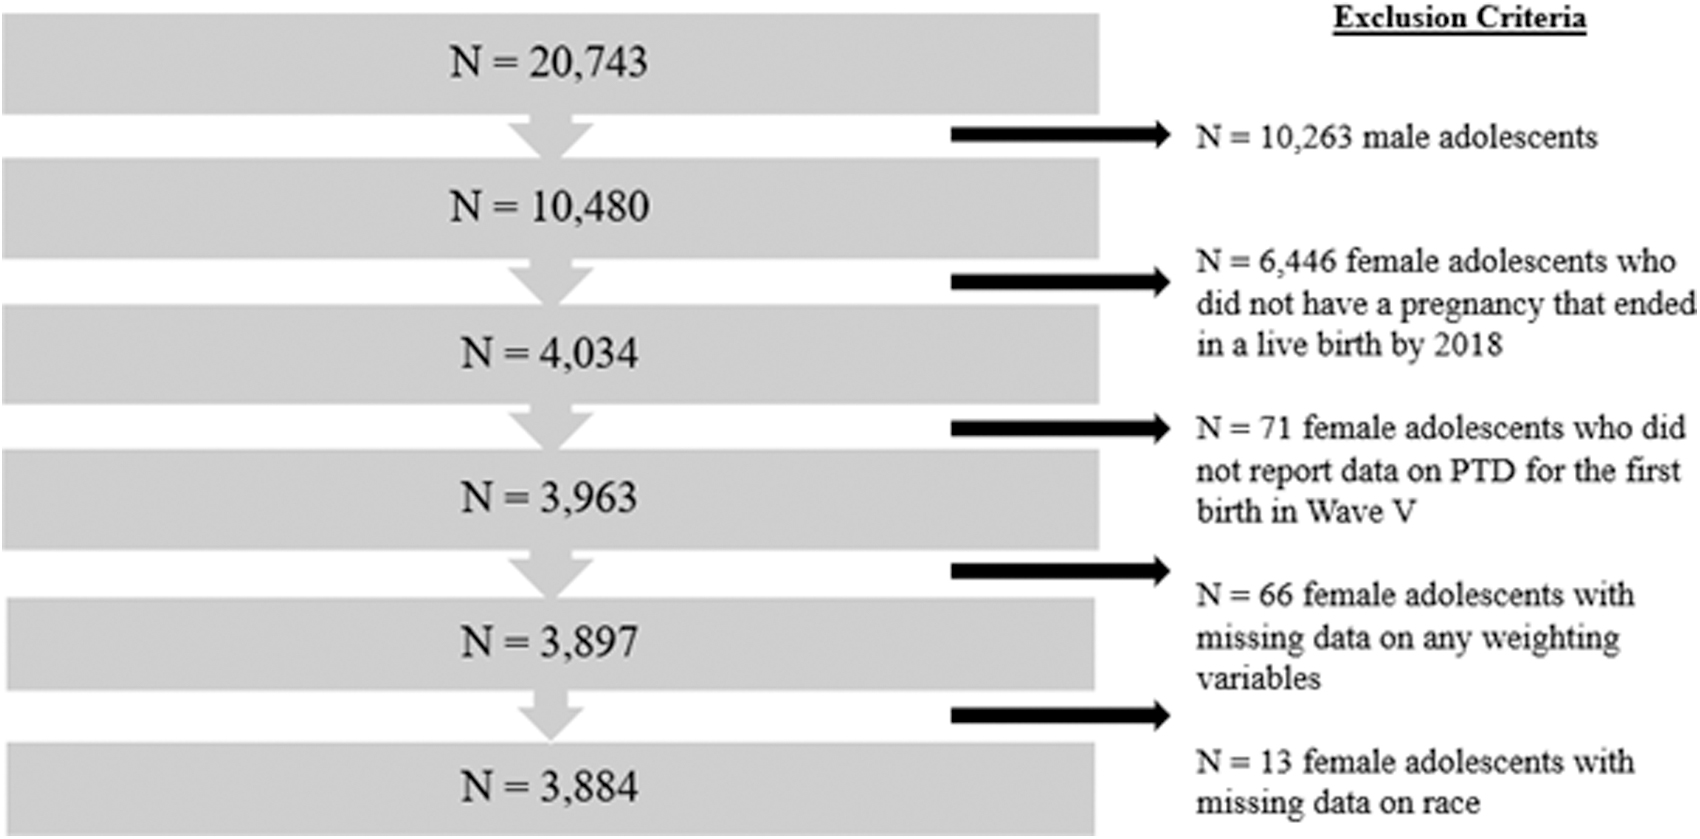
Analytic sample used to assess the association between patterns of ACEs and PTD in the National Longitudinal Study of Adolescent to Adult Health, 1994–2018. ACE, adverse childhood experience; PTD, preterm delivery.
IRB approval
Our use of the Add Health Restricted Use Dataset was approved by the Carolina Population Center at the University of North Carolina at Chapel Hill, and this research work was determined exempt from human subjects research under 45 CFR 46.104(d) 4(ii) by the Institutional Review Board (IRB) at Michigan State University.
Measures
Exposure variables
Our exposure variables included six ACEs across three broad domains of ACEs including (1) abuse (sexual abuse, physical abuse, emotional abuse), (2) neglect, and (3) household dysfunction (family member attempted suicide or death by suicide, and foster care placement) (Supplementary Appendix Table S1). The selection of these ACEs was informed by the “conventional ACEs” included in the original ACE study by the CDC and Kaiser Permanente 8,9 as well as the “expanded ACEs” identified in subsequent research. 25
We operationalized physical, sexual, and emotional abuse (each assessed by one question, respectively) and neglect (a composite of three questions) by creating a binary variable based on frequency of occurrence: “yes” for reported frequencies of ≥1 and “no” for reported frequencies of “0.” Suicide was captured by two questions pertaining to attempted suicide or death by suicide of family members and modeled as a binary variable (yes/no).
Outcome variable
We assessed PTD as our primary outcome of interest, defined as a delivery that occurs before 37 weeks of gestation. Information on PTD (for the first birth only) was collected via self-report and modeled as a binary variable (yes/no). Previous studies show that maternal reports of gestational age compare favorably with those obtained by medical records or birth certificates. 26,27 Data on PTD (Wave V: 2016–2018) was collected at a different time point than the ACEs (Waves I: 1994–1995, Wave III: 2001–2001, Wave IV: 2008–2009), which constitutes a methodologic strength of this study as it reduces the likelihood for reporting bias compared to studies that assess ACEs during pregnancy or the postpartum period. Supplementary Appendix Figure S1 illustrates the timeline of Add Health data collection, approximate ages of participants during each wave, and key variables assessed in this study.
Covariates
Race (White, Black, Hispanic, Asian, Pacific Islander, American Indian/Alaska Native, Other) was captured via self-report. White women were designated as the reference group for race. If a respondent indicated they were multi-racial, a follow-up question was asked of respondents to indicate the racial group they best identified with. In this study, race is conceptualized as, “…a social classification based on phenotype that governs the distribution of risks and opportunities in our race-conscious society” (Jones, 2001, p. 300). 28 Although race is a social construct and is not biologically or genetically based, it holds important implications for the health and well-being of individuals and communities. 28 –31 Furthermore, although we use six categories of race in this study, we acknowledge that each of these subgroups are heterogeneous and comprise diverse ethnicities and nationalities. Finally, to promote grammatical equity in reference to race we use intentional capitalization for all racial subgroups throughout this article. 32
SES was assessed as childhood SES and captured by a composite construct of six indicators (mother's occupation, father's occupation, mother's education, father's education, total household income reported in 1994, and receipt of public assistance) (Supplementary Appendix Table S2). 33 Each of these socioeconomic variables were modeled as binary variables where 0 represented “low SES” and 1 represented “high SES.” 33 The scores for each of the six variables were then summed to create a composite SES variable with values ranging from 0 to 6. 33 Based on the distribution of scores of the composite SES variable, three categories of SES were created: low (score < lowest quartile), middle (score ≥2nd quartile and ≤3rd quartile), and high (score > upper quartile). 33 Women with high SES were designated as the reference group for SES. Missing data on any of these variables were categorized as “low ses.” 33 Prior literature as well as our own supplemental analyses (available upon request) indicate that individuals who do not report information on indicators of SES on surveys tend to be from lower SES backgrounds. 34,35
Adverse events during childhood can subsequently impact factors such as age at menarche, age at which women give birth (i.e., maternal age), parity, social relationships including marital status, risky sexual behaviors, adverse health behaviors during pregnancy (i.e., smoking, alcohol use), mental health, as well as SES in adulthood, 8,13,17,36 –42 all of which can influence PTD risk. Therefore, we conceptualized these variables as mediators in the pathway between ACEs and PTD, and we do not control for these in the analyses.
Analytic plan
Assessment of missing data
Observations with missing data on PTD, race, or weighting variables were excluded from the analytic sample (n = 150; 3.7%). The distribution of exposure variables, outcome variable, and covariates did not change significantly between the analytic sample and the reference population upon removal of these missing data (Supplementary Appendix Table S3).
To maximize sample size and data provided on the six ACE indicators, we used full-information maximum likelihood (FIML) with the assumption of missing at random to address missing data on these variables. 43,44 Unlike listwise deletion that removes observations with any missing data on study variables, FIML uses all data from a respondent and estimates values for variables with missing data based on the maximization of the log-likelihood function of the sample. 44 Less than 5% (n = 117) of the analytic sample was missing data on any one ACE or across all ACE items.
Descriptive analyses
The distribution of maternal characteristics, PTD, and adverse childhood experiences for the analytic sample was derived using survey-weighted frequency procedures. Percentages were weighted to account for the stratified, multistage sampling design of the Add Health Study. 24 These analyses were conducted using SAS software statistical package 9.4 (Cary, NC).
Latent class analyses
Latent class analysis (LCA) is a type of statistical model adept at identifying underlying subgroups of individuals (i.e., latent classes) within a sample based on similarities in their response patterns across various characteristics or variables (i.e., class indicators), which ultimately inform the makeup of the latent classes. 43,45 The advantage of LCA over standard regression techniques is that it can efficiently detect and summarize similarities and differences in study participants' response patterns across many variables, especially within larger samples, effectively accounting for heterogeneity in variable relationships within a single population. 43,45 Here, we use LCA to identify subgroups of women in the Add Health sample based on similarities in their self-reported exposure to six adverse childhood experiences.
We conducted all LCA using Mplus Version 8.6 (Muthén & Muthén, 1998–2017). 46 The six ACEs (i.e., class indicators), were used to inform the latent classes (Supplementary Appendix Fig. S2). We fit 2-class, 3-class, and 4-class models by conducting survey-weighted finite mixture analyses with robust maximum likelihood estimation (MLR) to account for the stratified, multistage sampling design of the Add Health study.
The optimal latent class model with the best fit was determined by assessment of the following fit statistics: log-likelihood, Akaike Information Criterion (AIC), Bayesian Information Criterion (BIC), Consistent Akaike Information Criterion (CAIC), Sample Size Adjusted BIC (ssBIC), Integrated Completed Likelihood Criterion with BIC approximation (ICL-BIC), and entropy. Smaller values indicated better model fit for all criteria with the exception of entropy, where values closer to 1.0 indicate better classification separation between the classes (range of values from 0 to 1). 43,47 After identification of the optimal 2-class model, we assessed the class prevalences and the estimated conditional within-class probabilities (i.e., item-response probabilities), or the probability that a woman reported a specific response (e.g., yes/no) to an ACE, given that they were in a specific latent class. 43 The class with the highest prevalence was designated the reference class for all analytic comparisons.
Class prediction analyses
To assess whether race or SES predicted LCM, we implemented Vermunt's three-step approach using Mplus 8.6. 48 This approach provides us with coefficients for the regression of latent class on the predictors of race and SES, as well as the odds ratios for LCM by race and SES. Supplementary Appendix Figure S3 illustrates the path diagram for the class predictor analyses.
Distal outcome analysis
To evaluate whether LCM predicted the distal outcome of PTD (Supplementary Appendix Fig. S4 for the path diagram for the model), we again conducted Vermunt's three-step approach using Mplus 8.6. 48,49 Although PTD is a binary variable and cannot generate a mean, it has a threshold, which is an estimated parameter in the form of a logit derived from the third step of Vermunt's that is used to calculate the within-class probability of having the outcome (i.e., PTD). 49 Equation 1 shows how to calculate the probability of reporting a “yes” response to an ACE based on the threshold parameter estimate (Bauer and Steinley, 2020, p. 7.4): 49

where δjk is the probability of reporting “yes” for an individual in class k, and vjk is the threshold parameter estimate (Bauer and Steinley, 2020, p. 7.4) 49
Results
Descriptive analyses
Table 1 outlines the prevalence of maternal characteristics, PTD, and ACEs in the analytic sample (N = 3,884). Most women were White (68.7%), from middle SES backgrounds (61.1%), and married or cohabiting (75.7%). The ACE with the highest prevalence was emotional abuse (47.7%), followed by neglect (42.3%), physical abuse (20.2%), sexual abuse (6.3%), family member suicide attempt or death (6.1%), and foster care placement (2.7%). The prevalence of PTD was ∼12%.
Descriptive Characteristics of the Analytic Sample in the National Longitudinal Study of Adolescent to Adult Health, 1994–2018 (N = 3,884)
Percentages are survey-weighted to account for stratified sampling design of Add Health.
n = 324 women with missing data on marital status.
n = 198 women with missing data on maternal age.
n = 117 women with missing data on any ACEs; ACEs are not mutually exclusive categories.
ACE, adverse childhood experience.
Latent class analyses
Supplementary Appendix Table S4 provides a summary of the fit statistics for the 2-class, 3-class, and 4-class model. The 2-class model was determined to be the optimal class model with the best fit based on the smaller values for the majority of the fit indices (BIC, CAIC, ssBIC, ICL-BIC) compared with the 3-class and 4-class model.
Figure 2 illustrates the probability of reporting “yes” to the six ACEs, conditional on LCM. Supplementary Appendix Table S5 shows the estimated class prevalence and conditional within-class probabilities of six ACEs for the two latent class models. The class prevalence indicated that latent class 1 comprised 75.1% of the sample, whereas latent class 2 comprised 24.9% of the sample (Supplementary Appendix Table S5). Class 2 was distinguished by significantly higher conditional probabilities of reporting sexual abuse (0.21), emotional abuse (1.0), physical abuse (0.70), and foster care placement (0.05) compared with Class 1 (p < 0.05, respectively). There were no significant differences in the conditional within-class probabilities for neglect or suicide. For this reason, we labeled Class 2 as the “High ACEs” class, whereas Class 1 was labeled the “Low ACEs” class.
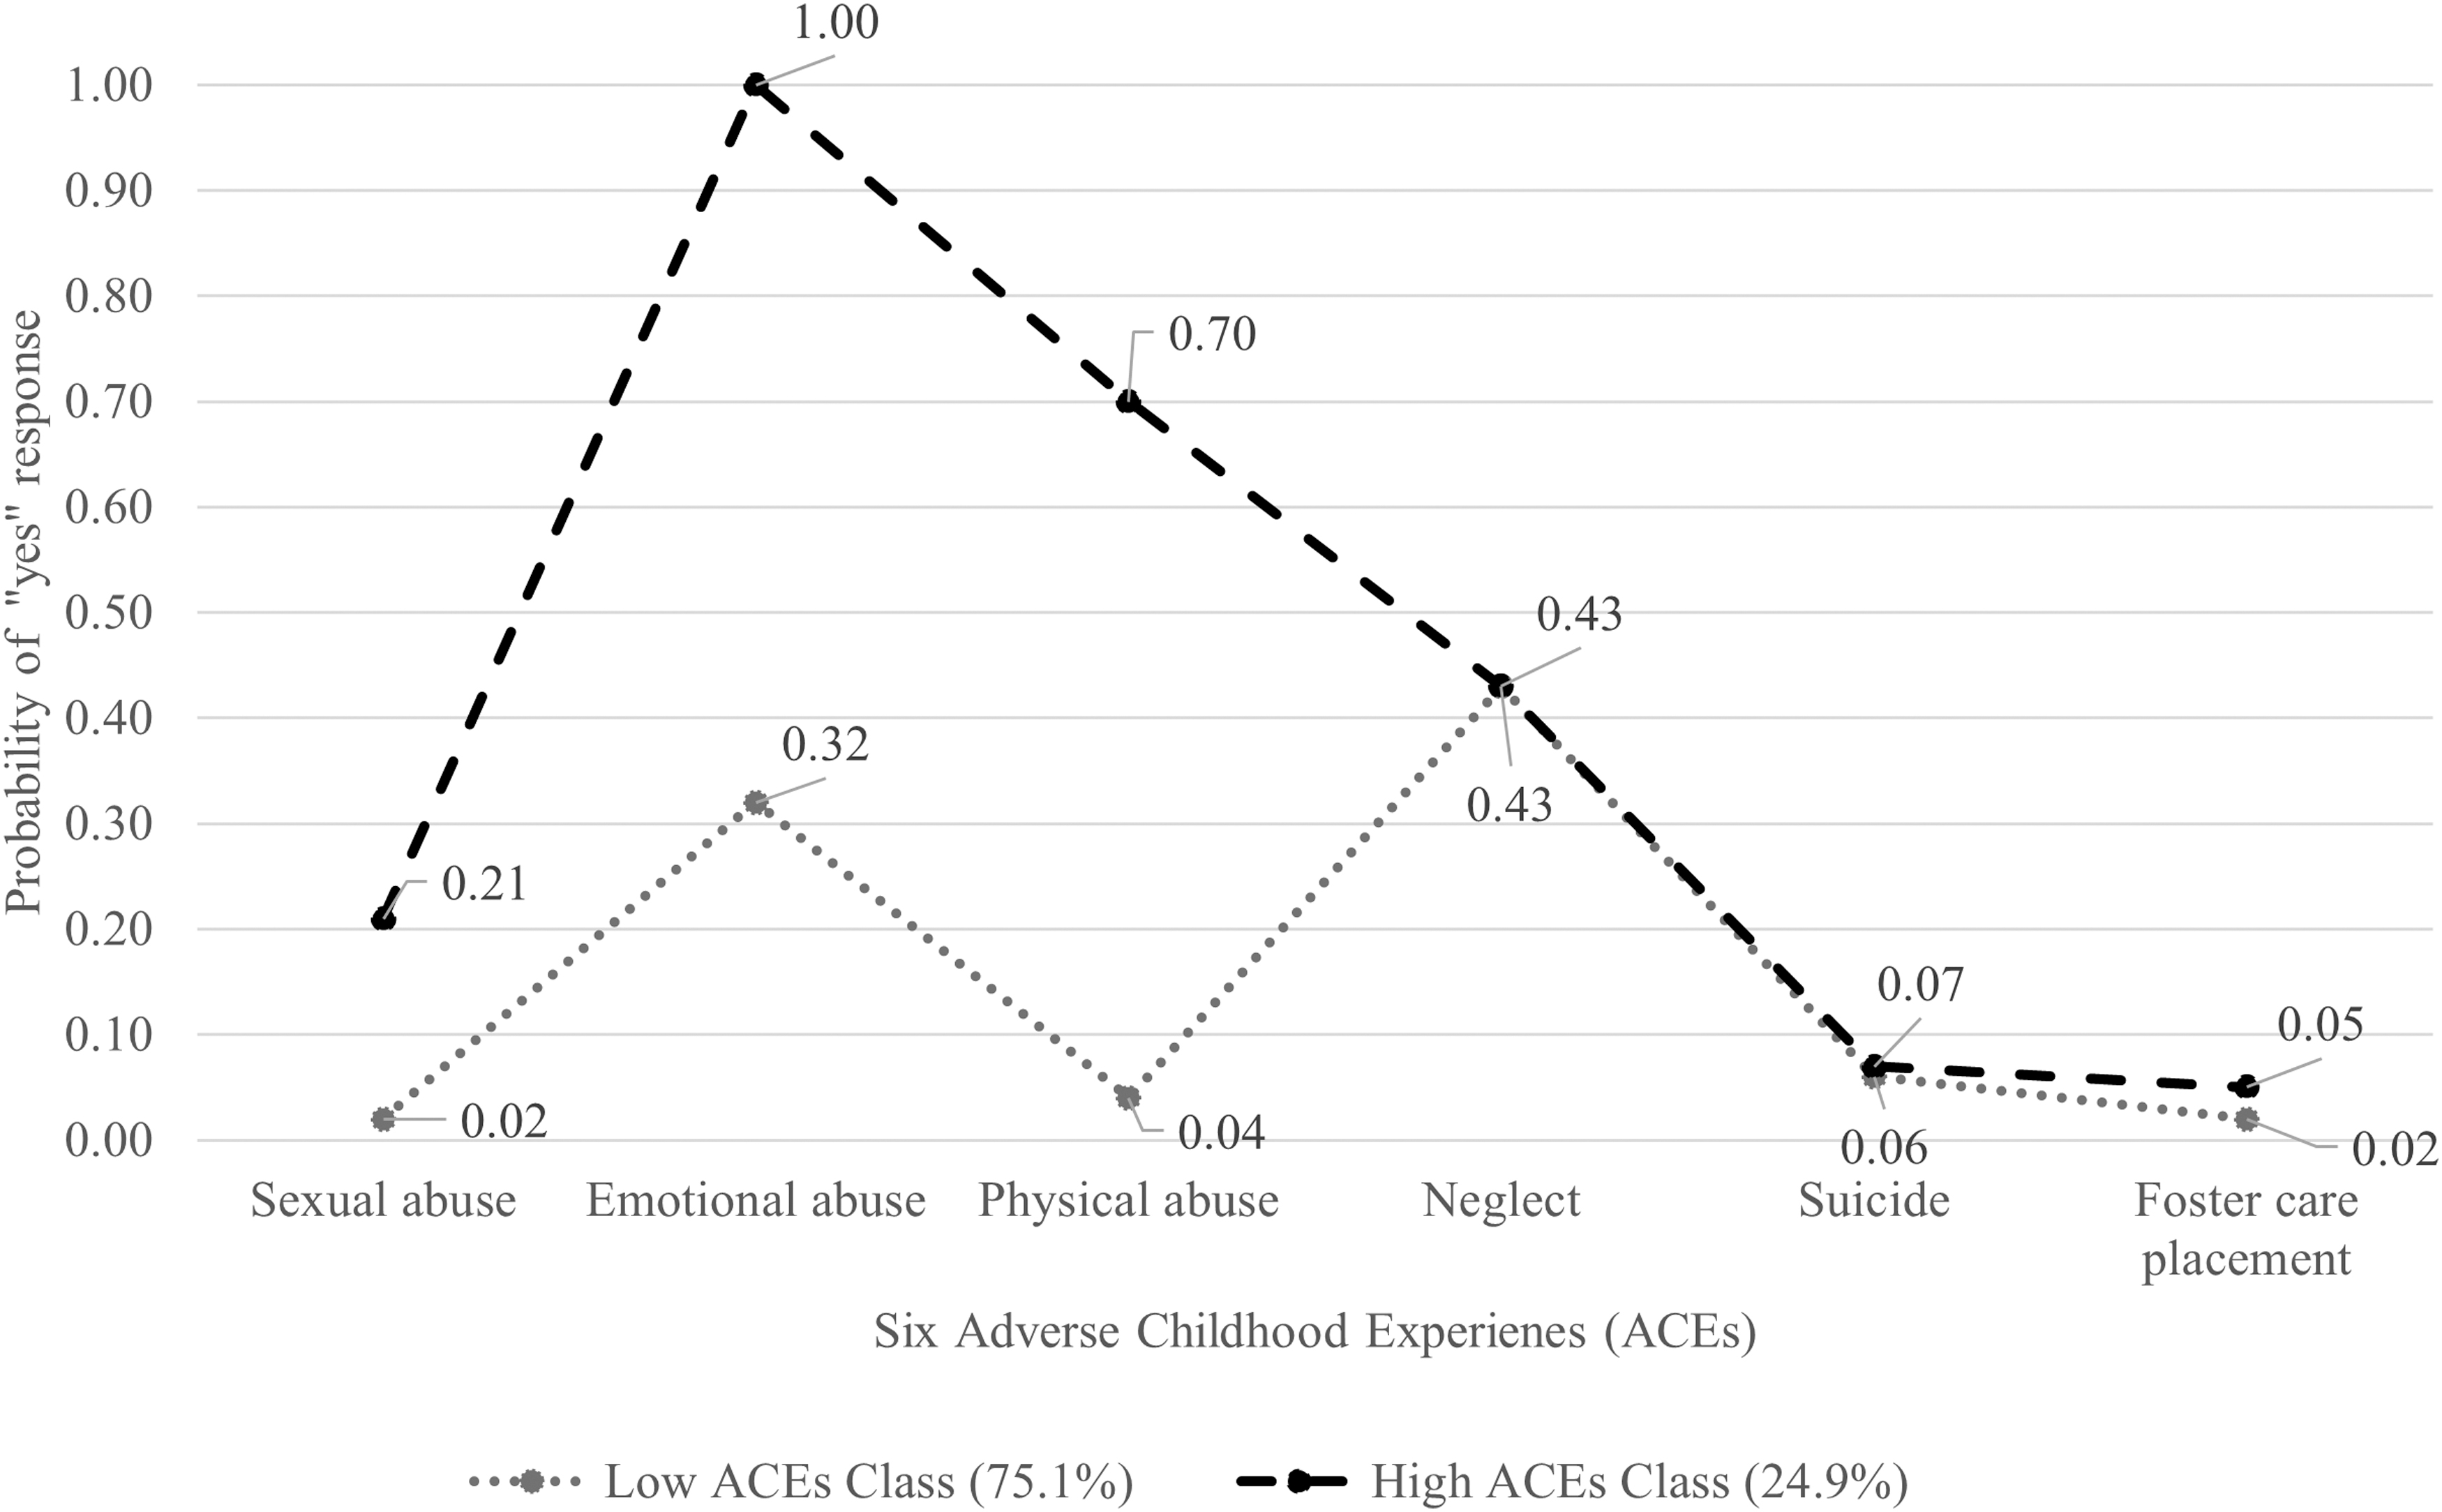
Probability of reporting “yes” to six ACEs conditional on latent class membership among N = 3,884 women in the National Longitudinal Study of Adolescent to Adult Health (1994–2018).
Class prediction analyses
The logits for the classification probabilities, which accounts for the level of misclassification error, 49 for the 2-class model derived from Vermunt's three-step approach for the class predictor analyses are given in Supplementary Appendix Table S6. Using Equation 1 to calculate the probability based on the logit values, these findings convey that the probability of being assigned to the low ACEs class, given that the participant is actually in the low ACEs class, is high (0.98), and the probability of being assigned to the low ACEs class, given that the participant is actually in the high ACEs class, is low (0.25), reflecting relatively good reliability for the modal class assignment process and good class separation. Table 2 presents the findings for the class prediction analyses derived from the final step of Vermunt's three-step approach. The odds of being in the high ACEs class compared with the low ACEs class did not differ by race or SES (i.e., all 95% CIs include the null value for each group, respectively; Table 2).
Estimated Odds Ratios for the Prediction of Latent Class Membership by Race and Socioeconomic Status Subgroups Among N = 3,884 Women in the National Longitudinal Study of Adolescent to Adult Health, 1994–2018
Odds of class membership for Class 2 (High ACEs Class) compared with the reference of Class 1 (Low ACEs Class); ORs for race subgroups are adjusted for SES and ORs for SES subgroups are adjusted for race.
Distal outcomes analysis
Table 3 shows that the threshold estimates for PTD do not differ significantly across the low ACEs class and the high ACEs class for either the unadjusted or adjusted models, as demonstrated by the Wald Test of parameter constraints (p = 1.00; p = 0.99, respectively). These findings suggest that LCM is not associated with PTD.
Threshold Estimates for Preterm Delivery by Latent Class in the Distal Outcomes Analysis Among N = 3,884 Women in the National Longitudinal Study of Adolescent to Adult Health, 1994–2018
Wald Test for statistically significant differences in threshold estimates for PTD by latent class.
Adjusted for race and SES.
Stratified analyses
Table 4 shows that the threshold estimates for PTD did not differ significantly across the high ACEs or low ACEs class in the race-stratified models (p-values all >0.05, respectively) except for women who identified as Other (p < 0.001). Among these women who identified as Other, the probability of PTD in the low ACEs class was significantly higher than the probability of PTD in the high ACEs class (0.25 vs. 0.03, respectively).
Race and Socioeconomic Status-Stratified Distal Outcomes Analyses for Preterm Delivery by Latent Class Among N = 3,884 Women in the National Longitudinal Study of Adolescent to Adult Health, 1994–2018
Race-stratified analyses are adjusted for SES; SES-stratified analyses are adjusted for race.
Wald test for statistically significant differences in threshold estimates for PTD by latent class
Refers to women who self-reported as “Other” in the Add Health Survey.
Values in bold indicate statistical significance at p < 0.05.
AI/AN, American Indian or Alaska Native.
In the SES-stratified models, the threshold estimates for PTD differed significantly between the low ACEs class and the high ACEs class for low SES women only (p < 0.04), whereby low SES women in the low ACEs class experienced a higher probability of PTD compared with low SES women in the high ACEs class (0.17 vs. 0.05, respectively; Table 4). The threshold estimates for PTD did not differ significantly across the latent classes for middle SES or high SES women (p > 0.05, Table 4).
Discussion
Our study examining patterns of ACEs and PTD in a longitudinal sample from the Add Health Study point to the following key findings. First, two underlying latent classes of women with ACE exposure were identified, with women in the high ACEs class characterized by a higher probability of emotional abuse, physical abuse, sexual abuse, and foster care placement compared with the low ACEs class. Second, race and SES did not predict LCM. Third, LCM did not predict PTD, suggesting that co-occurring patterns of ACEs are not associated with PTD. Fourth, the relationship between LCM and PTD did not differ significantly for the majority of race and SES subgroups.
These findings differ from prior research showing that ACE prevalence differs by race and SES 50 and with Koning and Ehrenthal (2019), 51 who found racial and socioeconomic differences in the makeup of subgroups of women based on ACE exposure; however, this was based on experience of life stressors in the year before childbirth and not adverse childhood experiences specifically. 51 Moreover, our findings are discrepant with the overall key conclusion of the systematic review by Sulaiman et al., which stated that ACEs are positively associated with the occurrence of preterm birth. 11 However, although our findings are discrepant with the positive findings of three of the four U.S.-based studies included in this review, 52 –54 our findings concur with the null findings reported by the fourth U.S.-based study in that review, 18 as well as with recent findings by Swedo et al. 17
There are several methodological factors that may explain the discrepancies in findings between our study and those found in the literature. The majority of studies identified in the systematic review by Sulaiman et al. assessed ACEs during pregnancy or postpartum. 11 This could have resulted in recall bias, as women who experience pregnancy complications may be more likely to overreport stressful maternal life events or adverse health indicators during pregnancy or postpartum. Furthermore, all four U.S-based studies assessed in Sulaiman et al. used comparatively smaller sample sizes (n = 96, 53 n = 398, 18 n = 1,848, 52 n = 2,30354 participants) and study samples with little geographic, racial, or socioeconomic variability that could have skewed findings. 11 Of note, Swedo et al. assessed ACEs in a large sample of postpartum women (n = 14,510) and observed null findings across multiple adverse birth outcomes including PTD, low birth weight, and small and large-for-gestational age. 17
Our study, using data from a large, representative sample along with methods that may more appropriately capture the complexities in ACE exposure, further underscores the equivocal nature of the evidence linking ACEs and PTD.
Although Swedo et al. observed a null association between ACEs and PTD, they did find associations with unwanted pregnancy, which concurs with previous studies. 10,15 This suggests that women who experience high levels of ACEs may be more likely to (1) have an unintended pregnancy, 10,15,17 which might lead to the decision to have an abortion; (2) experience a pregnancy loss 51 ; (3) decide not to have children 42 ; or (4) have difficulties becoming pregnant because of physical trauma (e.g., physical and/or sexual abuse) or other health conditions (e.g.., depression, anxiety) and therefore may not be captured in our denominator of women who have pregnancies that end in a live birth. This, in turn, might result in selection bias that underestimates the association between ACEs and PTD across studies to date.
Furthermore, it is possible that the window of time between when ACEs occur and when pregnancy occurs is not long enough for the physiological disruptions potentially caused by early life stress to manifest on health outcomes. 38 As most women in our study are of young maternal age (20–29 years), this is plausible. Alternatively, if women experience stressors early in childhood, there may be a potential for a resetting or “recalibration” of any stress-induced physiological disruptions during adolescence, especially if protective factors are encountered that make up for the early risk factors. 55 –57 Relatedly, there may be a process of resilience at play whereby women who experience stressors may not go on to have adverse perinatal health outcomes owing to some protective factor that may buffer against the risks of stressors like ACEs on PTD. Indeed, studies have shown that factors such as social support are protective against the effects of life stressors on the risk of PTD. 58 –61
Finally, it is possible that ACEs do not impact PTD in hypothesized ways. Although the stressor hypotheses have been proposed as an explanatory mechanism for PTD disparities, the evidence is not clear. 62 –66 Indeed, this explanation has important implications for the resilience of a human pregnancy to adapt and withstand life stressors, a phenomenon that likely developed to promote evolutionary survival.
Strengths and limitations
We used a large, longitudinal dataset with data spanning over 20 years and provided data on many adverse childhood experiences. Second, our study design incorporated a health equity approach by assessing whether disparities in the exposure–outcome relationship existed within race and SES subgroups rather than assuming that ACEs affect all women equally. Another way we incorporated health equity is by including seven categories of race to increase representation of commonly underrepresented groups of women. Furthermore, our research questions were informed by a lifecourse framework, which emphasizes the importance of women's health not just during the prenatal period, but during the preconception period as well. 6,67,68 Finally, we used latent class modeling as a person-based methodological approach to determine whether co-occurring patterns of ACEs are important predictors for PTD, instead of the common methodological approach of using a sum or count of ACEs, which fails to account for potential interaction of risks among women.
Despite these strengths, this study entailed several limitations. Although we took advantage of a large, nationally representative dataset, there were small sample sizes for specific racial subgroups of women. However, given that Add Health is a uniquely large, diverse nationally representative dataset with fives waves of data follow-up that incorporates data on health outcomes from childhood through adulthood, this illustrates the lack of data on groups of people identifying as Black, Hispanic, Asian, Pacific Islander, and American Indian and Alaska Native who have pregnancies in prospective studies that can be used to understand the impacts of early life experiences on pregnancy outcomes.
Future directions
In light of our findings, future research should assess the potential role of selection bias when analyzing the impact of ACEs on the probability of having a live birth. Furthermore, future studies can investigate the role of resilience among women who experience ACEs yet do not go on to experience PTD and explore potential protective factors that may mitigate any health impacts of adverse childhood experiences on PTD.
Conclusions
In this study, we found that LCM based on ACE patterns did not predict PTD, and that race and SES, for the most part, did not significantly influence LCM or the relationship between LCM and PTD. Our findings suggest ACEs may not exert their impacts in previously hypothesized ways on the risk of PTD.
Footnotes
Authors' Contribution
Y.Z.-H.: Conceptualization, Methodology, Project administration, Formal Analysis, Investigation, Writing—Original Draft, Writing—Review and Editing, Visualization, Funding Acquisition; A.B.: Conceptualization, Methodology, Validation, Formal Analysis, Writing—Review and Editing, Supervision; N.T.: Conceptualization, Methodology, Writing—Review and Editing; J.S.-A.: Conceptualization, Methodology, Writing—Review and Editing; C.M.: Conceptualization, Methodology, Resources, Writing—Review and Editing, Supervision, Funding acquisition.
Funding Information
This study was supported in part by funding from dissertation fellowship awards from the Michigan State University Graduate School and the Women's and Gender Studies Program at Michigan State University, and graduate assistantship awards under Dr. Claire Margerison at Michigan State University.
This research uses data from Add Health, funded by grant P01 HD31921 (Harris) from the Eunice Kennedy Shriver National Institute of Child Health and Human Development (NICHD), with cooperative funding from 23 other federal agencies and foundations. Add Health is currently directed by Robert A. Hummer and funded by the National Institute on Aging cooperative agreements U01 AG071448 (Hummer) and U01AG071450 (Aiello and Hummer) at the University of North Carolina at Chapel Hill. Add Health was designed by J. Richard Udry, Peter S. Bearman, and Kathleen Mullan Harris at the University of North Carolina at Chapel Hill.
Author Disclosure Statement
No competing financial interests exist.
Supplementary Material
Supplementary Appendix Table S1
Supplementary Appendix Table S2
Supplementary Appendix Table S3
Supplementary Appendix Table S4
Supplementary Appendix Table S5
Supplementary Appendix Table S6
Supplementary Appendix Figure S1
Supplementary Appendix Figure S2
Supplementary Appendix Figure S3
Supplementary Appendix Figure S4
References
Supplementary Material
Please find the following supplemental material available below.
For Open Access articles published under a Creative Commons License, all supplemental material carries the same license as the article it is associated with.
For non-Open Access articles published, all supplemental material carries a non-exclusive license, and permission requests for re-use of supplemental material or any part of supplemental material shall be sent directly to the copyright owner as specified in the copyright notice associated with the article.
