




Abstract
Background:
Missing race/ethnicity data are common in many surveillance systems and registries, which may limit complete and accurate assessments of racial and ethnic disparities. Centers for Disease Control and Prevention's National Assisted Reproductive Technology (ART) Surveillance System (NASS) has a congressional mandate to collect data on all ART cycles performed by fertility clinics in the United States and provides valuable information on ART utilization and treatment outcomes. However, race/ethnicity data are missing for many ART cycles in NASS.
Materials and Methods:
We multiply imputed missing race/ethnicity data using variables from NASS and additional zip code-level race/ethnicity information in U.S. Census data. To evaluate imputed data quality, we generated training data by imposing missing values on known race/ethnicity under missing at random assumption, imputed, and examined the relationship between race/ethnicity and the rate of stillbirth per pregnancy.
Results:
The distribution of imputed race/ethnicity was comparable to the reported one with the largest difference of 0.53% for non-Hispanic Asian. Our imputation procedure was well calibrated and correctly identified that 89.91% (standard error = 0.18) of known race/ethnicity values on average in training data. Compared to complete-case analysis, using multiply imputed data reduced bias of parameter estimates (the range of bias for stillbirth per pregnancy across race/ethnicity groups is 0.02%–0.18% for imputed data analysis, versus 0.04%–0.66% for complete-case analysis) and yielded narrower confidence intervals.
Conclusions:
Our results underscore the importance of collecting complete race/ethnicity information for ART surveillance. However, when the missingness exists, multiply imputed race/ethnicity can improve the accuracy and precision of health outcomes estimated across racial/ethnic groups.
Introduction
Numerous studies have documented racial/ethnic differences in assisted reproductive technology (ART) utilization and outcomes in the United States. 1 –7 ART utilization rates are lower among non-Hispanic (NH) Black, Hispanic, and American Indian/Alaska Native women. 1,2 Moreover, NH Black, Hispanic, and NH Asian women have lower live birth rates following ART compared to NH White women, even after adjusting for covariates such as age, body mass index (BMI), cause of infertility, and number of embryos transferred. 3,4 Other studies have documented racial/ethnic differences in perinatal outcomes of ART treatments, including increased risk of low birthweight and preterm birth. 5,7 However, one common limitation of these studies is the large percentage of missing information on race/ethnicity, which may unfavorably impact analysis to obtain valid statistical inferences. 8
Missing race/ethnicity is common in many national surveillance systems and registries. The degree of missingness varies across data sources. 9,10 Long et al. reported a range of race/ethnicity missingness from 9% to 45% in Veterans Health Administration registry and survey data based on published articles. 9 Centers for Disease Control and Prevention's (CDC) National ART Surveillance System (NASS) is not immune from missing race/ethnicity information with race/ethnicity missingness over 30%. 1,6 Missing race/ethnicity information for ART patients limits complete and accurate reporting of racial and ethnic differences in ART access and treatment outcomes.
Traditional complete-case analysis that relies only on subjects without missing race/ethnicity may result in biased estimates because the missing completely at random assumption, that is, the assumption that missing race/ethnicity does not depend on any observed and unobserved data, is commonly violated. 8 Moreover, removing subjects with missing race/ethnicity may also decrease statistical testing power because of the reduced sample size. 11 Therefore, it is necessary to consider different approaches to address race/ethnicity missingness to obtain valid statistical inferences. Multiple imputation (MI) has been proposed as a possible statistical tool to address missing data explicitly and to obtain valid statistical inferences. 12,13 Under the missing at random assumption (MAR), that is, the assumption that missing race/ethnicity only depends on observed data, MI methods impute missing race/ethnicity values using observed variables that are associated with race/ethnicity. 8
MI generates multiple datasets to reflect the added uncertainty of the missing data, but because all subjects are included in each replicated dataset, the statistical power to detect significant differences generally increases.
11
Each dataset is analyzed separately, and final estimates are obtained using common combination rules.
14
MI techniques have been widely used in many applications,
15,16
and they can be implemented with common statistical software (e.g., SAS [SAS Institute, Inc., Carry NC], STATA [StataCorp LLC., College Station TX], SUDAAN [RTI International, Research Triangle NC], R [The Free Software Foundation;
The objective of this study is to multiply impute race/ethnicity under MAR assumption in NASS and evaluate the operating characteristics of estimates including the similarity of distributions, correctly predicted values, and bias of estimated associations between race/ethnicity and ART treatment outcomes that rely on multiply imputed data. 17 –19
Materials and Methods
Data sources
Our study comprised data from NASS version 2.0 collected from January 1, 2016, through December 31, 2018, which include information on patient demographics, obstetrical and medical history, parental infertility diagnosis, clinical parameters of the ART procedure, and information regarding resultant pregnancies and births. 20 Clinics report patient race as binary information for White, Black or African American, Asian, Native Hawaiian or other Pacific Islander, and American Indian or Alaska Native. Patient ethnicity is reported as Hispanic or NH. Using these variables, we constructed a race/ethnicity categorical variable with seven mutually exclusive groups: NH White, NH Black, NH Asian, Hispanic, NH Native Hawaiian or other Pacific Islander, NH American Indian or Alaska Native, and two or more races (when more than one race is selected). 21 Race/ethnicity was considered missing if either race or ethnicity was missing. Most patients with missing race/ethnicity (∼98%) had both race and ethnicity missing.
According to the Fertility Clinic Success Rate and Certification Act of 1992 (Public Law No.102-493, October 24, 1992), all U.S. fertility clinics that perform ART are required to report information about each ART cycle to the CDC every year. 22 NASS is a deidentified national database, in which every observation represents a cycle, and one patient can have multiple cycles. As a result, patients may have different values for their reported race/ethnicity across cycles. To obtain consistent imputed race/ethnicity values across cycles from the same patient, we imputed race/ethnicity at the patient level.
To improve the imputation model, we linked the U.S. Census (2010) zip code-level population distributions for each of the seven race/ethnicity categories 23 to NASS data through patient's residential zip code.
Imputation variables
It is generally recommended to use as many variables as possible to predict imputed values. 24 In this effort, all variables were transformed to patient level. We used the values of the following variables as they were reported earliest, that is, either at the time of the patient's first cycle or the successive cycle(s) if they were not reported at the first cycle: patient's race/ethnicity, patient's and partner's age, patient's weight and height (which were used to compute patient's BMI), any prior pregnancies (yes/no), number of prior pregnancies, number of prior births, and number of prior ART cycles. We converted the following cycle-level binary variables to a single indicator variable if it was reported for any cycle: infertility diagnoses, smoking before treatment, intracytoplasmic sperm injection (ICSI), oocyte/embryo banking, preimplantation genetic testing (PGT), and stillbirth.
Partner's race was used if it was ever reported; otherwise, if donor sperm was used, we recorded the donor's race. For the following variables, we used the largest value ever reported: number of eggs retrieved, number of embryos transferred, infant birthweight, and number of infants born. Pregnancy outcome was consolidated across cycles using the following hierarchy: multiple birth, singleton birth, miscarriage, transferred but results unknown, not transferred, egg/embryo banking or transfer unknown. Cycle outcome was consolidated based on the following hierarchy: term birth (≥37 weeks), late preterm birth (32–36 weeks), early preterm birth (28–31 weeks), very early preterm birth (<28 weeks), miscarriage, not pregnant, and no transfer.
To build the imputation model, we selected variables for inclusion in the model using the strategy proposed by van Buuren and Groothuis-Oudshoorn. 25 In short, we included variables that could be used to examine associations between race/ethnicity and clinical outcomes. In addition, we included variables that were correlated with either race/ethnicity missingness or reported race/ethnicity. The χ 2 tests were used to identify variables that are marginally correlated with either race/ethnicity missingness or reported race/ethnicity. Variables that are significantly associated with the race/ethnicity missingness or reported race/ethnicity (with p-values <0.0001) were included as predictors in the imputation model.
Variables with missingness above 45% were excluded from the imputation procedure. This strategy resulted in 32 variables that were included in the imputation model. As suggested by Silva et al., 19 we also included nine additional variables in the imputation model: patients' resident state as well as the 2010 U.S. Census reported proportions of Whites, Blacks, Asians, Latinos, Native Hawaiian/other Pacific Islanders, American Indians/Alaska Natives, other race, and mixed race in the patients' zip code.
Imputation procedures
The MI models were implemented using SAS' Proc MI with the fully conditional specification (FCS) procedure (SAS Institute, Inc., 2015). Besides race/ethnicity, the following covariates also had a high proportion of missing values: BMI (14.63%), smoking before treatment (11.05%), sperm source (24.38%), sperm source race/ethnicity (27.67%), partner age in years (39.23%), ICSI (17.73%), and PGT (10.08%). FCS procedure can impute missing values for race/ethnicity as well as covariates listed above simultaneously. The discriminant function method (a generalization of Fisher's linear discriminant method 26 ) was used for imputing nominal categorical variables, and linear regression models were used to impute continuous variables. 27 To address the possibility that some of the conditional models for missing variables are complex, we supplemented the imputation models with all two-way interactions between the selected 32 variables that were significantly associated with race/ethnicity (with p-values <0.05).
Each missing variable was imputed 20 times, resulting in 20 complete datasets. After imputation of the missing data, we compared the race/ethnicity distributions of complete-case or only reported race/ethnicity data (denoted as dataset R), imputed race/ethnicity data (denoted as dataset I), and reported and imputed race/ethnicity data (denoted as dataset R+I).
Imputed data evaluation
To evaluate the performance of the race/ethnicity imputation procedure, we created a patient-level training dataset with nearly complete race/ethnicity data. The race/ethnicity missingness varied by clinic and the median race/ethnicity missingness across all 490 ART clinics (total 413,025 patients) in NASS was 11.43% with a range of 0% (no missing) to 100% (all missing). The training dataset included 244 clinics with reported race/ethnicity completeness rates above 88.57% (i.e., the missingness <11.43%). These 244 clinics comprised 138,384 patients (33.50% of the total patient population). Of these, 6,182 patients with missing information on race/ethnicity were excluded. This resulted in a final training dataset that comprised 132,202 patients (95.53% of 138,384) with reported race/ethnicity (known race/ethnicity data, denoted as dataset Kt, where superscript “t” denotes training data).
Next, to mimic the missingness pattern of the original NASS dataset, we removed race/ethnicity information for ∼32% of the patients in the training dataset (complete-case data). The process to sample a training dataset was repeated 50 times. For each of the 50 replications, selection of patients with removed race/ethnicity was based on a model for the probability of missing race/ethnicity developed in the original data, assuming MAR missingness.
Formally, let Mi
be an indicator that is equal to 1 if race/ethnicity is missing for patient i and it is equal to 0 otherwise. In addition, let Xi
be the vector of all the covariates used in the imputation model for patient i. We estimated 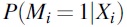 using a logistic regression model logit
  , where
  and
and  are a set of unknown parameters. For patient i, we estimated the predicted probability of missing race/ethnicity based on the maximum likelihood estimates of
  and
and  , and using these estimates, we calculated
 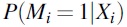 , and independently sampled Mi
from a Bernoulli distribution with probability
, and independently sampled Mi
from a Bernoulli distribution with probability 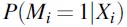 to decide if an individual had missing race/ethnicity. This resulted in an average of 42,450 patients (32.10% of 132,202) across the 50 replications that were sampled to have missing race/ethnicity information
  . Within each of the 50 replications, the fully conditional imputation algorithm was used to generate plausible values for the imposed missing race/ethnicity values (denoted as dataset It).
To examine the calibration of the imputation procedure under MAR, race/ethnicity distributions were compared between the training dataset where reported missing race/ethnicity values were artificially imposed and then imputed (denoted as dataset R + It) and the known race/ethnicity values (dataset Kt).
We also evaluated the performance of the imputed data in an analysis of stillbirth rates by race/ethnicity. For this analysis, we used a subsample of the training dataset with cycles that resulted in pregnancy. Following a similar procedure adopted by Zhang et al., 28 in which the evaluation process was replicated 50 times, for each replicate, 20 imputations were conducted. Within each replicate, we compared the estimates of stillbirths per pregnancy as well as risk ratios using a logistic regression model, in which race/ethnicity was the independent variable. We implemented this analysis with the SUDAAN's PROC RLOGISTIC under the adjusted risk ratio option, where NH White is the reference for each racial/ethnic group.
The analysis was performed on the known race/ethnicity data (denoted as dataset Kct, where superscript “ct” denotes pregnant cycles in training data), only reported race/ethnicity data with artificially imposed missing values excluded (denoted as dataset Rct), imputed race/ethnicity data (denoted as dataset Ict), and reported and imputed race/ethnicity data (denoted as dataset R + Ict). The known race/ethnicity data (dataset Kct) were used as the gold standard. We used SUDAAN'S option MI_COUNT = 20 in PROC statement to obtain combined estimates across 20 imputed datasets in each replicate, and averaged the point estimates, standard errors (SE), and the upper and lower 95% confidence bounds across the 50 replicates.
In addition, we conducted a sensitivity analysis to assess the impacts of possible violation of the MAR assumption on the quality of imputed data. In this sensitivity analysis, we excluded the variable stillbirth from the imputation model and examined the possible biases when estimating the associations between stillbirth and race/ethnicity.
Results
Missing data pattern by year
Figure 1 shows that the average proportion of patient-level race/ethnicity missingness in NASS across the years was 36.0%, varying from 42.2% in 2004 to 32.1% in 2018.

Trends in the proportions of patients with missing race/ethnicity in the U.S. National Assisted Reproductive Technology Surveillance System, 2004–2018.
Imputed and observed race/ethnicity distribution
The associations between race/ethnicity groups as well as the missingness indicator and the covariates used in the imputation model are depicted in Table 1. All associations were statistically significant (p < 0.0001).
Patient and Cycle Characteristics by Patient Race/Ethnicity, U.S. National Assisted Reproductive Technology Surveillance System, 2016–2018
Chi-squared tests for race/ethnicity and all variables listed in the table were significant with p-value <0.0001.
Infertility diagnosis categories are not mutually exclusive.
ART, assisted reproductive technology; BMI, body mass index; ICSI, intracytoplasmic sperm injection; PCOS, polycystic ovary syndrome.
Table 2 compares distributions of patient race/ethnicity between three datasets in full NASS data: dataset R for only reported data with 34.70% missing race/ethnicity excluded (complete-case analysis), dataset I for imputed race/ethnicity data, and dataset R + I for reported and imputed race/ethnicity data. The differences in proportions of race/ethnicity between patients in dataset R and patients in dataset I ranged from 0.15% to 1.52%. We then compared the racial/ethnic distributions between dataset R and dataset R+I, and differences were smaller, ranging from 0.05% to 0.53%. In both comparisons, the largest differences were observed for NH Asian (1.52% and 0.53%, respectively) and NH White patients (0.83% and 0.29%, respectively).
Distribution of Patient Race/Ethnicity Before and After Multiple Imputation, National Assisted Reproductive Technology Surveillance System, 2016 to 2018
Records with missing race/ethnicity (34.70%) excluded (complete-case analysis).
Results obtained using 20 replicates.
CI, confidence interval.
Evaluation of imputed race/ethnicity
Table 3 describes the results of our model validation analysis using training data: dataset Kt for known race/ethnicity data, dataset Rt for only reported race/ethnicity data with artificially imposed missing values excluded (complete-case analysis), dataset It for imputed race/ethnicity data, and dataset R + It for reported and imputed race/ethnicity data, where superscript “t” denotes training data. Differences in race/ethnicity proportions between dataset Kt (known race/ethnicity in training data) and dataset Rt (only reported race/ethnicity in training data) ranged from 0.0% to 2.03% (averaged across 50 replicates). The largest differences were observed for patients who were NH White (2.03%) and NH Asian (1.70%). Differences in race/ethnicity proportions between dataset Kt (known race/ethnicity in training data) and dataset It (imputed race/ethnicity in training data) ranged from 0.01% (SE = 0.05) to 1.06% (SE = 0.29) (averaged across 50 replicates).
Validation of Race/Ethnicity Distribution Before and After Multiple Imputation Using Training Dataset Obtained from 244 Clinics with Less Than 11% Missingness (a Total of 50 Replicates Performed and Each Replicate Used 20 Imputed Datasets)
Each patient in the training dataset Kt has known race/ethnicity and superscript “t” denoting training data.
Race/ethnicity of average 32% of patients in the training data was imposed as missing and in dataset Rt patients whose race/ethnicity was imposed as missing were excluded (complete-case analysis).
Race/ethnicity of average 32% of patients in the training data It was imposed as missing and then imputed.
Results obtained using 50 replicates and each replicate used 20 imputed datasets.
The largest differences were observed for patients who were NH White (1.06%) and two or more races (0.66%). Differences in race/ethnicity proportions between dataset Kt (known race/ethnicity in training data) and dataset R + It (reported and imputed race/ethnicity in training data) ranged from 0.01% (SE = 0.02) to 1.10% (SE = 0.05) (averaged across 50 replicates). The largest differences were observed for patients who were NH Asian (1.10%) and NH White (0.95%).
The average proportion of correctly imputed race/ethnicity values compared to the known race/ethnicity values across 50 replicates and 20 imputed datasets was 89.91% (range 89.23%–90.62%) across all race/ethnicity groups, 94.76% (range 94.33%–95.20%) for NH White, 90.78% (range 89.57%–91.88%) for NH Black, 82.13% (range 80.95%–83.50%) for NH Asian, 80.97% (range 79.45%–82.50%) for Hispanic, 33.28% (range 22.39%–45.23%) for NH Native Hawaiian or other Pacific Islander, 75.37% (range 71.33%–81.12%) for NH American Indian or Alaska Native, and 40.03% (range 33.21%–49.94%) for two or more races.
Table 4 describes the results of our analysis of stillbirth rates (averaged across 50 replicates) by race/ethnicity in the subgroup of the training dataset with 80,068 cycles that resulted in pregnancy for 4 datasets: dataset Kct for known cycle race/ethnicity data, dataset Rct for only reported cycle race/ethnicity data with artificially imposed missing values excluded (complete-case analysis), dataset Ict for imputed cycle race/ethnicity data, and dataset R + Ict for reported and imputed cycle race/ethnicity data. The superscript “ct” denotes pregnant cycles obtained from patients in training data. The largest differences in stillbirth rates between dataset Kct and dataset Rct (52,038 cycles) were observed for Native Hawaiian or other Pacific Islander (2.35% vs. 1.69%, respectively), and American Indian or Alaska Native (0.52% vs. 0.17%, respectively).
Stillbirth Rates per Pregnancy and Risk Ratios by Race/Ethnicity Before and After Multiple Imputation Using Training Dataset with Cycles Resulting in Pregnancy Obtained from 244 Clinics with Less Than 11% Missingness (a Total of 50 Replicates Performed and Each Replicate Used 20 Imputed Datasets)
Each patient in the subsample of training dataset Kct has a known race/ethnicity and superscript “ct” denoting pregnant cycles obtained from patients in training data.
Race/ethnicity of average 32% of patients in the training data was imposed as missing and in dataset Rct pregnant cycles were from patients whose race/ethnicity was imposed as missing were excluded (complete-case analysis).
Race/ethnicity of average 32% of patients in the training data was imposed as missing and then imputed and in dataset Ict pregnant cycles were from patients whose race/ethnicity was imposed as missing and then imputed.
Results obtained using 50 replicates and each replicate used 20 imputed datasets.
Cells with values 1–4 of stillborn infants are suppressed to protect confidentiality.
Imprecise estimates with SE >5.
SE, standard error.
For stillbirth risk ratios, the largest differences were observed for American Indian or Alaska Native (1.00, 95% CI 0.14–7.10 in dataset Kct vs. 2.06, 95% CI 0.29–14.62) and for NH Black (3.34, 95% CI 2.63–4.24 in dataset Kct vs. 3.88, 95% CI 2.85–5.28 in dataset Rct). In dataset Ict (28,030 cycles), the 3 race/ethnicity groups, Native Hawaiian or other Pacific Islander, American Indian or Alaska Native, and two or more races, have small number of stillbirth cases (between 1 and 4), and were suppressed to protect confidentiality. For other race/ethnicity groups, the largest differences in stillbirth rates between dataset Kct (known cycle race/ethnicity in training data) and dataset Ict (imputed cycle race/ethnicity in training data) were observed for NH Black (1.75% vs. 1.47%, respectively) and NH White (0.52% vs. 0.78%, respectively).
For stillbirth risk ratios, the parameters were imprecisely estimated for three race/ethnicity groups (i.e., Native Hawaiian or other Pacific Islander, American Indian or Alaska Native, and two or more races) because of very small sample sizes and the rarity of the event. For other race/ethnicity groups, the largest differences were observed for NH Black (3.34, 95% CI 2.63–4.24 in dataset Kct vs. 1.89, 95% CI 1.25–2.86 in dataset Ict) and for Hispanic or Latino (1.89, 95% CI 1.46–2.46 in dataset Kct vs. 1.59, 95% CI 1.08–2.35 in dataset Ict). The largest differences in stillbirth rates per pregnancy between dataset Kct (known cycle race/ethnicity in training data) and dataset R + Ict (reported and imputed cycle race/ethnicity data in training data) were observed for NH Black (1.75% vs. 1.57%, respectively) and for the Native Hawaiian or other Pacific Islander group (2.35% vs. 2.50%, respectively).
For stillbirth risk ratios, the largest differences were observed for NH Black (3.34, 95% CI 2.63–4.24, in dataset Kct vs. 2.90, 95% CI 2.27–3.71 in dataset R + Ict) and for two or more races (2.58, 95% CI 1.23–5.43 in dataset Kct vs. 2.24, 95% CI 0.97–5.23 in dataset R + Ict).
Table 4 also demonstrates that the analysis based on dataset R + Ict (reported and imputed cycle race/ethnicity data in training data) generally yielded smaller SE and narrower interval estimates than analysis based only on dataset Rct (only reported cycle race/ethnicity in training data). Furthermore, compared to the analysis based on dataset Kct (known cycle race/ethnicity in training data), the biases for stillbirth per pregnancy across different race/ethnicity groups were generally smaller for dataset R + Ict with a range of 0.02%–0.18% than those obtained for dataset Rct with a range of 0.04%–0.66%, and those obtained for dataset Ict with a range of 0.01%–0.28%. Similarly, the range of biases for the risk ratio of stillbirth per pregnancy for the different race/ethnicity groups was smaller for dataset R + Ict with a range of 0.06–0.44 compared to dataset Rct with a range of 0.04–1.06, and the dataset Ict with a range of 0.25–1.45.
The results from the sensitivity analysis with stillbirth excluded from the imputation model showed larger bias of stillbirth per pregnancy between Kct and R + Ict for NH Native Hawaiian or other Pacific Islander (2.35% vs. 1.27%, respectively), and two or more races (1.35% vs. 0.94%, respectively), compared to the biases observed when stillbirth was included in the imputation model that are displayed in Table 4. Similarly, larger biases of stillbirth risk ratio are observed compared to imputation models that include stillbirth (4.50, 95% CI 1.70–11.93, in dataset Kct vs. 2.33, 95% CI 0.60–9.99 in dataset R + Ict) and (2.58, 95% CI 1.23–5.43, in dataset Kct vs. 1.72, 95% CI 0.71–4.23 in dataset R + Ict).
Discussion
To overcome the large proportion of missing race/ethnicity values in NASS, we used MI to estimate race/ethnicity values. The evaluation and testing of the imputed race/ethnicity information based on a simulated data demonstrated high degree of accuracy and applicability to analysis of ART outcomes. Imputation was performed at the patient level to avoid inconsistencies in race/ethnicity imputation across ART cycles for the same patient, which occurred in previous efforts performed at the cycle level. 1,29 In addition to including NASS variables in the imputation model, we also included zip code-level information on racial/ethnic population distributions from the 2010 U.S. Census data to improve model's performance.
We evaluated the proposed imputation procedure under MAR. Our evaluation showed that this imputation procedure correctly predicted 89.91% of known race/ethnicity values on average across 50 replicates. This is comparable to a similar imputation approach in which the correct prediction rate was ∼81%. 30 The accuracy by race/ethnicity groups showed that imputation of large race/ethnicity groups was more accurate than small race/ethnicity groups, which may increase bias of parameter estimates in small race/ethnicity groups when using imputed data. However, the imputed and observed datasets generally resulted in smaller biases compared to using only the observed data.
In our study, the largest difference across race/ethnicity groups between the observed data and the observed and imputed race/ethnicity data was less than 1% (0.53%). This shows that the distributions of race/ethnicity groups in the observed and the observed and imputed datasets are relatively similar; however, even small differences may influence estimates of certain associations. We examined this by estimating stillbirth rates for each race/ethnicity group using the training data with 32% imposed as missing. Compared to complete-case (only observed) analysis, the observed and imputed race/ethnicity data analysis reduced the bias of estimates of stillbirth rate for each race/ethnicity group except for the NH Black group and yielded narrower confidence intervals (CI). This shows that the analysis using imputed data improves estimates of the association between race/ethnicity and a relevant outcome. These results underscore the importance of collecting complete race/ethnicity information for ART surveillance. However, when missingness exists, using multiply imputed race/ethnicity data has better operating characteristics than complete-case analysis.
This study has several limitations. First, the imputation models and the evaluation method assumed that race/ethnicity is missing at random. If this assumption is violated, the results may be biased in an unknown direction. 31 In NASS data, the proportion of race/ethnicity missingness varies by clinic, with some reporting race/ethnicity information for all patients (0% missingness) and some not reporting race/ethnicity for any patients (100% missingness), which could have violated the assumption of missing at random mechanism. When a variable that is important for the analysis is excluded from the imputation model, one may expect larger bias, as shown in our analysis with stillbirth excluded from the study. Thus, following the general rule of thumb to include as many variables as possible in the imputation model is important to reduce possible biases and make the MAR assumption more plausible. 32
Specifically, it is important to include variables that are associated with the missingness mechanisms, the imputed variables, and variables for possible downstream analyses. Another limitation is that data are collected for each cycle such that imputed race/ethnicity across cycles for the same patient may be inconsistent if imputation was performed at the cycle level. To overcome this limitation and reduce computational burden, we transformed cycle-level variables to patient-level variables. However, it may impede the predictive ability of the model. Future studies could examine if other forms of aggregation and variables improve the imputation procedure. In addition, the clinics in the validation sample may not be representative of all ART clinics because their race/ethnicity missingness was less than the median, suggesting better overall data quality. Thus, our validation results may not be generalizable to patients at all ART clinics.
Moreover, in this study, we grouped patients with one more race reported in the two or more races and further specifying this group into distinct subgroups may help researchers and policymakers to better understand the experiences of the various subgroups within this heterogeneous group.
Conclusions
Multiply imputed race/ethnicity obtained using the proposed procedure under the MAR assumption correctly imputed race/ethnicity for over 89.91% of missing values and generally reduces bias of estimates of stillbirth prevalence compared to complete-case analysis in the validation sample. Generating multiple datasets with imputed race/ethnicity in NASS enables researchers to examine relationships between race/ethnicity and other variables with higher precision and accuracy. Continued efforts aimed at enhancing complete collection of race/ethnicity information, including collecting race/ethnicity at the patient level rather than the cycle level, could improve data quality in public health surveillance systems such as NASS and empower researchers and policymakers with necessary data to document racial and ethnic disparities and promote health equity.
Footnotes
Acknowledgments
The findings and conclusions in this report are those of the authors and do not necessarily represent the official position of the Centers for Disease Control and Prevention or the CDC Foundation.
Authors' Contributions
Y.Z.: Conceptualization, Methodology, Data curation, Formal analysis, and Writing—Original draft.
D.M.K.: Conceptualization and Writing—Review and editing.
K.J.L.: Methodology, Data curation, Formal analysis, Validation, and Writing—Review and editing.
C.D.: Methodology; Formal analysis, Validation, and Writing—Review and editing.
A.K.Y.: Methodology; Validation, and Writing—Review and editing.
R.G.: Conceptualization; Methodology; and Writing—Review and editing.
All authors read and approved the final article.
Ethics Approval
Epidemiological research using NASS data is approved by the Institutional Review Board at the CDC.
Availability of Data and Materials
The datasets generated and/or analyzed during the current study are not publicly available because they are protected under Assurance of Confidentiality.
Author Disclosure Statement
No competing financial interests exist.
Funding Information
Support for this research was provided by Open Philanthropy through a grant to the CDC Foundation.