




Abstract
Introduction:
Similar proportions of women and men have entered medical school since 2003. However, career advancement and promotion for women continues to be fraught with disparities and inequalities. Building on current literature, this study explores the rates of change of female faculty in faculty ranks over the last 10 years to gain a more comprehensive view of the faculty trends of women in academic medicine.
Methods:
Using the Faculty Administrative Management Online User System database, counts by gender and faculty rank at each Association of American Medical Colleges (AAMC) academic medical school were obtained. Statistical analysis was done using generalized estimating equations modeling to assess rates of change for each gender from 2012 to 2021.
Results:
Higher proportions of female faculty are concentrated at the Instructor and Assistant Professor level and lower proportions at the Associate Professor and Professor rank compared to male faculty. Over the study period, female faculty showed increased rate change compared to male faculty of 1.007 (95% confidence interval [CI]: 1.002–1.012) for Associate Professor rank and 1.012 (95% CI: 1.007–1.016) for Professor rank. At the Instructor and Assistant Professor levels, female faculty decreased at a relative rate of 0.980 (95% CI: 0.969–0.990) and 0.995 (95% CI: 0.992–0.997) each year, respectively.
Conclusion:
Female faculty continue to be concentrated at the junior faculty rank. Rate changes at the senior faculty rank for female faculty have slightly improved over the last 10 years compared to male faculty. However, this improvement is minimal, and work is still needed to achieve true gender equity in academic medicine.
Introduction
In the 2022
In 2000, Nonnemaker established a gender promotional gap between men and women in academic medicine. Using analysis of difference, she found that among medical school graduates from 1979 to 1997, women were more likely than men to pursue full-time careers in academic medicine and were significantly less likely to advance to senior-level faculty rank positions. 4 This promotional gap was further supported by Jena et al. in a cross-sectional study done in 2014 that found the proportion of women at the rank of full professor in US medical schools had not increased since 1980, 5 and the promotional sex disparity “remained even after accounting for age, experience, specialty, and research productivity” using a multivariable, multilevel logistic regression model. 5,6 More recent work in 2020 using Kaplan–Meier and Cox proportional hazard regression analysis expanded Nonnemaker's cohort study to include medical school graduates from 1998 to 2013 with unfortunately similar results showing “women who went into academic medicine were less likely than men to advance into upper faculty ranks.” 6
All the aforementioned studies focus on promotion into associate and full Professor faculty ranks but say little about junior faculty ranks like instructor and Assistant Professor. Also, these studies focus on snap shots in time or time to an event, rather than trends in female faculty compared to male faculty over time. Building on current literature, we sought to explore the rates of change of female faculty in faculty ranks over the last 10 years to gain a more comprehensive view of the faculty trends of women in academic medicine.
Methods
This study used the Association of American Medical Colleges (AAMC) Faculty Roster reports through the Faculty Administrative Management Online User System database. These data encompass comprehensive information on the faculty members at accredited US allopathic medical schools in the United States and Puerto Rico. Data were retrieved through an AAMC Faculty Roster representative at the authors' home institution for the years 2012–2021. Data included counts by gender and faculty rank at the institutional level. Analysis focused on four faculty ranks: Instructor, Assistant Professor, Associate Professor, and Professor. Any schools with zero reported faculty for years in the study period were excluded from the analysis.
Statistical analysis included descriptive statistics such as median and interquartile range (IQR) calculations for each gender and generalized estimating equations (GEE) modeling to assess rates of change for each gender. Every GEE model used a log link function with a negative binomial distribution to account for the overdispersion of the count data. To account for correlation among the repeated measures over years from the same institution and differences in faculty size across institutions, a first-order regressive working correlation structure and an offset were used. All GEE models used year as the continuous time variable and controlled for additional covariates, the census-designated region of the institution, whether the institution is public or private, and the percentage of faculty underrepresented in medicine at each institution.
Data analysis was completed using SAS Version 9.4 (SAS Institute, Inc., Cary, NC), and p < 0.05 was considered statistically significant. This study was deemed not human subjects research by the Institutional Review Board at the University of Texas Medical Branch.
Results
Of the 141 medical schools included in the study, 61.7% were public schools, and the largest institutional majority were in the South (38.3%). Table 1 shows number, percentage, and median of total faculty by gender with associated IQR for first year (2012) and last year (2021) of the study.
Descriptive Statistics by Gender for 2012 and 2021
Total Faculty of the 141 medical school included in the study.
Median number of faculty per institution.
IQR, interquartile range.
Figure 1 shows median proportion of faculty by gender at AAMC member medical schools over time. Additionally, Table 2 contains the adjusted rate estimates for each gender for the first year of the study (2012), the final study year (2021), and yearly change rate for the 10 years. After adjusting for institutional characteristics (i.e., region, public vs. private, underrepresented in medicine faculty percentage), gender rate changes over time showed significant rates of change, p < 0.001 for females and p = 0.0027 for males. With each year-increase, female faculty groups increased by a rate of 1.022 (95% confidence interval [CI]: 1.018–1.027), while male faculty decreased by a rate of 0.993 (95% CI: 0.989–0.998).
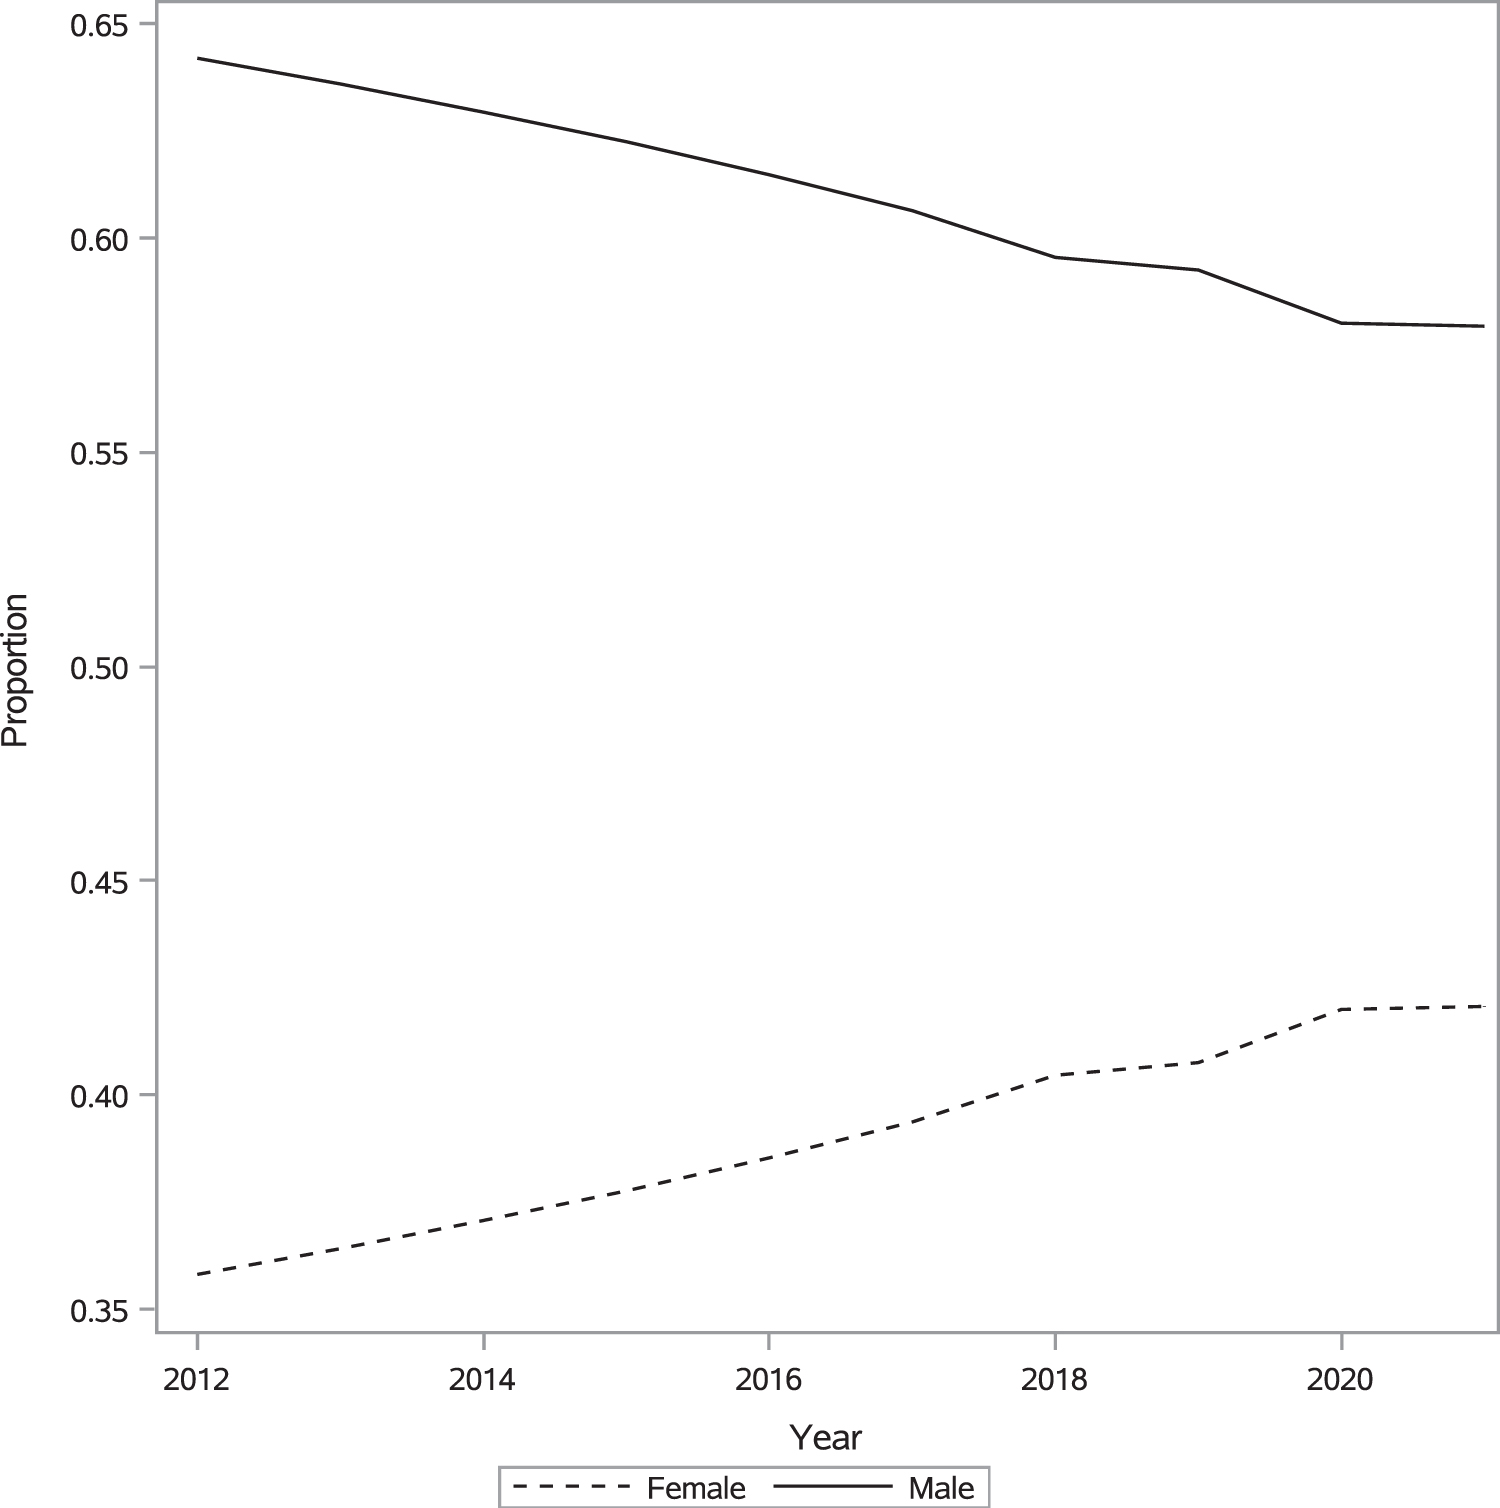
Trends in the proportion of faculty belonging to each gender over time.
Estimated Rates for Each Gender for the First Year (2012), Final Year (2021), and Overall Period
CI, confidence interval.
Figure 2 depicts the changes in faculty trends by gender over time for each faculty rank. As seen in the figure, male faculty have a higher proportion concentrated in Associate Professor and Professor ranks and lower proportion at the Instructor and Assistant Professor levels compared to female faculty. Over the 10-year period, female faculty have a slight decreasing trend at the Instructor level and a slight increasing trend at the Associate Professor, but for Assistant Professor and Professor faculty ranks, there seems to show a stable trend, evidenced by the flat, parallel lines between genders.
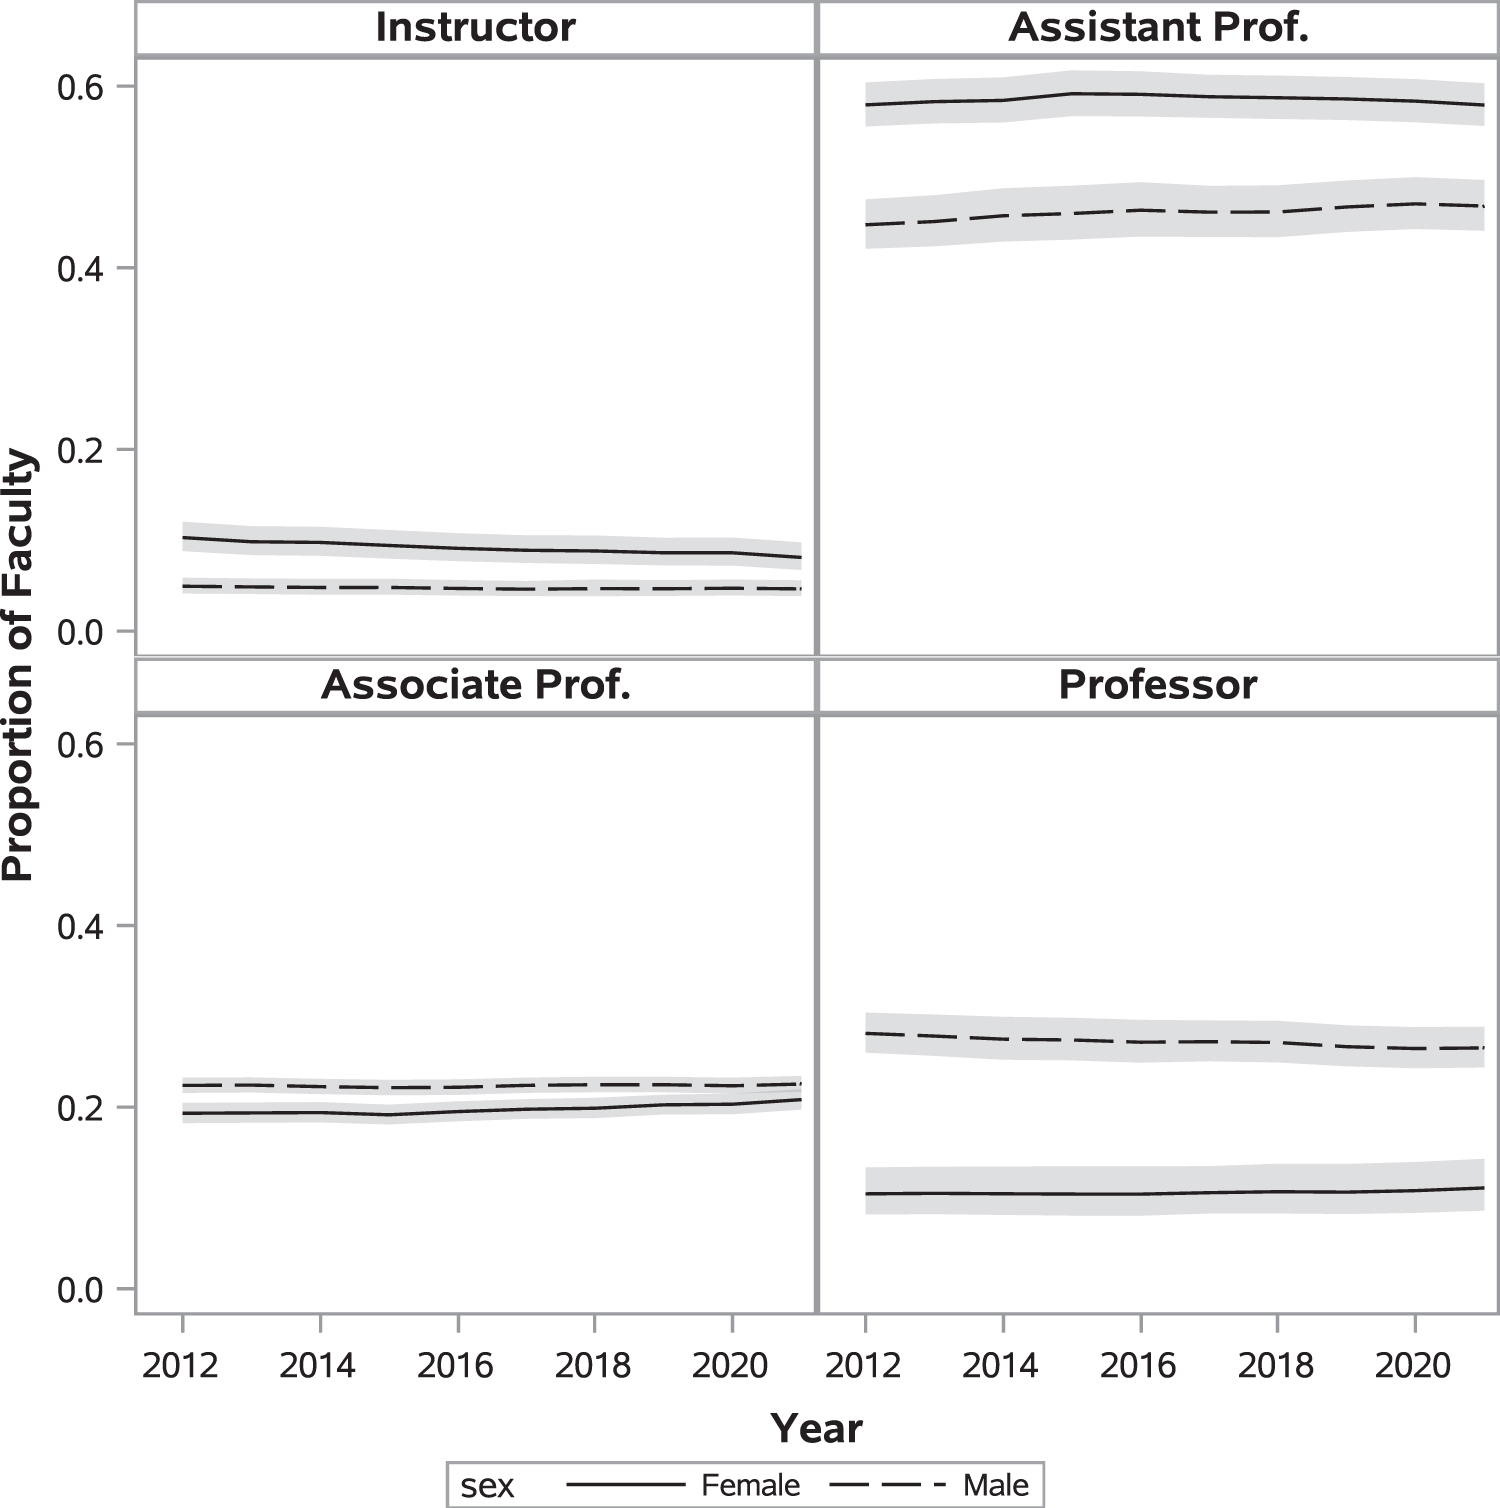
Changes in the proportion of faculty at each academic ranking by gender.
Further exploration of the gender trend by faculty rank can be examined through the rates displayed in Table 3. Table 3 shows the adjusted yearly change rates for females (relative to males) by rank. Males were used as the reference group as male faculty were the larger of the two gender groups. All faculty ranks showed a significant interaction between time and gender (p < 0.01) using Type 3 analysis of effects. Compared to males, at the Instructor and Assistant Professor levels, female faculty decreased at a relative rate of 0.980 (95% CI: 0.969–0.990) and 0.995 (95% CI: 0.992–0.997), respectively, each year. At the Associate Professor and Professor levels, female faculty showed increased rate change compared to male faculty: 1.007 (95% CI: 1.002–1.012) for Associate Professor rank and 1.012 (95% CI: 1.007–1.016) for Professor rank.
Estimated Yearly Change Rates for Female (Relative to Male) by Rank Over Study Period
Discussion
Our study results tell an interesting story about gender over the last 10 years. On one hand, female faculty have higher proportions at junior level ranks of Instructor and Assistant Professor and lower proportions at senior level rank, Associate Professor and Professor, as compared to male faculty. This result is consistent with several other studies showing persistence of gender inequities in faculty advancement. 4 –9 On the other hand, our study results show evidence of slight improvement over the last 10 years with statistically significant increasing rates of female faculty at the Associate Professor and Professor rank compared to males. However, one could argue that while the results may be statistically significant, they do not indicate substantive change as all rates hover around a rate of 1, a stable trend.
Another interesting finding from our results is the decreasing rate of female faculty at the Instructor and Assistant Professor level. While this decreasing rate could indicate that more female faculty are indeed moving into senior level faculty ranks, it could also reflect that women are leaving academic medicine at junior level faculty ranks. This would be consistent with other research showing higher rates of female faculty attrition 10 and concerns that mid-career women in academic medicine experience micro-inequities causing them to leave medicine. 11,12 Overall, the meaning of our results show gender inequalities at the senior level rank have improved slightly over the last 10 years, but we are still far from true gender equity and this slow improvement could be affecting the number of women who choose to stay in academic medicine.
When we evaluate the reasons for the slow improvement in gender inequities through the lens of literature, a few main themes emerge: lack of pay parity between women and men in academic medicine, 13 –15 lack of mentorship and faculty development within academic medical centers for females, 9,12,16 higher rates of female faculty attrition through burn out, 12,17 widening of all disparities for women of color, 18,19 and lack of females in leadership positions within academic medical institutions. 20 Even in the instances when women are given the chance to step into leadership, it is often in precarious situations or times of crisis, where there are strong chances of failing, a situation described as the “glass cliff.” 21
It's clear we know where gender inequities and disparities lie in academic medicine and there are even many proposed solutions to address these inequities. 19,22 However, where we are still lacking is in implementation or research showing effective interventions which lead to equitable work environments in academic medicine. If we are to ever reach gender equity in academic medicine, effective intervention is where our future efforts need to be focused.
One of our study limitations relates to the inability to link racial differences within gender groups. We were unable to do this analysis with the population-based database used but this could be done with a dataset incorporating unique observations with race/ethnicity and gender for each observation. Our dataset also did not have age associated with gender; thus, we were unable to investigate how faculty age contributes to the trends in faculty rank over the study period. Another limitation is we can only speculate on the reasons for continued gender disparity within academic medicine. In order to explore the relationship between gender trends in academic medicine and salary, faculty mentorship, and burnout, a dataset with these variables for each institution would be needed.
Conclusion
Compared to male faculty, female faculty continue to be concentrated at the junior faculty rank; however, rate changes at the senior faculty rank for female faculty have slightly improved over the last 10 years. Despite this improvement, much work is still needed to achieve gender equity in academic medicine.
Footnotes
Acknowledgment
The authors would like to acknowledge Christen Walcher for editing and formatting the article.
Authors' Contributions
A.C.: writing—original draft, data curation, methodology, formal analysis, visualization, software. X.Y.: data curation, methodology, formal analysis, visualization, software. Q.J.: writing—original draft. C.Z.X.: writing—original draft. K.M.C.: conceptualization, writing—original draft.
Author Disclosure Statement
No competing financial interests exist.
Funding Information
No funding was received for this article.