




Abstract
Background:
Neighborhood poverty is associated with adiposity in women, though longitudinal designs, annually collected residential histories, objectively collected anthropometric measures, and geographically diverse samples of midlife women remain limited.
Objective:
To investigate whether longitudinal exposure to neighborhood concentrated poverty is associated with differences in body mass index (BMI) and waist circumference (WC) among 2,328 midlife women (age 42–52 years at baseline) from 6 U.S. cities enrolled in the Study of Women’s Health Across the Nation (SWAN) from 1996 to 2007.
Methods:
Residential addresses and adiposity measures were collected at approximately annual intervals from the baseline visit through a 10-year follow-up. We used census poverty data and local spatial statistics to identify hot-spots of high concentrated poverty areas and cold-spots of low concentrated poverty located within each SWAN site region, and used linear mixed-effect models to estimate percentage differences (95% confidence interval [CI]) in average BMI and WC levels between neighborhood concentrated poverty categories.
Results:
After adjusting for individual-level sociodemographics, health-related factors, and residential mobility, compared to residents of moderate concentrated poverty communities, women living in site-specific hot-spots of high concentrated poverty had 1.5% higher (95% CI: 0.6, 2.3) BMI and 1.3% higher (95% CI: 0.5, 2.0) WC levels, whereas women living in cold-spots of low concentrated poverty had 0.7% lower (95% CI: −1.2, −0.1) BMI and 0.3% lower (95% CI: −0.8, 0.2) WC. Site-stratified results remained in largely similar directions to overall estimates, despite wide CIs and small sample sizes.
Conclusions:
Longitudinal exposure to neighborhood concentrated poverty is associated with slightly higher BMI and WC among women across midlife.
Introduction
The prevalence of obesity in the United States has increased since the 1960s, 1 with over 40% of adults considered obese in 2017–2018. 2 The obesity epidemic remains a significant public health problem, as obesity is a strong and independent predictor of diabetes, kidney disease, and cardiovascular disease. 3 Among women in particular, obesity rates are highest among those in midlife (40–59 years) and later years (60+ years). 4 As the menopausal transition marks a critical period of physiological change in the female life course, midlife exposure to obesogenic environments represents a crucial area of research to mitigate the existing burden. 5 The prevalence of obesity varies across space and regional locales in the United States. 6 High obesity rates tend to cluster at the regional level in the Midwest and the South, 6 but clusters of high obesity neighborhoods have also been documented at the local level in the United States. 7 –9 Therefore, investigation into the contribution of neighborhood-level factors to the obesity epidemic is warranted.
Previous studies have documented a positive link between higher neighborhood-level poverty and greater adiposity in women, beyond individual-level factors. 10 –13 However, prior evidence to date is largely cross-sectional or utilizes time-invariant neighborhood exposure measures. These are important limitations of existing work, as neighborhoods are highly dynamic entities that evolve over time. 14 As such, they may differentially expose individuals to different residential conditions at different time periods—which static measures alone cannot capture. Moreover, there is evidence to suggest that neighborhoods can experience substantial revitalization or decline in nearly a decade’s time or less, 15 –21 and that these changes can have meaningful impacts on health outcomes as well. For example, a reduction in neighborhood socioeconomic deprivation over a 10-year period was associated with significant reductions in mortality among middle-aged and early older-aged women living in more deprived communities. 22 Another study found that living in a neighborhood with improving socioeconomic status (SES) over just 5 years was associated with significant reductions in diabetes incidence in middle-aged adults. 23 Thus, using just a single time point of neighborhood exposure to define community advantage may not only misclassify neighborhood exposures temporally but may also obscure meaningful variation in shifting environmental conditions, which may be influencing obesity patterns. Only a handful of studies have investigated the relationship between neighborhood socioeconomic position and adiposity longitudinally. Prior work has relied on self-reported measures of adiposity, 24 –28 homogeneous populations, 28,29 cohorts from restricted geographic areas, 30 –32 samples of adolescents or young adults, 24,33 and limited control for individual-level biomedical confounders. 24 –28,30 –32 Moreover, there is a need to investigate the impact of relative neighborhood poverty (as opposed to absolute poverty), and whether living in a cluster of high poverty neighborhoods contributes to heightened adiposity over time. For example, there is evidence to suggest that individuals residing in neighborhoods characterized by higher levels of relative poverty have been found to experience greater levels of psychosocial stress, including feelings of relative deprivation and social comparison, via the stress process model. 34 –37 Such stress is linked to increased rates of depression and anxiety, which, in turn, can indirectly influence adiposity through behaviors such as unhealthy eating and reduced physical activity. 38 Moreover, numerous studies spanning various disciplines have characterized “concentrated poverty” by applying different thresholds to absolute poverty measures. 39 –41 However, these methodologies overlook the broader context of the surrounding regions in which communities are imbedded and remain more or less ambivalent to the circumstances and poverty levels of adjacent communities. Consequently, they remain unable to identify clusters of intensely concentrated poverty (or hot-spots) located throughout specific locales and regions. As a result, it is important to quantify the effect of long-term exposure to high concentrated poverty on objective measures of adiposity among diverse populations of women across the sensitive female midlife period.
Using data from
Materials and Methods
Study sample
SWAN is a multisite, community-based cohort study of women transitioning through menopause. 42 Beginning in 1996, 3,302 women were recruited from seven clinical sites across the United States. Study participants self-identified as either White, Black, Hispanic, Chinese, or Japanese American and were enrolled from one of seven sites: Pittsburgh, Pennsylvania (PA); Chicago, Illinois (IL); Southeastern Michigan (MI); Newark, New Jersey (NJ); Oakland, California (CA); Los Angeles, California; and Boston, Massachusetts. Each study site recruited women of one prespecified racial or ethnic group (i.e., Black, Hispanic, Chinese, or Japanese) and White women. At baseline, participants were 42–52 years old, had their uterus and at least one ovary intact, had at least one menstrual period in the 3 months preceding enrollment, were not taking medications impacting ovarian function, and were not pregnant or lactating. Written informed consent was obtained from all study participants, and institutional review board approval was obtained at each study site. Clinical exams and data collection occurred at approximately annual or biannual intervals for a total of 16 follow-up visits.
For the present study, we used data from a subset of SWAN women who had consented to participate in an environmental air pollution ancillary study. 43,44 Residential address histories were maintained annually from baseline through follow-up visit 10 on participants enrolled at six sites: Southeastern MI; Chicago, IL; Oakland, CA; Los Angeles, CA; Newark, NJ; and Pittsburgh, PA. Addresses were geocoded to the census tract—the smallest spatial unit available for analysis—based on the 2010 census boundary classifications. We used SWAN data collected on participants from the six participating sites from baseline through visit 10. To be eligible for inclusion, participants had to have complete neighborhood exposure, adiposity outcome, and key covariate data at baseline and at one or more follow-up visits. Of the 2,833 SWAN participants with geocoded data, we excluded 259 women who were missing information on baseline concentrated poverty (n = 13), adiposity outcomes (n = 94), or key covariates of interest (n = 152) (Supplementary Figure S1). We excluded an additional 248 women who had no available follow-up visits with complete data for BMI models. We censored 67 observations from NJ site participants from V06 onward (due to high sample attrition), yielding a final analytic sample of 2,326 women with 18,285 observations for the BMI modeling. The same logic and set of criteria were used to obtain our final analytic sample of 2,323 women with 18,093 observations for WC modeling. Restricting to the six participating sites, those excluded were more likely to be Hispanic, lower income, less educated, current smokers, and obese than those who were included in the analysis (Supplementary Table S1). The women in the analytic cohort had a median of 9 observations (range: 2–11) and lived in 927 census tracts.
Neighborhood concentrated poverty
Neighborhood concentrated poverty was calculated using the local Getis-Ord (Gi*) spatial statistic based on poverty data from the U.S. census. We obtained census tract-level poverty data from 1990 through 2010 from the Longitudinal Tract Database (Brown University), which normalized estimates from different decennial census years to the 2010 boundary classifications (allowing for longitudinal comparison across the same geographic boundaries across time). 45,46 We obtained poverty rates—defined as the proportion of residents living below 150% of the federal poverty line—for each census tract and linearly interpolated estimates for years occurring between the decennial censuses. We then used the local Getis-Ord Gi* spatial statistic to identify areas with significantly high (hot-spots) and low (cold-spots) clusters of neighborhood poverty within each local SWAN site region over the decade. 47,48 The Gi* is a spatially weighted measure that evaluates the extent to which the poverty rate of the focal tract and its neighboring tracts deviate from the mean poverty rate of all tracts located within the set of counties comprising each local SWAN site area (Supplementary Table S2). Larger z-scores correspond to more intense clustering of high concentrated poverty tracts within an area, whereas smaller z-scores correspond to more intense clustering of low concentrated poverty tracts within an area. For example, a significantly positive z-score (Gi* > +1.96) indicates a local hot-spot of high concentrated poverty and is detected when a given focal tract with a high poverty rate is surrounded by neighboring tracts with similarly high poverty rates. Conversely, a significantly negative z-score (Gi* < −1.96) indicates a local cold-spot of low concentrated poverty and is detected when a given focal tract with a low poverty rate is surrounded by neighboring tracts with similarly low poverty rates. We calculated Gi* z-scores for census tracts located within each local SWAN site area separately and specified a first-order queen contiguity spatial weight matrix to define and weight the values of neighboring tracts. We obtained Gi* statistics for each census tract annually across 11 total years (1996–2007) and categorized each tract into low (Gi* z-scores < −1.96), moderate (Gi* −1.96-1.96), and high (Gi* > 1.96) concentrated poverty based upon the z-score critical value cut points at a = 0.05. We then merged these measures with each participant’s geocoded census tract of residence at each visit year to characterize individual-level neighborhood concentrated poverty exposure level.
BMI and WC
BMI (kg/m2) was calculated from height and weight and measured using standardized protocols. Obesity was defined as having a BMI ≥30 kg/m2 for Black, White, and Hispanic participants and ≥25 kg/m2 for Chinese and Japanese participants. 49 WC (cm) was measured to the nearest 0.1 cm on participants wearing light clothing or over undergarments using a standardized protocol of placing a measuring tape around the narrowest point of the torso.
Covariates
We considered the following baseline covariates for adjustment: baseline age, education level (high school or less, some college, college, or postgraduate), study site, and self-reported race/ethnicity (considered a marker of social disadvantage capturing the impacts of structural racism). We also considered the following time-varying covariates, which were measured via standardized questionnaires or interviews at most annual follow-up visits: employment, marital status (single, married, separated/widowed/divorced), alcohol use, current smoking (current, past/never), depressive symptoms, physical activity, menopausal status (premenopausal, early perimenopausal, late perimenopausal, postmenopausal, other), and hormone therapy use (current/past, never). We used time-varying covariates from the geocoded data: logged-population density (persons per square mile) and an indicator of recent moving status (i.e., participant moved neighborhoods since last recorded visit). The physical activity score was measured based on the modified Baecke questionnaire, with greater scores demonstrating higher levels of physical activity in active living, household/caregiving activity, and in sports/exercise activity domains. 50 As physical activity data were not collected at each follow-up, observations from the closest prior exam were carried forward to impute missing values. Depressive symptoms were measured using the Center for Epidemiological Studies Depression scale, with a cutoff of 16 or higher indicating the clinical presence of depressive symptomology. 51 Menopausal status was defined based on the self-reported bleeding patterns of participants during the prior 12 months.
Analytic approach
We calculated baseline characteristics overall and by site using means and standard deviations for normally distributed variables, medians and interquartile ranges (IQR) for skewed variables, and frequencies and proportions for categorical variables. Given the skewed distributions of BMI and WC, log-transformed values were modeled in regression analyses. We used linear mixed effect models (with a random intercept at the woman level) to evaluate the relationship between neighborhood concentrated poverty and adiposity levels, separately, using two models: Model 1—minimally adjusted for the following time-invariant covariates: baseline age, study site, race/ethnicity, study site, and education level and Model 2—fully adjusted for Model 1 covariates plus time-varying marital status, employment, alcohol use, current smoking, depressive symptoms, physical activity, menopausal status, hormone therapy use, population density, and moving status. As concentrated poverty was not associated with rates of change in BMI over time, interaction terms between time and concentrated poverty categories were dropped from models. We exponentiated estimates to present percentage differences and 95% confidence intervals (CIs) in adiposity levels between concurrent concentrated poverty categories (referent = moderate concentrated poverty) using the following equation: [Exp(B)−1] × 100%. Given evidence of regional variation in area-level poverty and obesity in the United States, we also introduced interaction terms between SWAN site and concentrated poverty category to assess whether the relationship between site-specific concentrated poverty and adiposity varied spatially across geographic sites. We did not employ three-level models in the present analysis given the nonsignificant random effect terms for women nested within census tracts throughout analyses. Analyses were conducted using R version 4.2 (R Development Core Team) and SAS version 9.4 (SAS Institute, Cary, NC).
Sensitivity and secondary analyses
In sensitivity analyses, we evaluated whether using more liberal Gi* z-score cut points (at the a = 0.10 level) to categorize our concentrated poverty exposures altered results. To assess the extent to which concentrated poverty may impact adiposity in a lagged fashion, we used yearly temporally lagged exposures. We examined whether exposure to high absolute poverty influenced adiposity levels among women over time. We further adjusted for hypertension and diabetes as potential covariates of interest. We also re-ran analyses using covariate data imputed from prior visits using its last observation carried forward (LOCF). In secondary analyses, we assessed whether within-woman changes in concentrated poverty since baseline were associated with differences in BMI and WC levels by modeling concentrated poverty as a function of a woman’s baseline category (high, moderate, low) and change in concentrated poverty at each follow-up time point since baseline (increased, decreased, no change).
Results
Figure 1 displays the spatial distribution of hot-spots of high concentrated poverty and cold-spots of low concentrated poverty located throughout each SWAN region at baseline. Median absolute poverty levels ranged from 2% to 5% in cold-spots across sites (Supplementary Table S3). In moderate concentrated poverty areas, absolute poverty rates ranged from 6% (IQR: 4–10) in Oakland to 15% (IQR: 10–20) in Los Angeles. Median absolute poverty levels were highest in the Chicago (36%) and SE Michigan (38%) hot-spot regions and were lowest in the Oakland (24%) and Newark (19%) hot-spot regions. Local hot-spots in the Pittsburgh and Los Angeles areas had median poverty rates of 30% (IQR: 25–38) and 35% (IQR: 28–39), respectively.
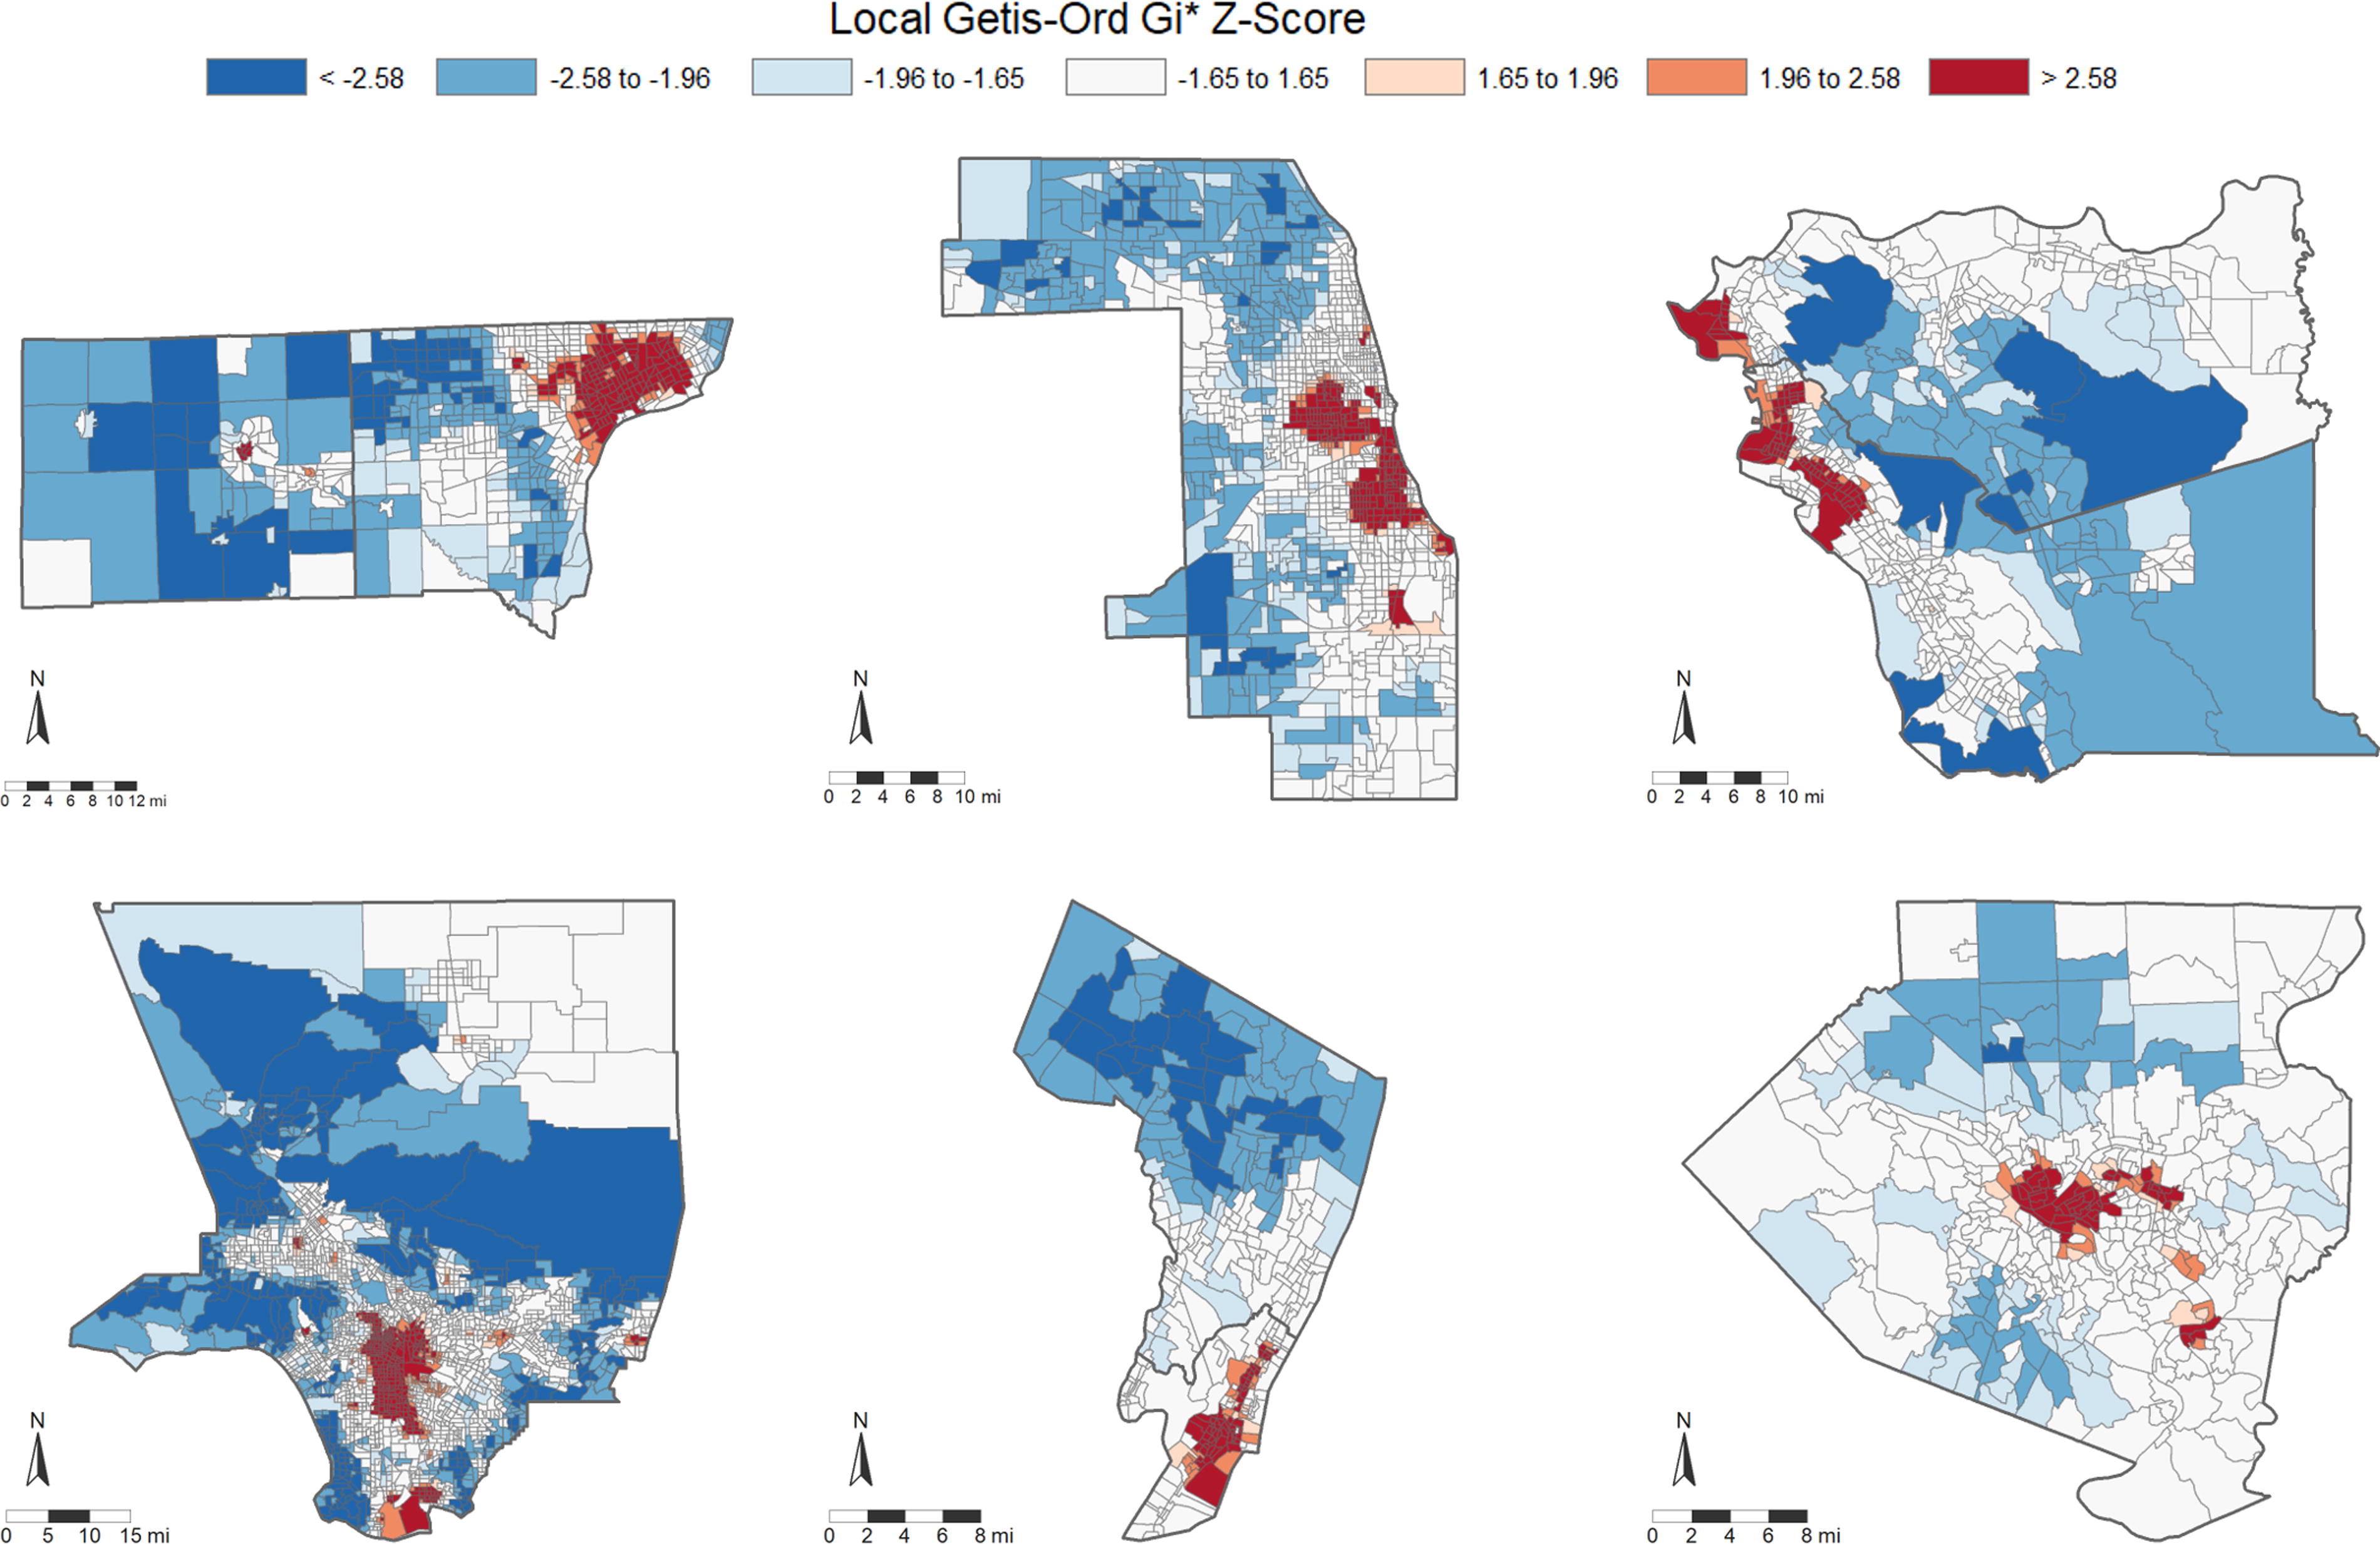
Local hot-spots and cold-spots of neighborhood concentrated poverty within regions where SWAN sites are located: The Study of Women’s Health Across the Nation, United States, 1996.
At baseline, our sample of 2,328 women had mean age 46 years (standard deviation, 2.7), and 428 lived in Southeastern MI, 372 lived in Chicago, 399 lived in Oakland, 449 lived in Los Angeles, 274 lived in New Jersey, and 405 lived in Pittsburgh (Table 1). Approximately 25% of our samples were Black, 47% were White, 9% were Chinese, 8% were Hispanic, and 11% were Japanese. Median baseline BMI and WC were 26.2 kg/m2 (IQR: 22.7–31.8) and 82.0 cm (IQR: 74.0–94.5), respectively, and rose by an average of 5.0% (95% CI: 4.7, 5.2) and 6.1% (95% CI: 5.9, 6.4) from baseline to the 10-year follow-up, respectively. At baseline, 10% percent of our sample lived in high concentrated poverty neighborhoods, 71% lived in moderate concentrated poverty, and 19% lived in low concentrated poverty communities relative to other neighborhoods within the same study site. On average, baseline BMI and WC levels were lowest among women living in low concentrated poverty—with each increasing concentrated poverty category having progressively higher BMI and WC. The majority of participants at each site resided in moderate concentrated poverty areas, with the exception being at the Los Angeles site where most participants lived in low concentrated poverty communities. Baseline obesity rates were highest among high concentrated poverty residents and lowest among low concentrated poverty residents in SWAN overall (Supplementary Figure S2). With the exception of the Los Angeles site, there was a positive relationship between the concentrated poverty category and baseline obesity within each site such that higher poverty concentration was associated with higher rates of obesity at baseline.
Participant Characteristics at Baseline Visit, Overall, and by Neighborhood Concentrated Poverty Category: The Study of Women’s Health Across the Nation, United States, 1996 (n = 2,328 Women)
MI, Michigan; IL, Illinois; CA, California; NJ, New Jersey; PA, Pennsylvania; CESD, Center for Epidemiological Studies of Depression Scale; IQR, interquartile range; sd, standard deviation; kg/m2, kilogram per meter squared; cm, centimeter.
In our total sample, compared to those living in moderate concentrated poverty, women living in high concentrated poverty communities had 1.55% higher (95% CI: 0.71, 2.39) BMI and 1.33% higher (95% CI: 0.59, 2.08) WC levels, whereas women living in low concentrated poverty had 0.79% lower (95% CI: −1.28, −0.29) BMI and 0.47% lower (95% CI: −0.91, −0.01) WC levels, in minimally adjusted models (Table 2). After controlling for time-varying sociodemographic factors, health-related factors, residential mobility, and menopause-associated factors, living in a site-specific hot-spot of high concentrated poverty throughout midlife was associated with 1.45% higher (95% CI: 0.62, 2.29) BMI and 1.27% higher (95% CI: 0.53, 2.02) WC, whereas living in a cold-spot of low concentrated poverty was associated with 0.65% lower (95% CI: −1.15, −0.14) BMI and 0.31% lower (95% CI: −0.77, 0.15) WC levels, relative to women living in moderate concentrated poverty. Covariate adjustment reduced the magnitude, but not the significance, of most estimated effects across sites. In site-specific analyses, the results were largely similar to the overall estimates, although the CIs are wide with small sample sizes.
Percentage Differences a (95% Confidence Limits) in Average Body Mass Index and Waist Circumference Levels Between Neighborhood Concentrated Poverty Categories, Overall and by Study Site, the Study of Women’s Health Across the Nation, United States (1996–2007)
Bold indicates statistical significance at the 0.05 alpha level.
Percentage differences (95% CI) as estimated from linear mixed-effect models, with the Moderate Concentrated Poverty category serving as the referent group for all comparisons. BMI models include 2,326 women (with 18,285 observations), and WC models include 2,323 women (with 18,093 observations).
Model 1: minimally adjusted for baseline age, race/ethnicity, study site, and education level.
Model 2: fully adjusted for Model 1 covariates + marital status, employment status, alcohol use, current smoking, depressive symptoms, physical activity score, menopausal status, use of hormone therapy, population density (log-transformed), and residential mobility since prior visit.
CI, confidence interval; MI, Michigan; IL, Illinois; CA, California; NJ, New Jersey; PA, Pennsylvania; Gi*, getis-ord Gi* statistic.
In sensitivity analyses using more liberal Gi* cut points, we found only slight reductions in the magnitude of BMI and WC differences between concentrated poverty categories overall, whereas site-specific results remained largely null (Supplementary Table S4). Analyses using lagged-concentrated poverty categories produced comparable results for our primary effects overall, despite small sample sizes and imprecise estimates in some sites. Absolute neighborhood poverty was generally not associated with adiposity, overall or within sites. The results were similar in models further controlling for hypertension and diabetes (Supplementary Table S5). Models adjusting for LOCF-covariate data yielded similar findings. In secondary analyses (Supplementary Table S6), compared to women who experienced no changes in concentrated poverty, within-woman increases in concentrated poverty were associated with 0.90% higher (95% CI: 0.22, 1.59) BMI and 0.66% higher (95% CI: 0.04, 1.29) WC levels, whereas within-woman declines in concentrated poverty were associated with 0.69% lower (95% CI: −1.28, −0.08) BMI and 0.24% lower (95% CI: −0.79, 0.31) WC levels in our sample overall.
Discussion
In this racially, ethnically, and geographically diverse cohort of women transitioning through menopause, living in site-specific hot-spots of high concentrated poverty during midlife was associated with slightly higher BMI and WC levels, whereas living in cold-spots of low concentrated poverty was associated with slightly lower levels of adiposity, relative to residents of moderate poverty communities. Relationships persisted after controlling for individual-level sociodemographics, health-related factors, residential mobility, and menopause-associated factors. Despite wide CIs and small sample sizes in site-stratified analyses, the results within sites remained largely similar to estimates in the overall study population in direction and magnitude (though not in statistical significance).
To our knowledge, this is the first study to longitudinally examine whether residing in high concentrated poverty throughout midlife influenced adiposity levels among women. Our findings are largely consistent with prior longitudinal work of neighborhood poverty and weight-related outcomes in US adults. We found that exposure to high concentrated poverty had a deleterious effect on adiposity, while exposure to low concentrated poverty had a slightly protective effect against adiposity. Similarly, another longitudinal study of 11,035 Australians (aged 40–65 years) found that lower neighborhood SES was associated with higher average BMI levels among female participants over time. 25 Although this study was specific to nonmovers, in particular, a separate analysis in the same cohort of middle-aged and older adults demonstrated similar results among women when restricted to moving participants. 26 Our findings also align with previous longitudinal work assessing the relationship between neighborhood poverty and weight-related outcomes in older adult U.S. populations. In a longitudinal cohort of 8,195 women (mean age: 50 years), long-term exposure to high levels of neighborhood poverty was associated with greater risk of being overweight. 28 Although the prior studies relied upon self-reported measures of BMI with limited control for biomedical confounders, our study utilized objectively collected measures of adiposity and we were able to account for several important health behaviors. Nevertheless, our results are largely consistent with previous findings in demonstrating a positive link between neighborhood poverty and average adiposity levels among women over time.
We also found that an increase in concentrated poverty was associated with higher adiposity, while a decline in concentrated poverty was associated with lower adiposity. Despite differences in sample composition and covariate adjustment across studies, our findings align with one longitudinal study of 2,339 mothers (mean age: 36.4 years) in California which found decreasing levels of neighborhood poverty were associated with lower odds of being obese. 27 Our results are also consistent with a study of 12,164 individuals in a younger cohort (mean age: 15.3 years), which found that women who had experienced increases in neighborhood poverty during adolescence had slightly higher odds of obesity in adulthood, despite covariate adjustment reducing the statistical significance of these effects somewhat. 24 Our findings also compare with previous work assessing the relationship between changing neighborhood poverty and weight-related outcomes in middle-aged and older adult populations. In a large study of 126,179 nonmovers in the United States (mean age: 62 years), declines in neighborhood SES were linked to greater risk of excessive weight gain among females. 29 Still, findings among movers have not always been consistent, as our null findings of a relationship between neighborhood change and change in adiposity are consistent with some, 26 but not all, 32 previous work. We also did not find evidence of a link between neighborhood poverty and rates of change in adiposity over time. This was unlike one study of 939 residentially stable participants from Dallas, Texas (mean age: 46 years), which found that lower neighborhood SES was associated with greater weight gain among long-term residents. 31 Such inconsistencies may be attributable to a variety of factors, including number of timepoints, geographic diversity of cohorts, and control for health-related and biomedical confounders. We found only slight differences in the relationship between concentrated poverty and adiposity in site-specific models. While most associations were attenuated toward the null, most had a similar direction and magnitude as the overall population. The six participating SWAN sites were all located in metropolitan locales, and none were located in the southeastern portion of the United States. This is important, as obesity rates remain highest in the southern portions of the United States 52 and are also higher among women living in nonmetropolitan areas. 53 Thus, future studies are needed to explore the within- and between-regional effects of concentrated poverty on adiposity among women over time.
Our results suggest that midlife exposure to neighborhood poverty may adversely impact adiposity among women as they age. The mechanisms underlying this relationship are likely multifaceted. Neighborhood poverty may contribute to poor health behaviors (e.g., diet, sleep), which in turn may lead to increased obesity risk during midlife among women. 54 –57 Heightened cortisol levels have also been linked to greater adiposity in adults and may serve as a mediating factor on the pathway between concentrated poverty and adiposity over time. 58 –60 Neighborhood poverty may increase risk for other mental health conditions and health-related factors (e.g., anxiety, metabolic syndrome), which in turn may lead to higher central and abdominal adiposity over time. 61,62 However, a disproportionate burden of neighborhood concentrated poverty and risk-enhancing environmental features is located within historically marginalized communities in the United States. 63 –65 This is consistent with our findings, in which a greater proportion of Black and Hispanic women resided in high concentrated poverty areas compared to White women. This racialization of highly concentrated neighborhood poverty exists as a result of structural racism, which serves as a root cause in perpetuating health disparities and environmental inequities over time in the United States. 66,67 Therefore, it is important to address inequities in local social, economic, and physical environment features stemming from systemic racism in order to improve equity in the quality of community environments. 68,69
Some notable strengths of our study include its longitudinal design with 10-year follow-up of a geographically diverse sample of midlife women, annually collected residential histories, objective measures of central and abdominal adiposity, and substantive control for confounders and residential mobility. Our study has some limitations. First, our work lacks generalizability to rural settings, which is important given that nonmetropolitan areas have shown high obesity prevalence. 52 Second, our measure of concentrated poverty reflects a single aspect of neighborhood socioeconomic hardship and does not capture other aspects of the social or physical environment. Moreover, our measure is more reflective of relative neighborhood poverty within a given region and not absolute neighborhood poverty specifically. For example, although women at the Michigan site tended to live in high absolute poverty areas, they did not reside in site-specific hot-spots (or high poverty neighborhoods surrounded by similarly high poverty neighborhoods clustering within the SE Michigan region). Third, residual confounding by unmeasured individual-level factors (e.g., stress, diet) and neighborhood-level features (e.g., food, healthcare, pollution) may have occurred. Fourth, although we found statistically significant differences in adiposity levels between concentrated poverty categories, it should be noted that they reflect very small differences in BMI and WC levels between groups. While we utilized objectively collected BMI and WC measures in this work, future studies that can incorporate more specific body composition measures (e.g., lean mass, fat mass) remain warranted. Fifth, although the Gi* statistic may be more effective in highlighting clustering as a component of relative neighborhood deprivation, alternative spatial measures (such as the local Moran’s I) should be explored in future work for evaluating the health implications of residing in a spatial outlier area. This includes scenarios such as living in a highly deprived community directly surrounded by low deprivation communities—a dimension not captured by the Gi* statistic alone. Sixth, we had limited power to detect within-city associations, and our findings may not be generalizable to all residents of those cities. The characteristics of the women recruited at each site differed and were also not reflective of the overall populations in each of those cities. Finally, we used census tracts to approximate neighborhood boundaries; however, prior work has found that perceived neighborhood boundaries may in fact be more idiosyncratic. 70 –72 Moreover, as alternative operationalizations of “neighborhood” may produce different results from those reported herein, future work that can incorporate and estimate effects at different spatial units (e.g., census block, block group, egocentric-type approaches) will be important to assess whether these associations remain consistent across different neighborhood specifications.
Conclusions
We found that greater exposure to neighborhood concentrated poverty during midlife was associated with slightly higher levels of central and abdominal adiposity among women over time. The results were robust to adjustment with individual-level sociodemographics, health-related factors, residential mobility, and menopause-associated factors. Our findings thus emphasize the importance of pursuing economic policies, community-based interventions, and revitalization efforts in high concentrated poverty areas across the United States to reduce the burden and extant disparities in obesity among women across the life course.
Footnotes
Acknowledgments
Clinical Centers: University of Michigan, Ann Arbor—Carrie Karvonen-Gutierrez, PI 2021—present, Siobán Harlow, PI 2011–2021, MaryFran Sowers, PI 1994–2011; Massachusetts General Hospital, Boston, MA—Sherri‐Ann Burnett‐Bowie, PI 2020—Present; Joel Finkelstein, PI 1999–2020; Robert Neer, PI 1994–1999; Rush University, Rush University Medical Center, Chicago, IL—Imke Janssen, PI 2020—Present; Howard Kravitz, PI 2009–2020; Lynda Powell, PI 1994–2009; University of California, Davis/Kaiser—Elaine Waetjen and Monique Hedderson, PIs 2020—Present; Ellen Gold, PI 1994–2020; University of California, Los Angeles—Arun Karlamangla, PI 2020—Present; Gail Greendale, PI 1994–2020; Albert Einstein College of Medicine, Bronx, NY—Carol Derby, PI 2011—present, Rachel Wildman, PI 2010–2011; Nanette Santoro, PI 2004–2010; University of Medicine and Dentistry—New Jersey Medical School, Newark—Gerson Weiss, PI 1994–2004; and the University of Pittsburgh, Pittsburgh, PA—Rebecca Thurston, PI 2020—Present; Karen Matthews, PI 1994–2020.
NIH Program Office: National Institute on Aging, Bethesda, MD—Rosaly Correa-de-Araujo 2020-present; Chhanda Dutta 2016-present; Winifred Rossi 2012–2016; Sherry Sherman 1994–2012; Marcia Ory 1994–2001; National Institute of Nursing Research, Bethesda, MD—Program Officers.
Central Laboratory: University of Michigan, Ann Arbor—Daniel McConnell (Central Ligand Assay Satellite Services).
Coordinating Center: University of Pittsburgh, Pittsburgh, PA—Maria Mori Brooks, PI 2012-present; Kim Sutton-Tyrrell, PI 2001–2012; New England Research Institutes, Watertown, MA-Sonja McKinlay, PI 1995–2001.
Steering Committee: Susan Johnson, Current Chair, Chris Gallagher, Former Chair.
We thank the study staff at each site and all the women who participated in SWAN.
SWAN Data Access Statement for Journals
SWAN provides access to public use datasets that include data from SWAN screening, the baseline visit and follow-up visits (https://agingresearchbiobank.nia.nih.gov/). To preserve participant confidentiality, some, but not all, of the data used for this manuscript are contained in the public use datasets. A link to the public use datasets is also located on the SWAN website:  . Investigators who require assistance accessing the public use dataset may contact the SWAN Coordinating Center at the following email address:
Authors’ Contributions
Concept and design: all authors; Methodology: M.D.S., C.M., E.B.M., M.M.B., D.D.M., A.I.M., and A.F.; Interpretation of findings: all authors; Manuscript drafting: M.D.S.; Manuscript—critical review and editing: all authors.
Author Disclosure Statement
The authors have no relevant financial or non-financial interests to disclose.
Funding Information
Supplementary Material
Supplementary Figure S1
Supplementary Figure S2
Supplementary Table S1
Supplementary Table S2
Supplementary Table S3
Supplementary Table S4
Supplementary Table S5
Supplementary Table S6
References
Supplementary Material
Please find the following supplemental material available below.
For Open Access articles published under a Creative Commons License, all supplemental material carries the same license as the article it is associated with.
For non-Open Access articles published, all supplemental material carries a non-exclusive license, and permission requests for re-use of supplemental material or any part of supplemental material shall be sent directly to the copyright owner as specified in the copyright notice associated with the article.
