




Abstract
Background:
Ovarian cancer is commonly diagnosed symptomatically at an advanced stage. Better survival for early disease suggests improving diagnostic pathways may increase survival. This study examines literature assessing diagnostic intervals and their association with clinical and psychological outcomes.
Methods:
Medline, EMBASE, and EmCare databases were searched for studies including quantitative measures of at least one interval, published between January 1, 2000 and August 9, 2022. Interval measures and associations (interval, outcomes, analytic strategy) were synthesized. Risk of bias of association studies was assessed using the Aarhus Checklist and ROBINS-E tool.
Results:
In total, 65 papers (20 association studies) were included and 26 unique intervals were identified. Interval estimates varied widely and were impacted by summary statistic used (mean or median) and group focused on. Of Aarhus-defined intervals, patient (symptom to presentation, n = 23; range [median]: 7–168 days) and diagnostic (presentation to diagnosis, n = 22; range [median]: 7–270 days) were most common. Nineteen association studies examined survival or stage outcomes with most, including five low risk-of-bias studies, finding no association.
Conclusions:
Studies reporting intervals for ovarian cancer diagnosis are limited by inconsistent definitions and reporting. Greater utilization of the Aarhus statement to define intervals and appropriate analytic methods is needed to strengthen findings from future studies.
Background
Ovarian cancer is the eighth most commonly diagnosed female cancer in the world, with over 300,000 women diagnosed in 2020. 1 Approximately, 70% of cases are diagnosed with advanced-stage disease which negatively impacts survival, from 5-year net survival of 80% for localized tumors to 30% for advanced disease. 2 Although trials of screening for asymptomatic women have not shown a mortality benefit, 3 the differential survival for those diagnosed with early or advanced disease continues to suggest that improving diagnostic pathways may be one strategy to improve outcomes in the absence of screening.
Most women diagnosed with ovarian cancer present with nonspecific symptoms such as abdominal bloating, pain, fatigue, and altered bowel habits and urinary frequency. 4 –7 The nonspecific nature of these symptoms can lead to delays in seeking help, primary care referral, and diagnosis of ovarian cancer. 8 Women with ovarian cancer have identified diagnostic delay as a significant issue, 9,10 which can negatively impact clinical and psychosocial outcomes. 11 –13 Faster time to diagnosis in symptomatic women is associated with reduced psychological distress and anxiety and increased satisfaction with care. 13 However, a recent case-control study from Australia found an increased number of general practitioner appointments before diagnosis for women with ovarian cancer compared with controls, and 25% attended a hospital emergency department (ED) in the month before diagnosis, suggesting there are opportunities for more timely care for women diagnosed with this cancer. 14
Previous literature reviews have examined ovarian cancer symptoms, 7,15 experience of diagnostic delay and factors influencing time to diagnosis, 8,15 and the association between delay and outcomes in gynecological cancers in general. 16 The most recent systematic review to report on the relationship between diagnostic intervals and ovarian cancer outcomes included literature published almost a decade ago, up to November 2013. 11 Findings from this review were consistent with an earlier review for gynecological cancers in general: most studies show no association between time to diagnosis and ovarian cancer outcomes. 16 Others have noted 17 that most studies included in previous reviews were conducted before the development of clear recommendations for assessing and reporting diagnostic intervals, resulting in variation in interval definitions including their start and end points. The Aarhus Statement, published in 2012, provides standardized definitions of diagnostic intervals and the time points that mark their beginning and end. 18 A recent systematic review of research investigating diagnostic intervals for colorectal cancer identified multiple limitations in the analytic approach used to examine relationships between intervals and outcomes, restricting interpretation of results. 19 Key limitations identified by that review 19 include arbitrary categorization of intervals assessed, lack of adjustment for potential confounders in analyses, and failure to use appropriate analytic methods to account for the waiting time paradox 20 —where patients with shorter intervals have higher mortality which may reflect patients with alarm symptoms and more advanced disease being investigated more rapidly. No study included in earlier reviews investigating diagnostic intervals for ovarian cancer has attempted to account for the waiting time paradox. In addition, no previous review has attempted to summarize findings relating to the length of intervals associated with the diagnosis and treatment of ovarian cancer.
To address these gaps, this study aims to systematically review intervals to ovarian cancer diagnosis and treatment and provide an updated assessment of the relationship between the length of these intervals and clinical and psychological outcomes for ovarian cancer. Thus, the study provides insight into how quickly women are diagnosed and treated, and contemporary evidence of the nature of the relationship between interval length and ovarian cancer outcomes.
Method
The protocol was registered in PROSPERO (CRD42020207655). The PRISMA (Preferred Reporting Items for Systematic Reviews and Meta-Analyses) checklist was used for reporting. 21,22
Search strategy
Medline, EMBASE, and EmCare databases were searched by combining index terms and text words relating to ovarian cancer and time to diagnosis and treatment (see Supplementary Table S1 for search strategies for each database). Database searches were conducted for papers published between January 1, 2000 and November 1, 2021 with the search subsequently updated till August 9, 2022. Reference lists of included papers were searched to identify other potentially eligible papers.
Eligibility criteria
Eligible studies were original research articles of any study design published in English. Studies had to report a quantitative measure of at least one interval in the pathway from first symptom to first treatment for adults (aged 18 years or older) with a diagnosis of primary ovarian, peritoneal, or fallopian tube cancer. Studies were also included if they reported assessment of association between an interval measure and clinical outcome (survival, stage of disease), quality of life, or psychological distress.
Studies were excluded if the interval measure was not assessed quantitatively or if the study targeted children or adolescents (aged <18 years). Studies reporting on pregnancy-related cancers, screen-detected cancers, or assessing a biomarker for ovarian cancer were also excluded.
Data screening, extraction, and analysis
R.B., V.W., D.O.S., and S.D.-S. screened abstracts and full-text papers to assess eligibility against the criteria. Each abstract and article was assessed by two reviewers independently, with disagreements regarding eligibility resolved through discussion or referral to a third reviewer. A data extraction form was developed to extract the following information from each eligible article: author, year of publication, study design, aim, country of study, study period, eligibility criteria, study sample (including ovarian cancer type/subtypes, age of participants), sample size, interval definition, data source for time interval, and measures of length of interval. For papers assessing associations, measures of association with outcomes, statistical model used, and any confounders adjusted for were extracted. Data for each article were extracted by two reviewers with disagreements resolved through discussion. Review screening and extraction was conducted using Covidence. 23
Risk of bias assessment
The Aarhus statement 20-item checklist was used to assess the quality of reporting of interval data. 18 This captured features such as how timepoints and intervals were defined, biases, complexity, and theoretical considerations for date or interval data, instrument characteristics for studies utilizing questionnaires for data collection, and clarity of data descriptions for studies using medical audit or databases. Items from the preliminary risk of bias in nonrandomized studies of exposures (ROBINS-E) tool, July 2017 version, were used to assess the risk of bias for association studies. 24 Additional items were assessed regarding time interval-specific factors, such as consideration of the wait-time paradox and adjustment for outliers, 11 before determining the overall risk of bias. We also assessed overall risk of bias of interval measurement based on the Aarhus checklist responses. 18
Data synthesis
A narrative synthesis was conducted as meta-analysis was not possible owing to heterogeneity of study designs and outcome measures. For studies examining associations, we summarized the direction of the association in tables, similar to previous reviews. 11
Results
In total, 4,862 unique citations were identified and screened. After review of 110 full text papers, 65 papers from 58 separate cohorts (datasets) were eligible for inclusion (Fig. 1). 4 –6,12,25 –85

PRISMA study flow chart of papers through the screening and selection process. PRISMA, Preferred Reporting Items for Systematic Reviews and Meta-Analyses.
Study characteristics
A summary of the key features of included articles are shown in Table 1, with details of individual studies in Supplementary Table S2.
Summary of Study/Article Characteristics
Multiple responses will not add to 100%.
Most papers were published after 2015, and just under half were from the United Kingdom (22% of all studies) or North America (24%). Cohort designs were common and most papers included at least 100 cases. Stage of disease of participants was not reported in 16 papers (25%) however, when reported, disease stage at diagnosis was most commonly advanced (III/IV) (see Supplementary Table S2). Five main data sources were utilized for generating intervals, with medical records the most common (44% of 58 studies), followed by patient self-report survey or interviews (32%), registries (21%), and administrative data (14%). Of the studies that collected data from patients, response rates varied from 38% 4 to 93%. 81
Intervals
Thirty-five papers (54% of 65) reported only one interval, 22 reported data for 2–3 intervals, and eight reported on four or more intervals (Table 2). Interval duration was most commonly reported in days or months, and summarized as the mean or median, with the median being predominant (Table 2).
Summary of Interval Characteristics a
Percents may not add to 100 due to rounding.
Multiple response allowed; will add to more than 100%.
IQR/IQI, interquartile range/interval; SD, standard deviation.
Twenty-six unique types of intervals were reported. Interval details for individual studies are provided in Supplementary Table S3, and a summary of the length of the nine most commonly reported intervals is provided in Figure 2. The number of studies reporting each of the six main Aarhus intervals are shown in Table 3. The most common intervals reported were the patient (symptom to presentation, n = 23) and diagnostic (presentation to diagnosis, n = 22) intervals. However, even for these intervals, definitions of start and endpoints varied across papers making it difficult to determine consistency. Patient-reported data were less common in studies reporting secondary care and referral to hospital intervals. The median interval based on patient-reported data varied more widely than that based on medical record/administrative datasets.
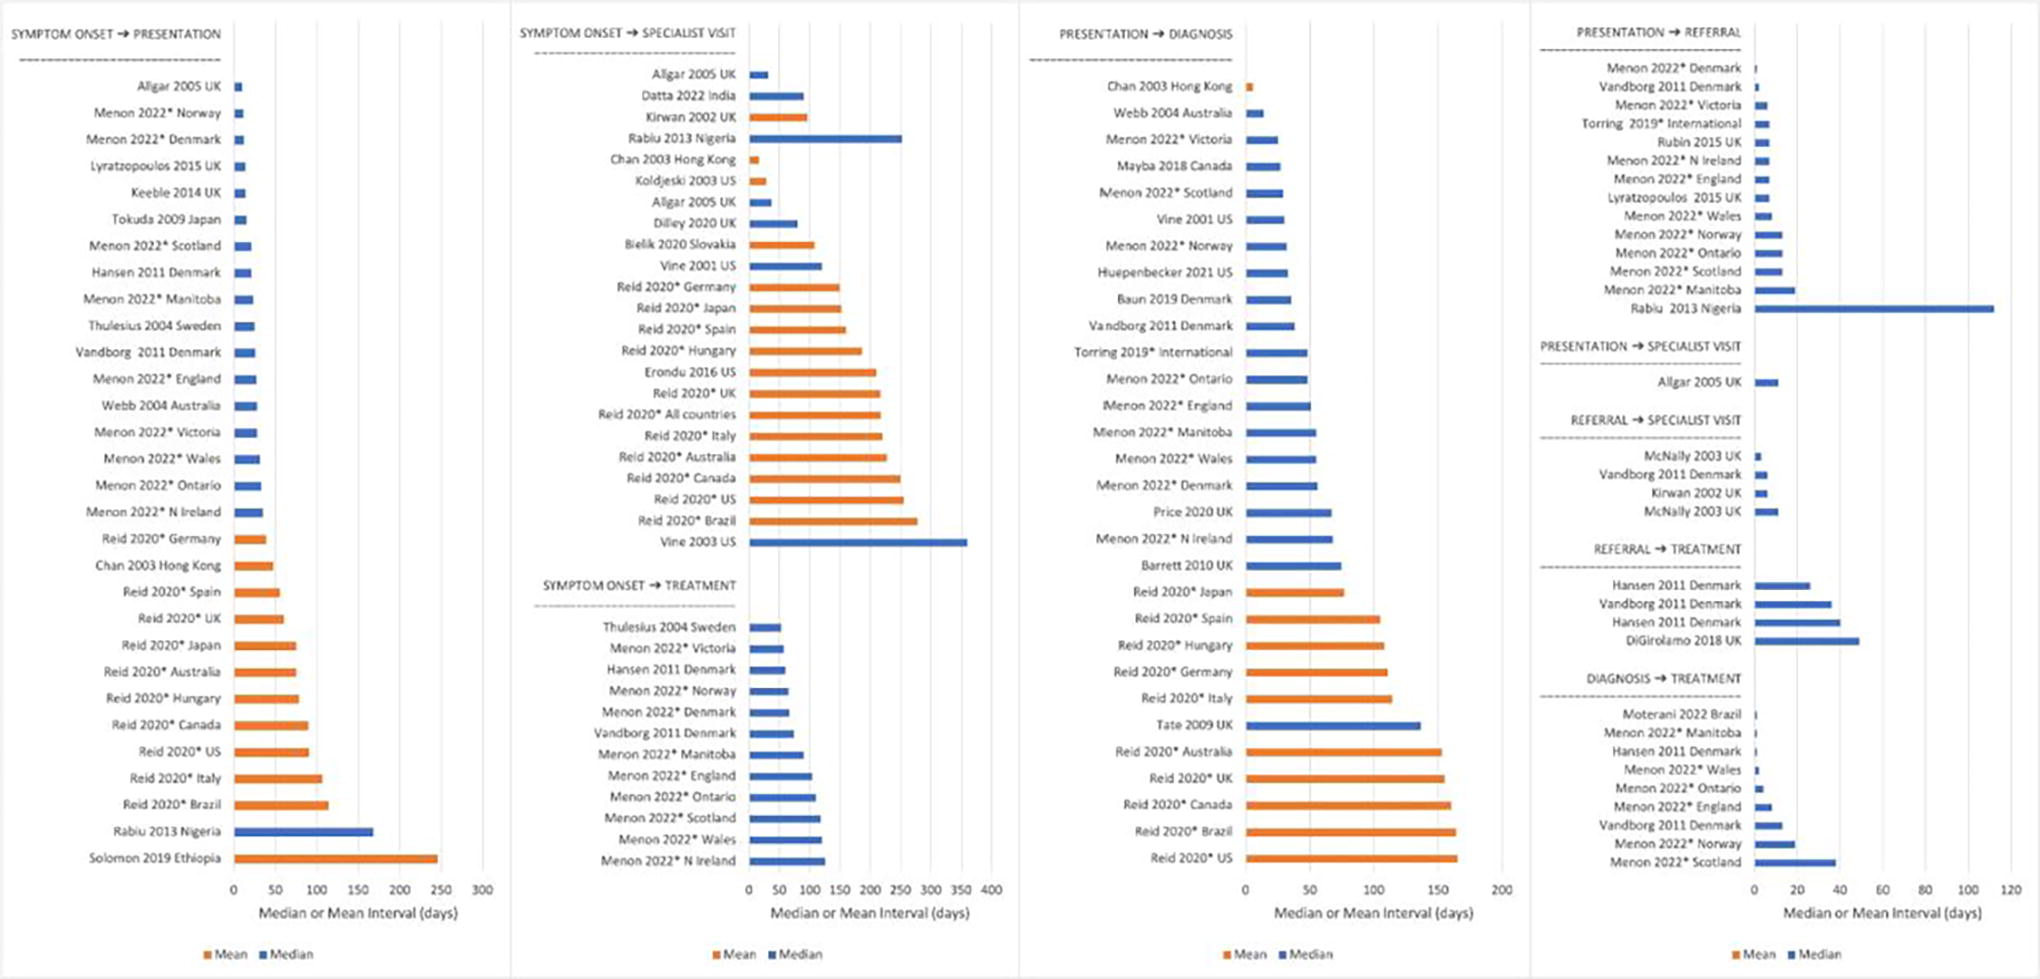
Diagnostic intervals for ovarian cancer reported across studies (studies reporting by subgroups excluded). Bars represent the interval length: orange bars represent intervals summarized as the mean, and blue bar represents intervals summarized as the median. First author, year, and country for each study is presented on the Y-axis. A star (*) indicates studies that included data from multiple countries.
Number of Papers Reporting the Six Most Common Intervals, Number Using Patient Data, and Range of Medians (in days) Reported for Patient Data and Medical Record/Administrative Data
Studies may have also included data from medical records/registries and/or data from doctor surveys.
Only using patient-reported data.
Only one study presented relevant data.
For the patient interval, median time ranged from 7 days for patients surviving more than 18 months in a UK study 47 to 168 days in a Nigerian study 63 (Fig. 2). Median diagnostic interval length ranged from 7 days for Canadian patients presenting to an ED 51 to 270 days for patients with borderline, early-stage disease from the United States 81 ; whereas the mean ranged from 5.5 days in a Hong Kong study 34 to 165 days for US participants in an international study. 64 Mean and median time from presentation to referral, the primary care interval, was within 30 days for most studies.
Association studies
Twenty studies assessed associations between an interval and an outcome, with the vast majority (n = 19) exploring associations with survival and/or stage; whereas only one examined quality of life outcomes. 12 (Table 4 and Supplementary Table S4). Of the nine studies (45% of association studies) reporting multivariable analyses, six adjusted for variables on the causal pathway for survival, with control variables including stage of disease, treatment, and diagnostic pathway (see Supplementary Table S4). Six studies attempted to account for the wait time paradox in their analyses most commonly by stratifying analyses by stage or ED presentation (Table 4).
Summary of Association Study Analyses
May not add to n or 100% as papers could report more than one analysis method.
Other intervals: Symptom onset to telling others; Time taken for gynecological-oncologist team to make a diagnosis and formulate a treatment decision; Symptom duration to imaging for disease; Decision to treat to starting treatment Total diagnostic = 1 article no association examined for this interval, though it is included in descriptive summary.
The diagnostic interval was the most common exposure variable, followed by the patient interval and total diagnostic interval. Stage at diagnosis was the most common outcome, with most (10 of 12 papers) categorizing stage as early (I/II) versus advanced (III/IV) for analysis. The study looking at quality of life assessed association with total interval (symptom to first treatment). Multivariate regression models were used in nine of the 20 papers. Most models adjusted for variables on the causal pathway between exposure and outcome or postexposure variables. For example, when examining the association between time from first symptom to diagnosis, and survival, some models included treatment type.
For the five intervals examined by at least three papers, the direction of effect estimates largely indicated no relationship between an interval length and outcome (Table 5). Findings were similar for papers that analyzed data with or without consideration of the wait-time paradox.
Summary of the Direction of Association for the Five Most Common Intervals
ED, emergency department presentation.
Aarhus criteria: moderate risk of bias.
ROBINS-E serious risk of bias.
Aarhus criteria: serious/critical risk of bias.
ROBINS-E critical risk of bias.
Aarhus criteria low risk of bias.
ROBINS-E moderate risk of bias.
Quality of reporting and risk of bias
Reporting quality based on the Aarhus statement criteria was variable, with most papers defining intervals reasonably well, but few referring to theoretical frameworks for measurement and analysis (Supplementary Table S5). Risk of bias of association studies was largely low for participant selection and measurement of outcomes, but critical for confounding. This was largely due to lack of consideration of confounders, such as conducting univariate analysis alone, or adjustment for postexposure variables, for example, adjusting for treatment type or stage when examining the relationship between survival and time from first symptom to presentation. None of the association studies in Table 5 was judged to be low risk of bias using the ROBINS-E risk of bias tool. Five association studies 28,30,36,50,79 in Table 5 were judged to be low risk of bias using the Aarhus criteria, with eight assessed as serious/critical of bias (Table 5).
Discussion
Our systematic review identified 65 papers reporting diagnostic or treatment intervals for women diagnosed with ovarian cancer from 58 studies, indicating substantial work in this area, particularly since 2015. Most papers assessed only one interval, most commonly the patient or diagnostic interval rather than examining the entire diagnostic process. Estimates for these two intervals varied, with median patient intervals ranging between 7 and 168 days, and median diagnostic intervals ranging between 14 and 270 days. Different start and end points used to determine intervals, variations in data collection methods, and variation in study populations makes combining data across studies difficult. Twenty studies examined the relationship between diagnostic intervals and patient outcomes, most commonly survival or diagnostic stage. Most found no association with these outcomes, which is in line with previous findings. 11 However, as most of the association studies were assessed as having poor methodological quality, strong conclusions in this area are difficult to draw.
With the majority of women diagnosed symptomatically with ovarian cancer not surviving 5 years, 3,86 –88 there is interest in understanding factors associated with time to diagnosis, with the expectation that earlier diagnosis may improve outcomes. This focus likely reflects the number of studies in our review assessing the patient interval, the time from first symptom to presentation. Our review found wide variation in this period, with longest intervals found for the two studies from African countries. As the authors of these papers note, reasons for delay are multifactorial and may be due to a lack of knowledge about ovarian cancer and symptoms among women and health care practitioners, use of traditional healers, and inadequacies in the health system. 63,69 Excluding these two studies, variation in the length of the patient interval was more modest. Preference for reporting means rather than medians is a key factor leading to greater estimates of delay across all intervals. As the distribution of responses for all intervals tends to be right skewed, using means to report interval data will tend to result in longer summary intervals. Median scores may therefore be more appropriate as summary measures of diagnostic intervals.
Patient interval estimates derived from surveys of women were generally longer and showed greater variation than those determined from medical record data. Multiple factors may contribute to these differences, including imperfect recall and hindsight bias in survey data where, once diagnosed, respondents review and reconsider the timing of symptom onset. Although multiple studies reported using trained and experienced interviewers to collect patient data through interview, none discussed use of methods to reduce imperfect recall in their data. In addition, medical record data may be influenced by the reporting practices of doctors that tend to round intervals to simpler categories of duration (e.g., weeks or months) and focus on red flag symptoms 89 that might also work to shorten the patient interval recorded in medical records. The difference may also be a consequence of the waiting time paradox, 20,79 where a subset of people with more advanced disease are more likely to present with alarm symptoms and are diagnosed more quickly than those presenting with less advanced disease. As survival is poorer for those with advanced disease, they may be underrepresented in patient surveys and therefore interval estimates from these surveys tend to exclude these more rapidly diagnosed, poorer prognosis cases. The wide range of patient intervals considered, and differences between estimates based on patient self-report and those derived from medical records, makes it difficult to draw conclusions, other than that it is difficult to assess this interval when symptoms are hard to characterize and often lack an “alarm” factor. 8
Unlike for other cancers, 17,90 only four studies reported the interval between diagnosis and treatment. This finding most likely reflects that for many women, ovarian cancer is diagnosed as a consequence of surgery, hence diagnosis and first treatment occur simultaneously. Similar to reviews of diagnostic intervals for other cancers, 17 we found a limited number of studies assessing the interval between referral and treatment. In contrast, 22 studies assessed the diagnostic interval (first presentation to diagnosis), which compares favorably to a recent systematic review on diagnostic intervals for colorectal cancer that found this interval to be reported in 10 of 55 studies. 17 Although most studies assessing secondary care intervals used medical records/administrative data, the diagnostic interval was most commonly determined using patient reported data. Estimates of this interval were substantially longer when determined by patient report compared with medical record data. Median diagnostic intervals ranged from 2 to 13 weeks according to patient reports, but 1–19.5 weeks when determined through medical record/administrative data. Whether this difference reflects imperfect recall, or a wider range of experiences captured by the larger number of studies using patient reported data, is not clear. Multiple studies have suggested the referral pathway can be complex for at least a significant minority of ovarian cancer patients, 14,30,45,51,66 with multiple factors including misdiagnosis, nonurgent referral, and referrals to nongynecological specialties associated with diagnostic delay. 8 These complex pathways may be better captured by looking at the system interval described in the Aarhus statement which captures the time between the first investigation of the presenting problem to first treatment. 18
Currently, there is a lack of consistent evidence regarding the impact of diagnostic delays on cancer outcomes for ovarian cancer. A 2015 review found only four studies had looked at associations between diagnostic intervals and patient outcomes, with stage and survival outcomes the focus. 11 That study found no evidence of an association between diagnostic delay and ovarian cancer outcomes but noted that conclusions were limited owing to no study accounting for the wait-time paradox. Our review identified 20 studies examining associations between diagnostic intervals and outcomes, suggesting increased interest in this area. However, similar to conclusions reached by that earlier review, most studies exploring this question were judged to have a moderate or higher risk of bias making it difficult to draw firm conclusions. Of the five studies we assessed as having low risk of bias on the Aarhus criteria, 28,30,36,50,79 all found no association between the interval and outcome they examined. Confidence in the conclusions from these studies is strengthened by noting that four explicitly accounted for the wait-time paradox by either stratifying analyses by stage 28,36,50 and/or using nonlinear analytic models. 28,79 The low number of high-quality studies, and the limited number of outcomes explored suggests further work is needed before firm conclusions, a lack of association or otherwise, can be drawn.
Six of the association studies adjusted for potential mediators on the causal pathway between length of diagnostic intervals and cancer survival, particularly stage and treatment. The length of diagnostic intervals might affect stage and the treatment received, and both are strong determinants of survival. Adjusting for these variables will bias associations between diagnostic intervals and survival to the null. 91,92 Similar issues have been identified in the analyses examining associations between diagnostic intervals and survival outcomes for colorectal cancer. 19 Disease stage and treatment should be considered as mediators rather than confounders in analyses, since confounders must affect diagnostic intervals rather than the other way round. 92
Recent findings of no long-term mortality benefit from ovarian cancer screening 3 suggests that diagnosis of this cancer will continue to be through symptomatic presentation. Although the lack of an overall survival benefit from screening may suggest limited benefits of earlier diagnosis, it may also reflect limitations in current screening protocols as, despite multimodal screening resulting in a stage shift from stage IV to stage I, the majority of cancers detected in the screening arms were still stage III or IV at diagnosis. 3 The authors note that the 10% reduction in stage III or IV cancers found in this trial is likely to be insufficient to reduce mortality given work relating to breast cancer screening suggests diagnosis of stage III and IV disease needs to reduce by at least 20% for mortality reductions. 3 Despite the stage shift found for multimodal screening, mortality rates increased in this arm for Stage I cancers, suggesting that cancers with a poor prognosis were being detected at the earlier stage. Current treatment may be unable to improve outcomes for these cancers despite being found at an earlier stage of diagnosis. 3 Advances in treatment of ovarian cancer may be needed to improve the outcomes for ovarian cancer, even those diagnosed with early-stage disease. Indeed as most cases in the UK screening trial were diagnosed and treated before widespread uptake of recent advances in ovarian cancer treatment, impact of these advances on outcomes is not known. 3
This review has a number of strengths including the large number of papers included, making it the largest review to assess diagnostic intervals for ovarian cancer. We examined intervals across the diagnostic period, enabling an assessment of the intervals most and least commonly assessed. We reviewed a broad range of studies, including those that assessed intervals through patient report, medical record review, and/or administrative data sets. This enabled a comparison of the different results found using different data collection methods. Finally, we explored associations between intervals and outcomes and used the Aarhus Statement, designed to improve reporting of diagnostic intervals in research, to assess methodological quality. However, some limitations also need to be acknowledged. We did not attempt to conduct a quantitative summary of interval data owing to the heterogeneity of definitions used to define the start and end of time periods across studies. We focused on studies reported in English so papers from non-English journals are missing from our review. This means our results are likely to reflect the diagnostic experiences of people from high-income countries, which, as the findings from the two studies from African countries suggest, is likely to be different from low- and middle-income countries. Finally, while our search terms were broad and enabled the identification of a large number of papers, some papers may have been missed.
Conclusion
The lack of an effective screening program and improvements in survival for ovarian cancer have led to a focus on better understanding and identifying potential strategies to improve diagnostic pathways for this cancer. Our review shows most work has focused on understanding the patient interval and the diagnostic interval, reflecting interest in identifying strategies to improve both of these intervals. However, the wide variety of definitions used to identify different intervals, the mix of means and medians to summarize intervals and high prevalence of moderate-to-high risk of bias across studies and limitations in analytic methods mean it is difficult to develop meaningful conclusions. To enable a better overall understanding of the diagnostic intervals people with ovarian cancer experience, greater utilization of the Aarhus statement to define intervals and greater use of appropriate analytic methods, including use of nonlinear analytic methods to account for the waiting time paradox, are needed.
Registration
The protocol was registered in PROSPERO (CRD42020207655).
Footnotes

Authors’ Contributions
R.B.: Designed the work; developed and undertook literature searches; and undertook screening, data extraction, synthesis, and interpretation; and drafted the article. D.S.: Assisted with literature searches; screening; data extraction; and synthesis. S.D.S.: Assisted with literature screening; data extraction; and synthesis. J.E.: Contributed to study design; data interpretation; and drafting article. D.E.: Contributed to study design; data interpretation; and article drafting. R.L.M.: Contributed to study design; data interpretation; and article drafting. V.W.: Contributed to study design; screening; data extraction; synthesis and interpretation; and article drafting. All authors approved the final version and agreed to be accountable for all aspects of the work.
Author Disclosure Statement
All authors declare they have no competing interests to declare.
Funding Information
This work was supported by a NHMRC Partnership grant (
Supplementary Material
Supplementary Table S1
Supplementary Table S2
Supplementary Table S3
Supplementary Table S4
Supplementary Table S5
References
Supplementary Material
Please find the following supplemental material available below.
For Open Access articles published under a Creative Commons License, all supplemental material carries the same license as the article it is associated with.
For non-Open Access articles published, all supplemental material carries a non-exclusive license, and permission requests for re-use of supplemental material or any part of supplemental material shall be sent directly to the copyright owner as specified in the copyright notice associated with the article.
