




Abstract
Introduction:
We investigated associations of menopausal age category with body mass index (BMI), waist circumference, waist–hip ratio, and waist–height ratio. We also explored the moderating effect of anthropometric measures on associations of menopausal age category with prespecified sex hormones: estradiol, dehydroepiandrosterone (DHEA), sex hormone-binding globulin, bioavailable testosterone, and total testosterone–estradiol (T/E) ratio.
Methods:
In this cross-sectional study, we included 2,436 postmenopausal women from the Multi-Ethnic Study of Atherosclerosis who had menopausal age, anthropometric, and sex hormone data at baseline. Menopausal age was categorized as <45 years (early menopause), 45–49 years, 50–54 years (referent), and ≥55 years (late menopause). Linear models were used for analysis.
Results:
The mean (standard deviation) age was 64.7 (9.2) years. After multivariable adjustment, women who experienced late menopause had higher waist circumference (2.28 cm), waist–hip ratio (0.013 units), and waist–height ratio (0.014 units) but not BMI than those in the referent category. The interaction terms between menopausal age category and anthropometric measures were not significant for prespecified sex hormones (all Pinteraction >0.05). When compared with the referent category, T/E ratio was 21% (4.72 − 39.8%) higher among women with late menopause while DHEA levels were 9% (1 − 16%) higher among women who experienced menopause between 45 and 49 years in multivariable adjusted models.
Conclusion:
Women with late menopause had higher abdominal adiposity but not generalized adiposity when compared with those who experienced menopause between 50 and 54 years of age. Androgenicity was higher among women who experienced menopause between 45 and 49 years of age and those with late menopause, based on DHEA and T/E ratios, respectively.
Introduction
The relationship between body weight and menopause is complex and possibly bidirectional. Underweight women are more likely to experience menopause at earlier ages, while women with excess adiposity more frequently have late menopause. 1 The menopausal transition itself causes hormonal changes such as elevations in follicle-stimulating hormone levels, which contribute to alterations in whole-body and regional adipose tissue accumulation. 2 Specifically, alterations in the hypothalamic–pituitary–ovarian axis that begin during the menopausal transition lead to increases in generalized and visceral adipose tissue deposition. 3 Changes in estradiol (E2) levels during perimenopause also affect homeostatic pathways that regulate food intake and energy expenditure, lipid storage and metabolism in adipose tissue, insulin sensitivity, and adipokine secretion. 2,3 This creates a complex dynamic because adipose tissue is a major source of estrogenic and androgenic steroids in postmenopausal women. 4
Adiposity increases across all body regions in postmenopausal women, but there is greater deposition in the central body areas when compared with peripheral body sites. 2 Adiposity also increases with age, but the onset of menopause characteristically alters the impact of aging on adipose tissue distribution. 5 These changes are important because body mass index (BMI), waist circumference (WC), waist–hip ratio (WHR), and waist–height ratio (WHtR) are known predictors of cardiovascular disease (CVD) and premature death. 5
Despite prior studies showing associations between menopausal age and CVD, 6,7 the independent associations of menopausal age with anthropometric measures and sex hormones have not been studied in detail. This is important because anthropometric measures such has BMI, WC, and WHR have been associated with sex hormone levels. 8 The goals of this study were to investigate the associations of menopausal age category with indicators of generalized adiposity (BMI) and abdominal adiposity (WC, WHR, and WHtR) using data from the Multi-Ethnic Study of Atherosclerosis (MESA). We also examined the associations between menopausal age category and prespecified sex hormones; E2, dehydroepiandrosterone (DHEA), sex hormone-binding globulin (SHBG), bioavailable testosterone (bioT), and total testosterone–to–estradiol ratio (T/E ratio), exploring whether these associations differ by anthropometric measures. We hypothesized that menopausal age influences body size and that body size modifies the relationship between menopausal age and sex hormones in postmenopausal women. Addressing these questions could provide mechanistic insights into the links between menopausal age and CVD.
Methods
Study population and sample
The MESA study included 6,814 participants (3,601 women) of White (38%), Black (28%), Chinese (12%), and Hispanic/Latino (22%) origins, between 45 and 84 years of age, and without clinical CVD who were enrolled between 2000 and 2002 from six locations across the United States: Forsyth County, NC; North Manhattan and the Bronx, NY; Baltimore City and Baltimore County, MD; St. Paul, Minnesota; Chicago, IL; and Los Angeles County, CA. MESA’s design and objectives have been published. 9 The aim of MESA was to study subclinical CVD and the risk factors that predict disease progression. MESA and its sex hormone ancillary study were approved by the institutional review boards at participating sites. Informed consent was obtained from all participants. MESA data are available on reasonable request from the MESA coordinating center (mesa-nhlbi.org).
The current analysis includes postmenopausal women selected from the initial MESA cohort of 3,601 women. We sequentially excluded 563 women who had not gone through menopause, 17 women who were missing information on menopausal age, 546 women who had hysterectomy without bilateral oophorectomy before 55 years of age (due to inability to accurately estimate their menopausal age), and 39 women who were missing values for all the sex hormones, yielding a study sample of 2,436 postmenopausal women (Fig. 1).
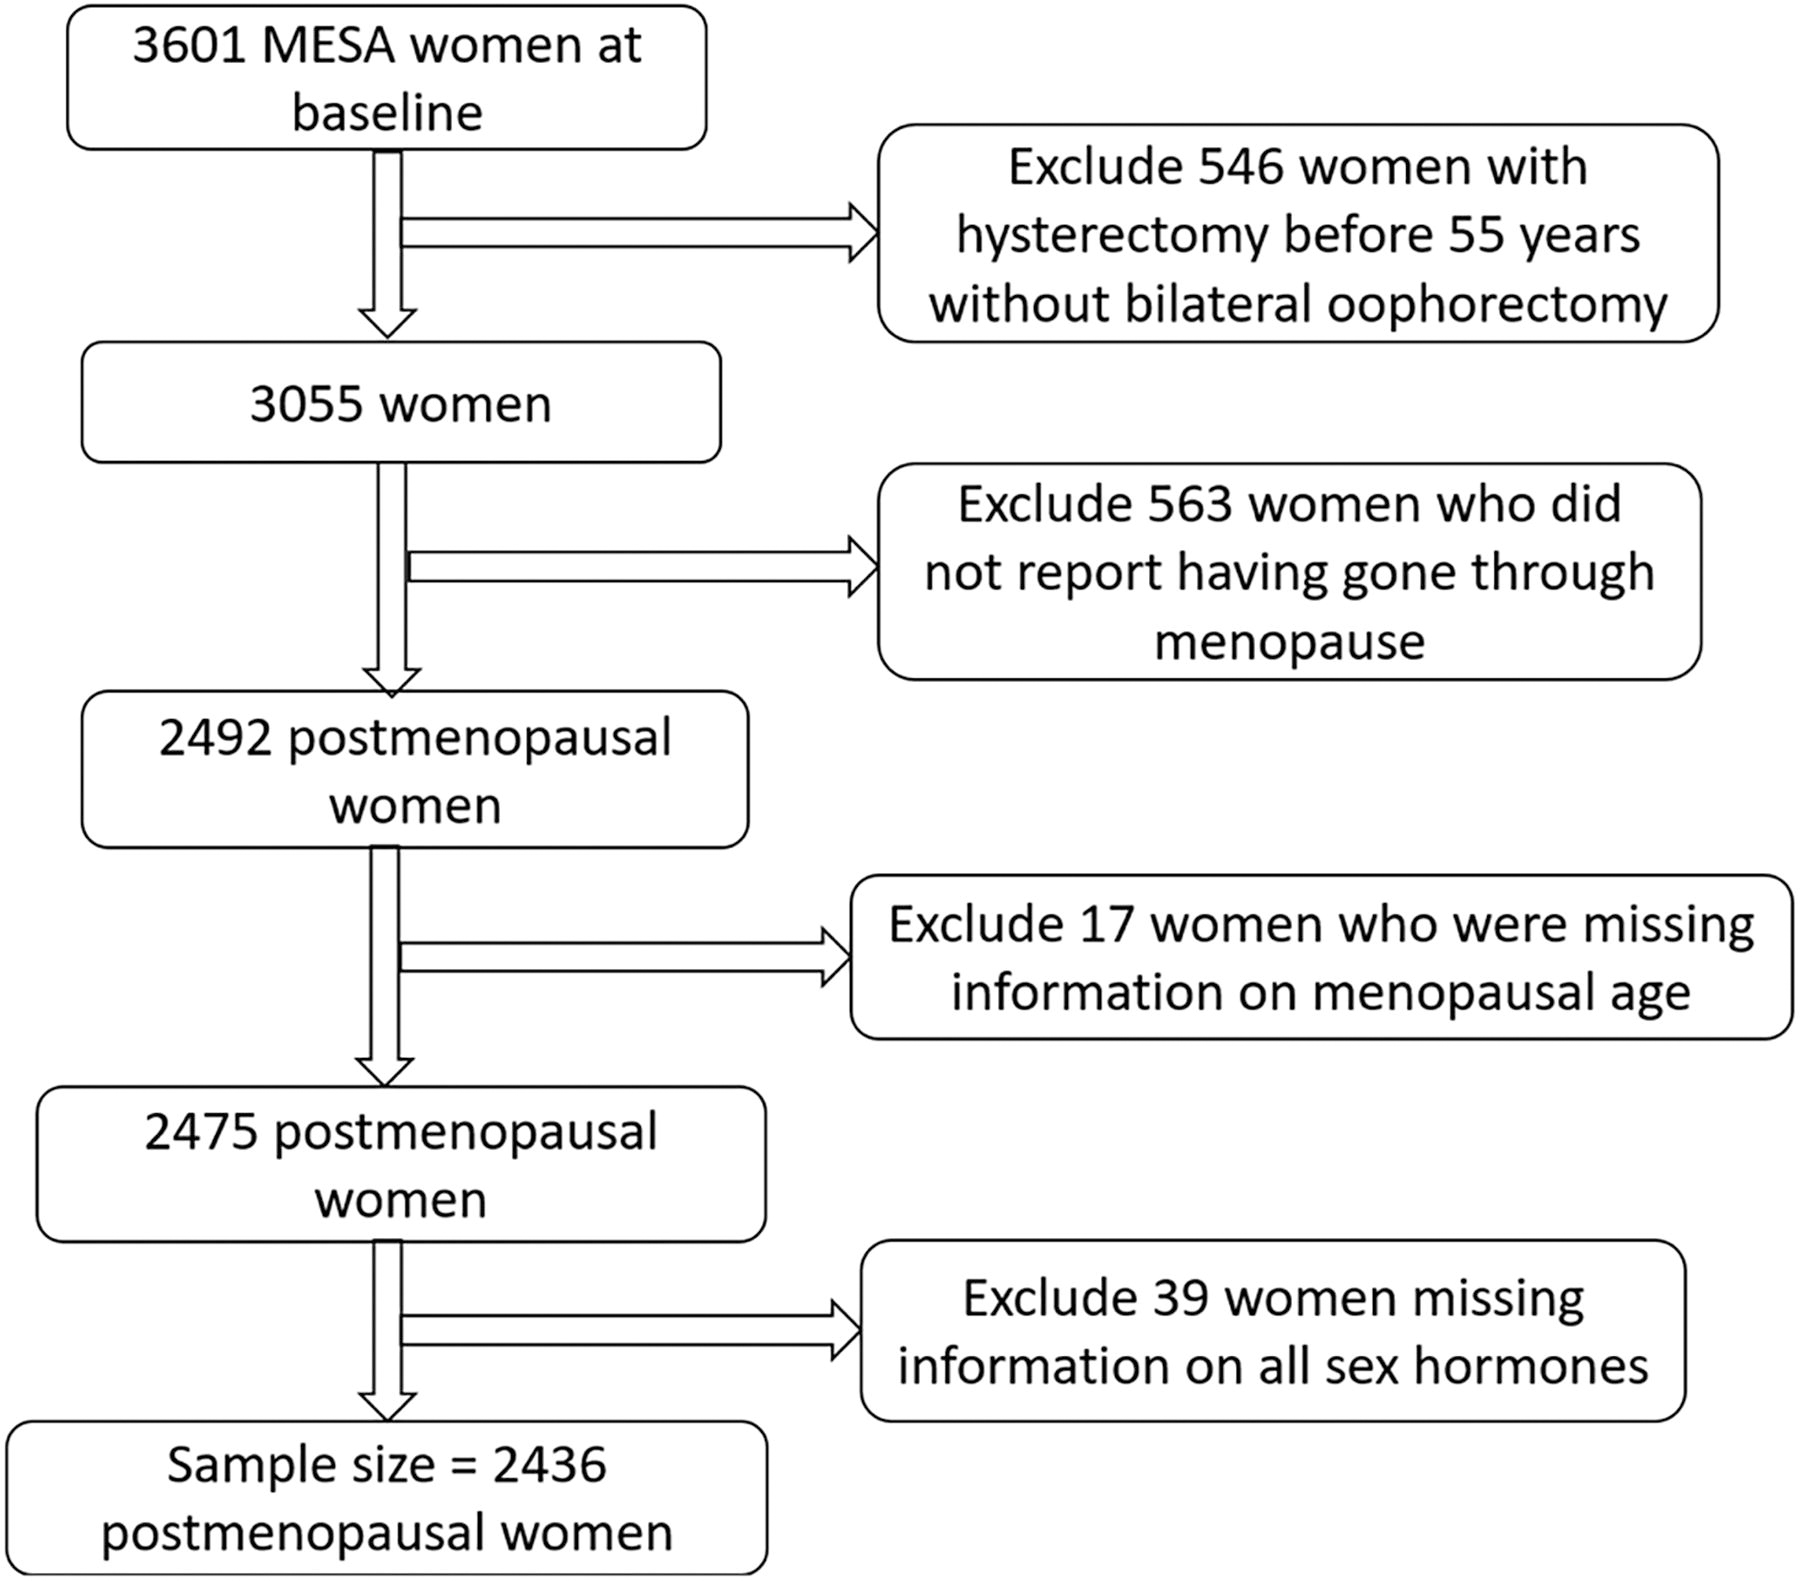
Sample size flow diagram. MESA, Multi-Ethnic Study of Atherosclerosis.
Baseline measurements
Standardized questionnaires were used to collect information on participant demographics, education, physical activity, smoking, alcohol use, medications used for controlling blood pressure, glucose, and lipids, parity, hormone replacement therapy (HRT) use (current, past, or never), HRT type (estrogen or combined estrogen and progestin), HRT duration, menopausal status, menopausal age, and type of menopause at MESA baseline. We included postmenopausal women who had either natural or surgical menopause. Menopause was indicated by self-report of amenorrhea 12 months before MESA baseline and/or a history of bilateral oophorectomy. 10 Similar to prior publications, women were categorized according to menopausal age as <45 years (early menopause), 45–49 years, 50–54 years (referent), and ≥55 years (late menopause). 7
Weight was measured in kilogram with a Detecto Platform balance scale (Webb city, MO, USA). Height was measured in meters with an Accu-Hite stadiometer (Seca, Hanover, MD, USA). WC and hip circumference were measured in centimeters across the horizontal plane at the umbilicus and widest diameter of the hips, respectively, using a Gulick II 150-cm tape measure (County Technology Inc, Gay Mills, WI, USA) while the participant was standing in light clothing and no shoes. Each measurement was obtained twice and the average value was used. BMI was calculated as weight divided by the square of height (kg/m2). WHR and WHtR were calculated by dividing WC by hip circumference and height, respectively. Blood pressure was measured on the right arm while seated at rest using a Dinamap automated device. Three readings were obtained, and the average of the second and third measurement was used.
Laboratory measures
Glucose (milligrams per deciliter) and insulin (picograms per milliliter) were measured in fasting blood samples using the glucose-oxidase and radioimmunoassay (RIA) methods, respectively. 6 Diabetes was defined as present when fasting glucose was ≥126 mg/dL or medications were used for blood glucose lowering. 6 We calculated the homeostasis model assessment of insulin resistance (HOMA-IR) as (fasting glucose [mg/dL] × fasting insulin [mIU/L])/405. Total cholesterol and high density lipoprotein cholesterol (HDL-C) were measured using the cholesterol-oxidase reaction. Serum creatinine was measured by colorimetry and used to estimate the glomerular filtration rate (eGFRcr). High sensitivity C-reactive protein (hsCRP) was measured using the immunonephelometry method (N hsCRP; Dade Behring Inc, Deerfield, IL, USA).
Sex hormones
Sex hormone concentrations were measured as part of an ancillary study from stored samples collected during MESA Exam 1 at the Steroid Hormone laboratory, University of Massachusetts Medical Center (Worcester, MA). 11 Total T and DHEA were measured directly using RIA methods. E2 was measured with an ultrasensitive RIA kit from the Diagnostic System Laboratories (Webster, TX, USA). 11 BioT was calculated as described by Södergard et al. 12 SHBG was measured using a chemiluminescent enzyme immunometric assay and kits obtained from the Diagnostic Products Corporation (Los Angeles, CA, USA). 11 The coefficients of variation for total T, DHEA, E2, and SHBG assays were 12.3%, 11.2%, 10.5%, and 9.9%, respectively. 11 T/E ratio was calculated by dividing total T by E2 and used to represent relative androgenicity.
Statistical analysis
In keeping with prior studies, menopausal age was categorized as <45 years, 45–49 years, 50–54 years, and ≥55 years. 7 Descriptive statistics were used to comprehensively characterize participants according to menopausal age category using percentages for categorical variables and means ± standard deviation (SD) or median (interquartile range) for continuous variables. We compared the groups using chi-square for categorical variables and analysis of variance or Kruskal–Wallis tests for normal and skewed continuous variables, respectively. Due to skewness, sex hormones were log transformed for the regression analysis. Linear regression models were used to examine associations of menopausal age category with predefined anthropometric measures. Because the average age of menopause in the United States is 50–52 years, 13 the 50–54 menopausal age category was used as the referent menopausal age-group. The interaction terms of menopausal age category with race/ethnicity were not significant for any of the anthropometric measures; P interaction was 0.98, 0.98, 0.34, and 0.99 for BMI, WC, WHR, and WHtR, respectively. We adopted a sequential adjustment process using clinically relevant variables: Model 1: adjusted for age, race/ethnicity and study site; Model 2: model 1, with additional adjustment for educational status, physical activity, smoking, and alcohol use; Model 3: model 2, with additional adjustment for reproductive risk factors like parity, HRT use, HRT type, HRT duration, type of menopause, and sex hormones (E2, DHEA and bioT) levels; Model 4: model 3, with additional adjustment for insulin resistance (HOMA-IR) and inflammation (hsCRP).
When the outcomes were sex hormones, we tested for interactions between menopausal age category and each anthropometric measure separately for E2, DHEA, SHBG, bioT, and T/E ratio. The interaction terms of menopausal age category with BMI, WC, WHR, and WHtR were not significant, with p interaction of (p = 0.07–0.57), (p = 0.16–0.40), (p = 0.11–0.33), (p = 0.43–0.56), and (p = 0.45–0.70) for E2, DHEA, SHBG, bioT, and T/E ratio, respectively. Consequently, we adopted a similar adjustment process that also included BMI in model 2. We performed sensitivity analyses where BMI was replaced with WC, WHR, and WHtR. We also performed sensitivity analyses for the final model (model 4) that included women with natural menopause only. Because the sex hormones were log transformed prior to analysis, we exponentiated the log transformed values derived from the models back to their natural scale. Then, we calculated the percent differences (and confidence intervals) for each sex hormone using the formula (exponent[point estimate] − 1) × 100. We plotted line graphs of the percent difference in sex hormones associated with menopausal age categories while adjusting for predefined measures of anthropometry. Statistical analysis was performed using SAS software version 9.4 for Windows (SAS Institute Inc., Cary, NC, USA). Two-sided p-values <0.05 were considered statistically significant.
Results
We included 2,436 postmenopausal women who met our study inclusion criteria. The mean (SD) age was 64.7 (9.2) years. Menopause occurred at <45, 45–49, 50–54, and ≥55 years in 19.8%, 27.8%, 36.5%, and 15.9% of women, respectively; 23.2% of the women had surgical menopause. For the overall cohort, the mean ± SD values for BMI, WC, WHR, and WHtR were 28.4 ± 6.04 kg/m2, 97.0 ± 15.7 cm, 0.908 ± 0.083, and 0.610 ± 0.101, respectively. There were strong correlations between BMI and WC (г = 0.86, p < 0.0001), BMI and WHtR (г = 0.849, p < 0.0001), WC and WHtR (г = 0.961, p < 0.0001), and moderate correlations between WC and WHR (г = 0.687, p < 0.0001), and WHR and WHtR (г = 0.719, p < 0.0001). BMI and WHR were weakly correlated (г = 0.346, p < 0.0001). The median (interquartile range) values for E2, DHEA, SHBG, BioT, and T/E ratio were 0.0734 (0.044–0.151) nmol/L, 10.3 (6.98–14.7) nmol/L, 58.9 (40.2–93.2) nmol/L, 0.208 (0.139–0.347) nmol/L, and 12.3 (5.32–23.0), respectively.
A comprehensive characterization of our study participants is shown in Table 1. Women who experienced early menopause, defined as menopause before 45 years of age, were more likely to be Black, current cigarette smokers, current HRT users, and more commonly reported prior hysterectomy or bilateral oophorectomy but were less likely to have a high school education. They also had the longest duration of HRT use and were more likely to use combined estrogen and progestin HRT preparations, as well as have diabetes mellitus, and higher BMI, WC, WHtR, E2, and hsCRP values. Women who experienced late menopause, defined as menopause occurring at or above 55 years of age were older, were more likely to have a high school education, participate in physical activity, and more commonly used antihypertensive medications but were least likely to use HRT. They also had higher systolic blood pressure but lower eGFR and DHEA levels. Women with either early or late menopause had greater WHR values than those who experienced menopause between 45 and 54 years.
Characteristics of Study Participants According to Menopausal Age at MESA Baseline
Values are presented as mean ± SD for parametric data and median (interquartile variables) for nonparametric data. Differences between the groups are analyzed using chi-square test for categorical variables and analysis of variance (ANOVA).
Kruskal–Wallis for continuous variables as appropriate. Missing values accounted for less than 3% for all variables included in the models.
DHEA, dehydroepiandrosterone; GFR, glomerular filtration rate; HDL, high density lipoprotein cholesterol; HOMA-IR, homeostasis model assessment of insulin resistance; HRT, hormone replacement therapy; L, liter; MESA, Multi-Ethnic Study of Atherosclerosis.
For the anthropometric measure outcomes, late menopause was significantly associated with measures of abdominal adiposity with beta coefficient (95% confidence interval) of 2.28 (0.088–4.48), 0.013 (0.00098–0.02), and 0.014 (0.00030–0.028) for WC, WHR, and WHtR, respectively, but not with generalized adiposity (BMI), 0.63 (−0.18 to 1.44) when compared with the referent category in multivariable adjusted models (Table 2). In minimally adjusted models (model 1, Table 3) for the sex hormone outcomes, E2 levels were 20% (8% to 32%) greater, while T/E ratios were 18% (7% to 27%) lower for women with early menopause when compared with the referent menopausal age category. When reproductive risk factors, insulin resistance, and inflammatory markers were added to the multivariable models (models 3 and 4, Table 3), these differences became nonsignificant. However, women who experienced menopause between 45 and 49 years of age had an 8% (0.68% to 15.9%) greater DHEA level, while those who experienced late menopause had a 21% (4.72% to 39.8%) greater T/E ratio, when compared with the referent menopausal age category in multivariable models that included reproductive risk factors, insulin resistance, and inflammatory markers (model 4, Table 3, Fig. 2).
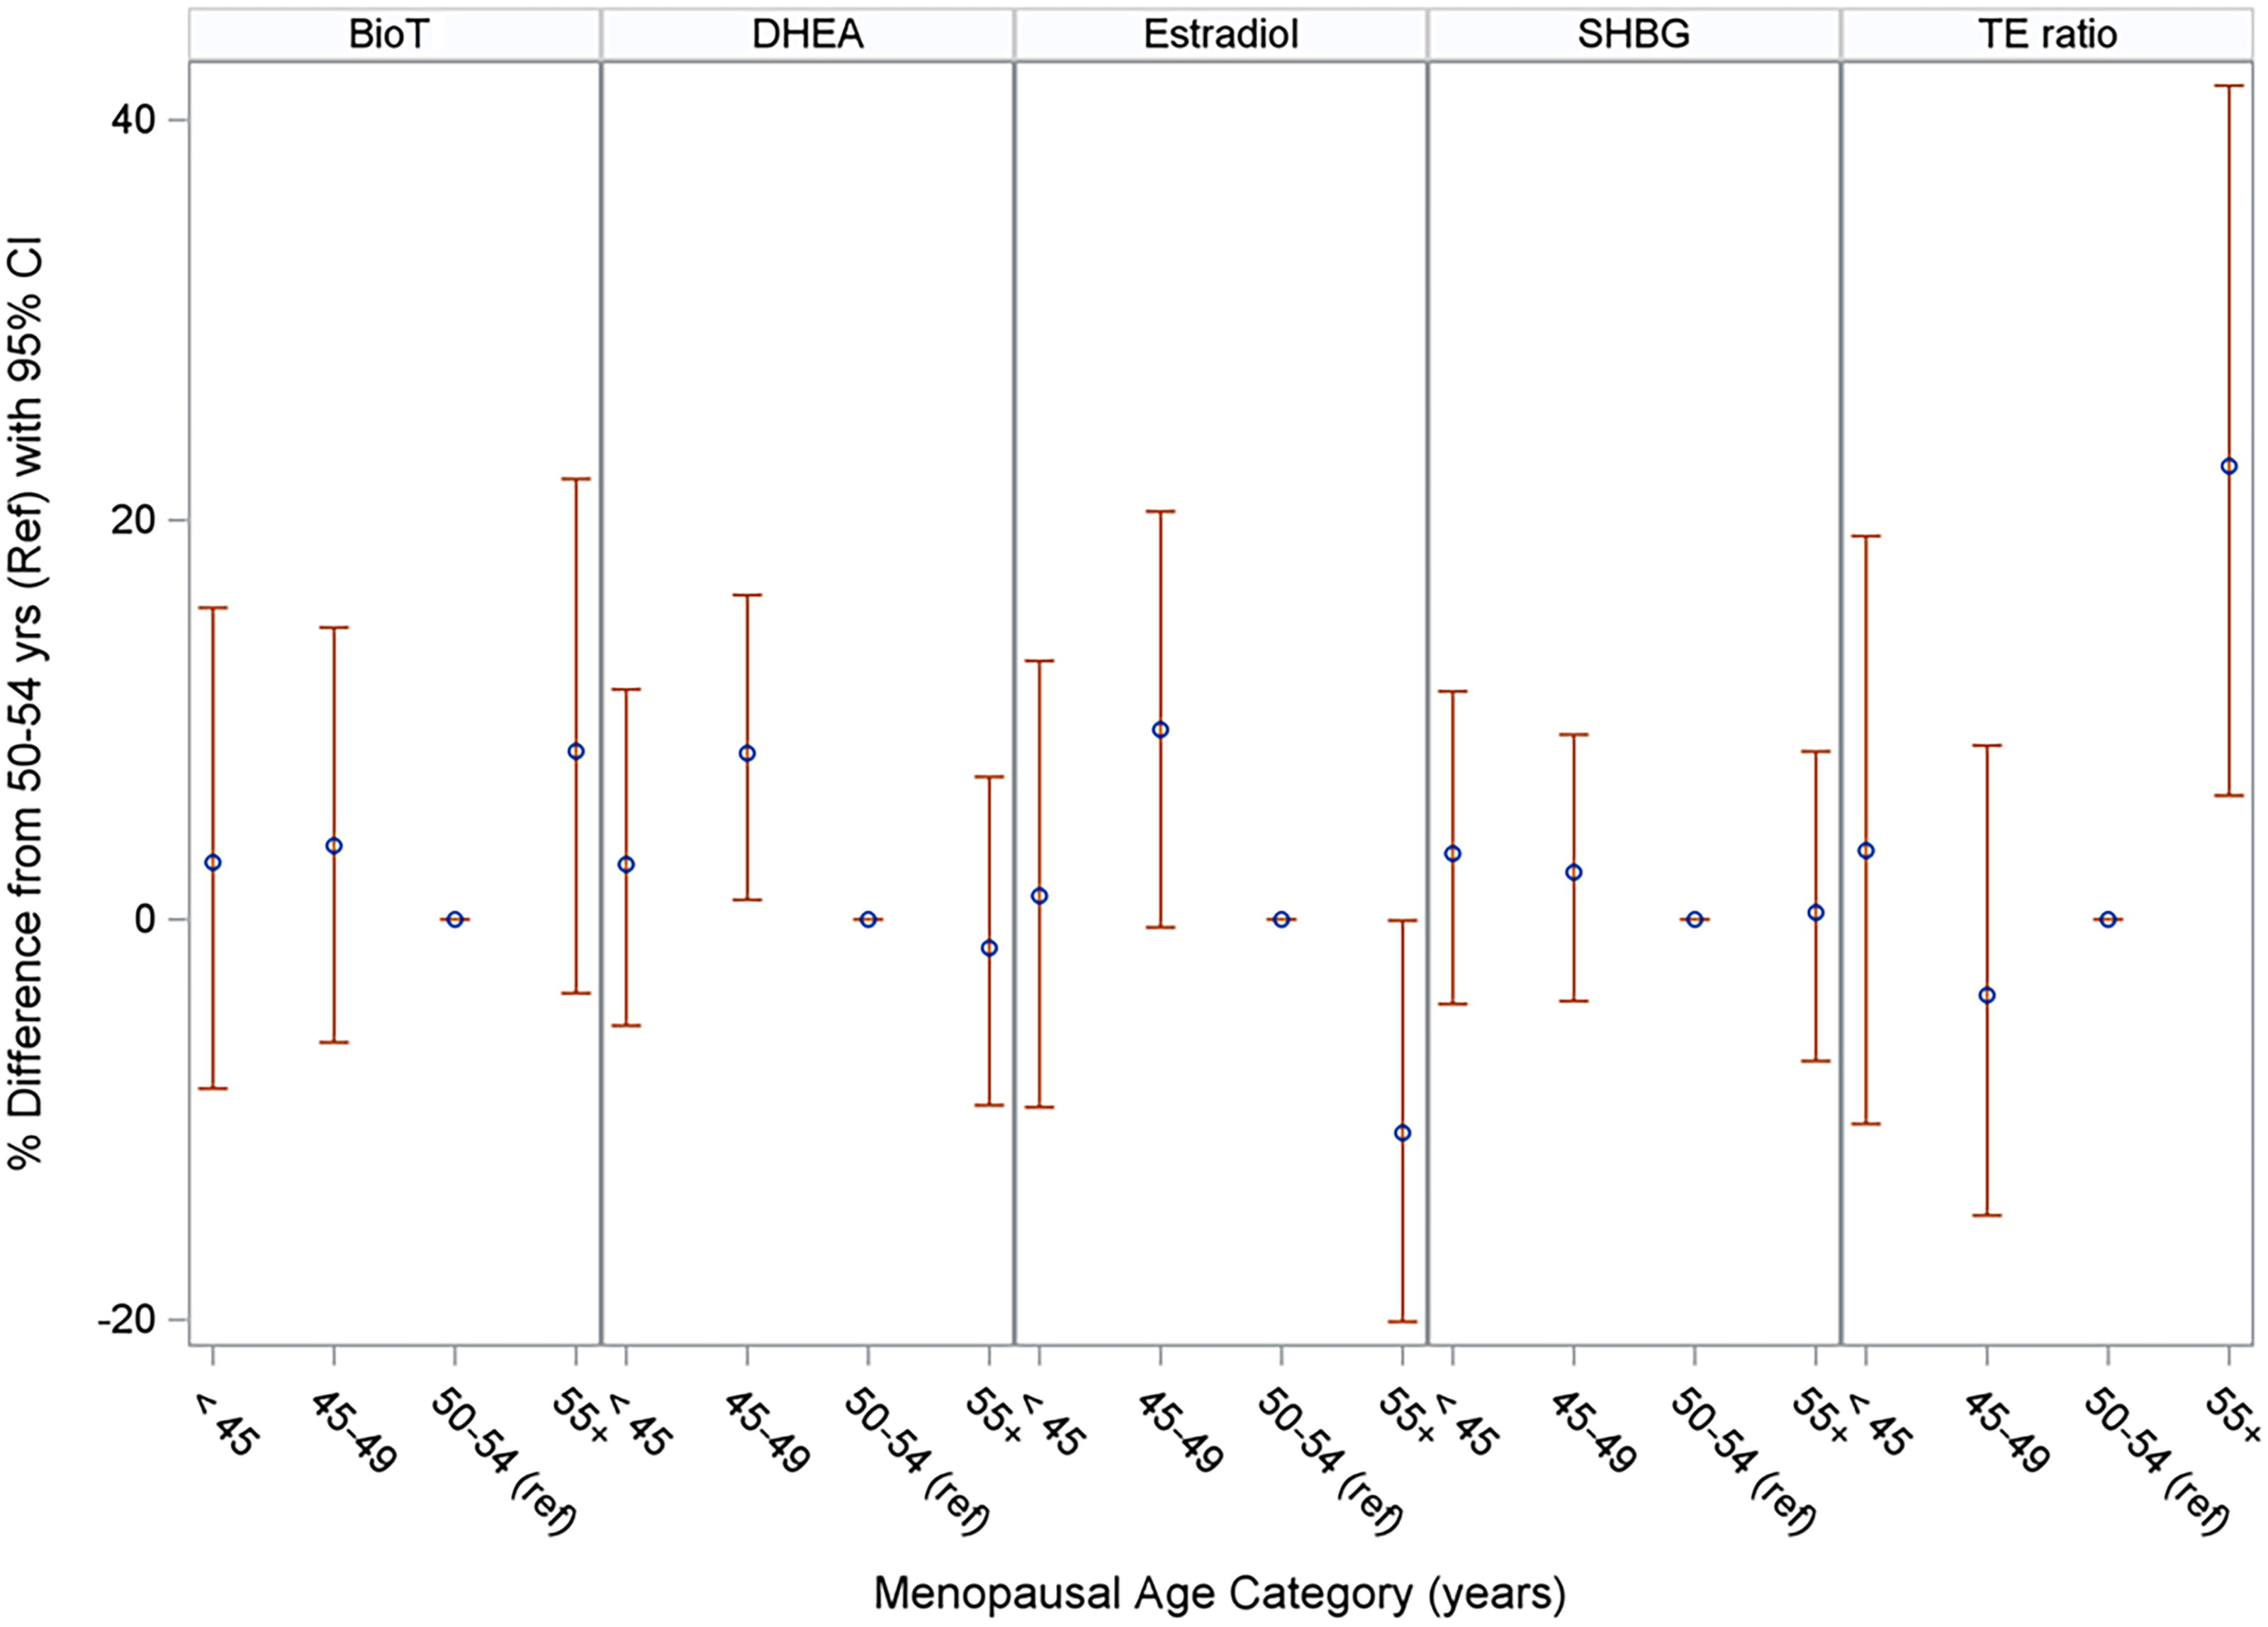
Percent difference in sex hormones associated with menopausal age categories using body mass index as the anthropometric measure. Estimates are adjusted for age, race/ethnicity, study site, educational status, physical activity, smoking, alcohol use, body mass index, parity, type of menopause, hormone replacement therapy use, type of hormone replacement therapy, duration of hormone replacement therapy use, inflammation, and insulin resistance. BioT, biotestosterone; DHEA, dehydroepiandrosterone; Ref, reference; SHBG, sex hormone-binding globulin; T\E ratio, testosterone–estradiol ratio.
Associations of Menopausal Age Categories with Anthropometric Measures at MESA Baseline
Model 1: adjusted for age, race/ethnicity, and study site.
Model 2: model 1 adjusted for educational status, physical activity, smoking, and alcohol use.
Model 3: model 2 adjusted for parity, hormone replacement therapy use, type of hormone replacement therapy, duration of hormone replacement therapy use, type of menopause, and sex hormones levels (bioavailable testosterone, estradiol, and dehydroepiandrosterone).
Model 4: model 3 adjusted for CRP, HOMA-IR.
Women who experienced menopause between 50 and 54 years were used as the referent category.
CI, confidence interval; CRP, C-reactive protein; HOMA-IR, homeostasis model assessment of insulin resistance; MESA, Multi-Ethnic Study of Atherosclerosis.
Association of Menopausal Age Category with Sex Hormones Measures at MESA Baseline with Body Mass Index as the Anthropometric Measure
Model 1: adjusted for age, race/ethnicity, and study site.
Model 2: model 1 adjusted for educational status, physical activity, smoking, alcohol use, and body mass index.
Model 3: model 2 adjusted for parity, type of menopause, hormone replacement therapy use, type of hormone replacement therapy, duration of hormone replacement therapy use.
Model 4: model 3 adjusted for CRP and HOMA-IR.
Sex hormone measures were log transformed due to skewness. Women who experienced menopause between 50 and 54 years were used as the referent category.
CI, confidence interval; CRP, C-reactive protein; DHEA, dehydroepiandrosterone; HOMA-IR, homeostasis model assessment of insulin resistance; MESA, Multi-Ethnic Study of Atherosclerosis; SHBG, sex hormone-binding globulin; T/E, testosterone–estrogen ratio.
These findings were consistent in sensitivity analyses that replaced BMI with WC (Supplementary Table S1, Fig. 3), WHR (Supplementary Table S2, Fig. 4), and WHtR (Supplementary Table S3, Fig. 5) as anthropometric measures. However, E2 levels were 10.7% (0.095–20.1%) and 10.7% (0.065–20.1%) lower among women with late menopause when compared with the referent menopausal age-group when WC and WHtR, respectively, were included in the model (model 4, Supplementary Table S1 and S3). In additional sensitivity analyses that were limited to women with natural menopause (Supplementary Table S4), the multivariable adjusted point estimates appeared similar to the initial (BMI) models in Table 3 except that E2 levels were 1.1% (1.003–1.21%) higher for women who experienced menopause between 45 and 49 years in comparison to the referent category.
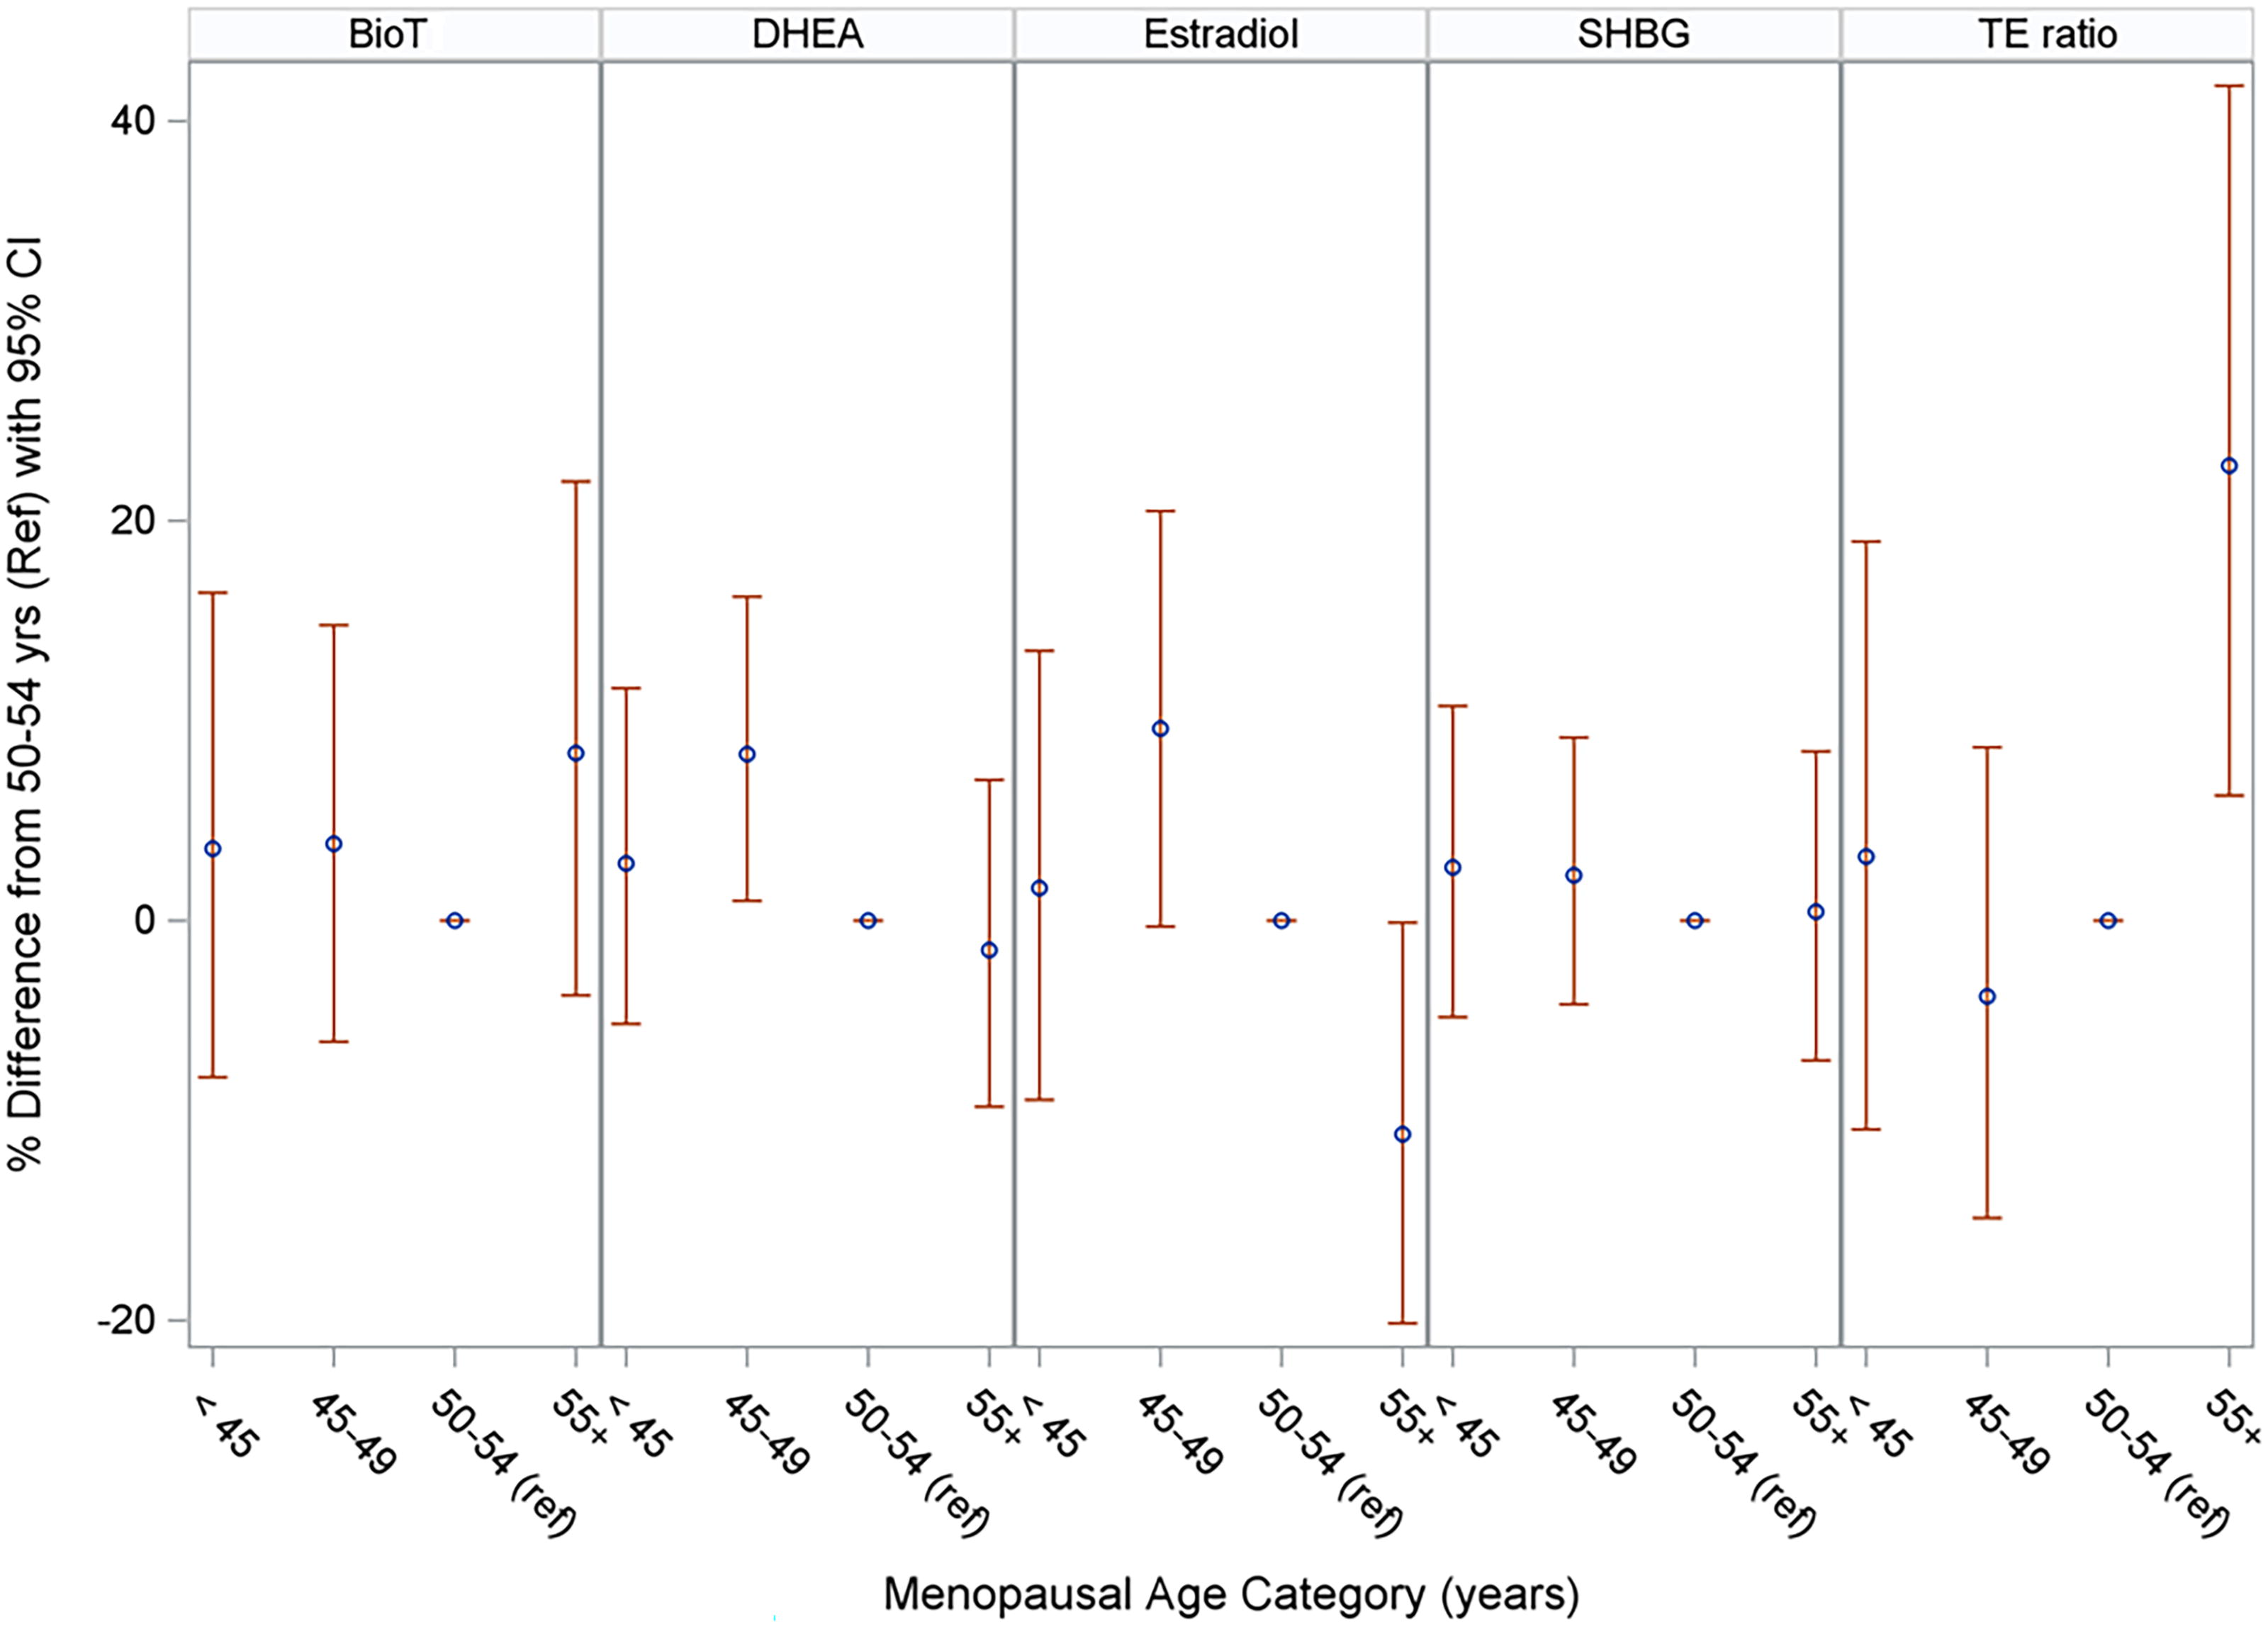
Percent difference in sex hormones associated with menopausal age categories using waist circumference as the anthropometric measure. Estimates are adjusted for age, race/ethnicity, study site, educational status, physical activity, smoking, alcohol use, body mass index, parity, type of menopause, hormone replacement therapy use, type of hormone replacement therapy, duration of hormone replacement therapy use, inflammation, and insulin resistance. BioT, biotestosterone; DHEA, dehydroepiandrosterone; Ref, reference; SHBG, sex hormone-binding globulin; T\E ratio, testosterone–estradiol ratio.
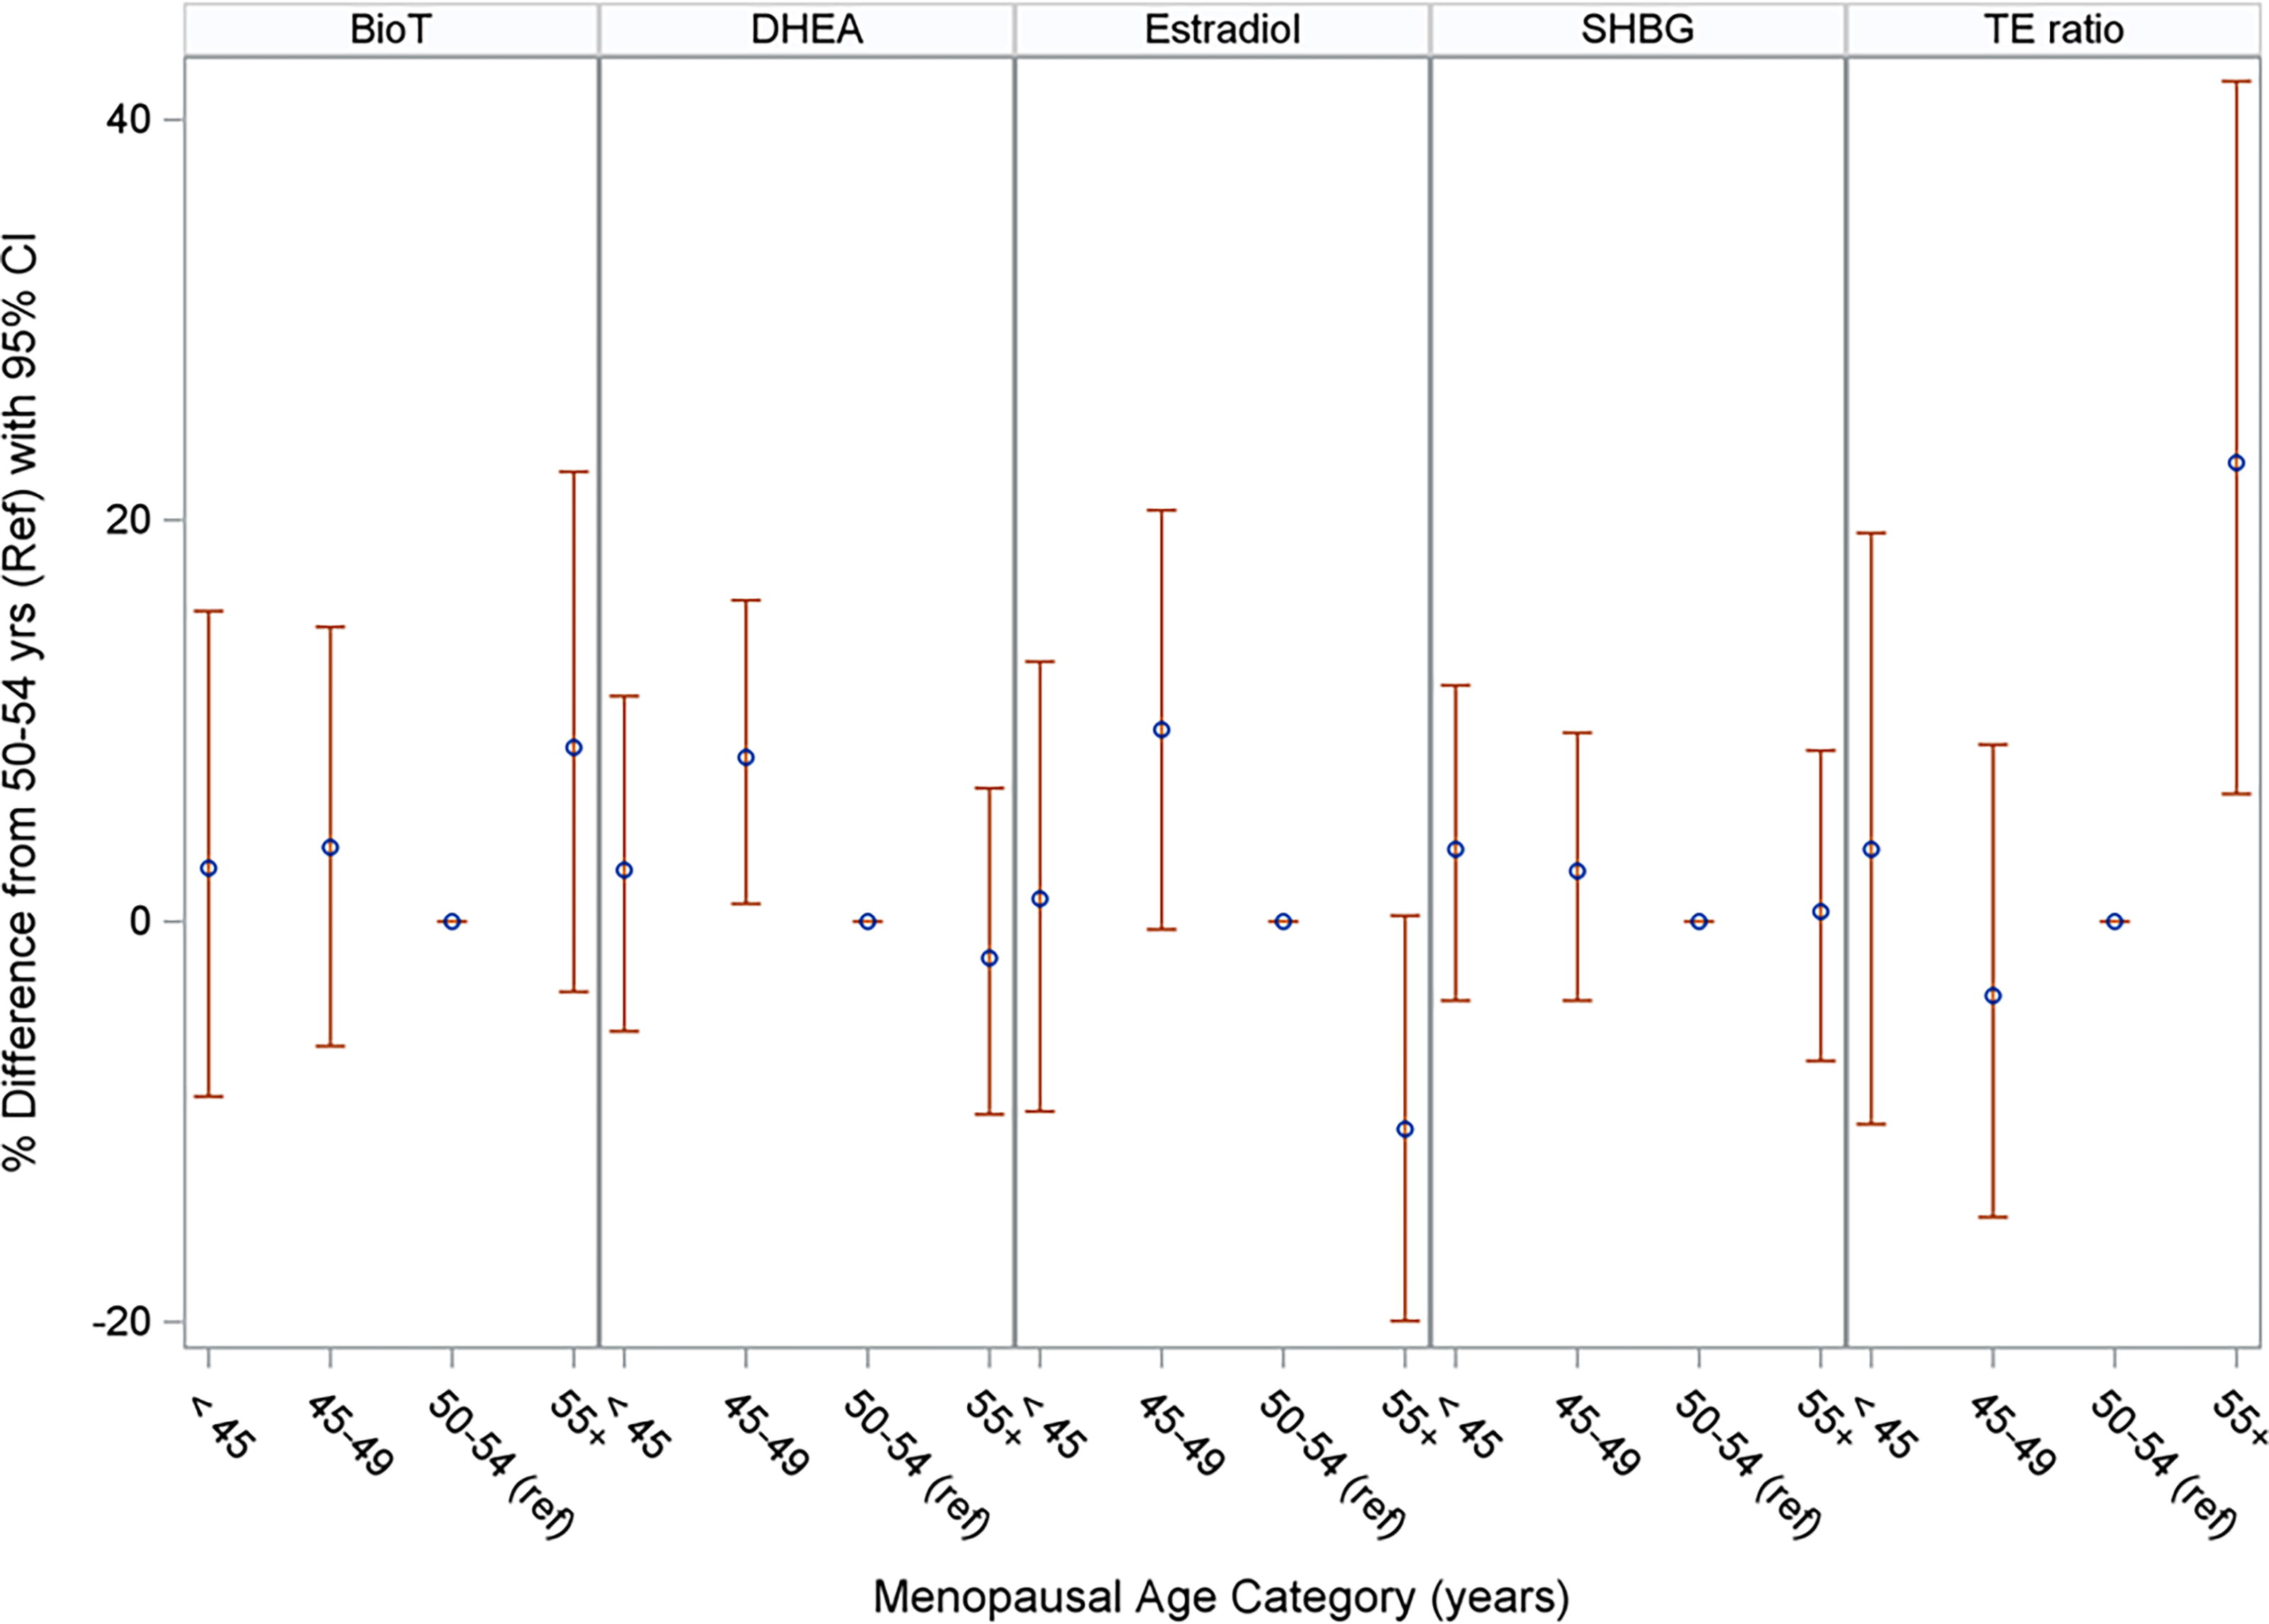
Percent difference in sex hormones associated with menopausal age categories using waist–hip ratio as the anthropometric measure. Estimates are adjusted for age, race/ethnicity, study site, educational status, physical activity, smoking, alcohol use, body mass index, parity, type of menopause, hormone replacement therapy use, type of hormone replacement therapy, duration of hormone replacement therapy use, inflammation, and insulin resistance. BioT, biotestosterone; DHEA, dehydroepiandrosterone; Ref, reference; SHBG, sex hormone-binding globulin; T\E ratio, testosterone–estradiol ratio.

Percent difference in sex hormones associated with menopausal age categories using waist–height ratio as the anthropometric measure. Estimates are adjusted for age, race/ethnicity, study site, educational status, physical activity, smoking, alcohol use, body mass index, parity, type of menopause, hormone replacement therapy use, type of hormone replacement therapy, duration of hormone replacement therapy use, inflammation, and insulin resistance. BioT, biotestosterone; DHEA, dehydroepiandrosterone; Ref, reference; SHBG, sex hormone-binding globulin; T\E ratio, testosterone–estradiol ratio.
Discussion
In this cross-sectional analysis of the MESA study involving postmenopausal women at baseline, women with late menopause had higher measures of abdominal adiposity but not generalized adiposity compared to those who experienced menopause between 50 and 54 years of age. DHEA was higher among women who experienced menopause between 45 and 49 years of age while relative androgenicity, expressed as T/E ratio, was higher among women with late menopause when compared to those who experienced menopause between 50 and 54 years. The higher E2 levels and lower relative androgenicity seen among women with early menopause became nullified when we accounted for reproductive risk factors, insulin resistance, and inflammatory markers. However, women with late menopause appeared to have lower E2 levels after adjusting for insulin resistance and inflammation in models that accounted for WC or WHtR but not BMI or WHR. When considering women with natural menopause only, neither early nor late menopause was associated with higher E2 levels but women who experienced menopause between 45 to 49 years of age had higher E2 levels when compared with those who experienced menopause between 50 and 54 years of age.
Although the reports are inconsistent, our findings are congruent with studies that have shown that women with abdominal adiposity more commonly experience menopause at later ages 14,15 but differ from reports that have linked higher BMI with a later age at menopause. 1,16 –18 As we have demonstrated, other studies have found that a higher BMI is not independently associated with late menopause. 19 –21 A possible explanation for the association between excess abdominal adiposity and late menopause is that among women with advancing age, peripheral conversion of androstenedione to estrone by local tissue aromatase activity occurs in adipose tissue, 18,22 and the highest adipose tissue aromatase expression is present in the hips, thighs, and abdomen. 23 This has clinical implications for women with late menopause because abdominal adiposity has predicted cardiovascular disorders 24 and heart failure 25 better than generalized adiposity in some studies and had greater attributable risk than generalized adiposity for incident heart failure among women with late menopause in the Atherosclerosis Risk in Communities study. 7
The secretion of estrogen by the ovaries declines in midlife women and stops at menopause. 26 Generally, endogenous E2 levels decline sharply after the final menstrual period (FMP), while androgen levels remain relatively stable to create a more androgenic profile relative to the premenopausal state. 27 However, the trajectory of estrogen decline after the FMP is variable. 28 Women may exhibit a slow E2 decline (26.9%), flat E2 trajectory (28.6%), an initial E2 rise that begins 5.5 years before the FMP followed by a late E2 decline (13.1%), or an initial E2 rise that begins 5.5 years before the FMP followed by an early E2 decline (31.5%). 28 In postmenopausal women, DHEA of adrenal (80%) and ovarian (20%) sources 26 are transformed intracellularly within peripheral tissues (predominantly adipocytes) into small amounts of cell-specific estrogens and androgens 29 and become the major source of sex hormones. However, it is unclear how the balance between estrogen and androgen production from DHEA is regulated at the cellular level. A decrease in DHEA secretion begins at 30 years of age and reaches 60% of the peak values at the menopausal transition. 29 In the postmenopausal period, a more rapid decline in DHEA 29 causes lower concentrations of estrogens and androgens.
The influence of adiposity on DHEA levels and activity is inconsistent 30 and could be affected by adipose tissue distribution. It is possible that ectopic fat accumulation could tip the balance toward a more predominant androgen production from DHEA, which may be more important than individual levels of the sex hormones themselves. Although adiposity did not influence the association between menopausal age categories and the sex hormones investigated in our study, women with greater abdominal obesity, such as those with late menopause, could possibly have ectopic fat accumulation or unfavorable changes in regional fat distribution 31 and relative androgenicity, as demonstrated in our study. The greater relative androgenicity seen among women with late menopause is important because androgenicity has been linked with abdominal adipose tissue accumulation 32 and greater risks of incident CVD, coronary heart disease, and heart failure events. 12 The elevated DHEA levels that we observed in women who experienced menopause between 45 and 49 years could potentially have negative consequences because higher DHEA has been associated with hypertension 33 and androgenic effects such as increases in abdominal adiposity in postmenopausal women especially among those with coexisting estrogen deficiency. 34
Our observation of lower E2 levels among women with late menopause when we accounted for WC or WHtR was unexpected and possibly a chance finding because it was not reproducible when we repeated our analyses in women with natural menopause only. Nonetheless, the similarity in the results for models that adjusted for WC and WHtR is likely a reflection of the strong correlation between WC and WHtR (r = 0.961) in this study. In the analyses that involved women with natural menopause only, estrogen levels were higher among women who experienced menopause between 45 and 49 years, possibly because they also had higher DHEA levels, which is the major source of sex hormones in postmenopausal women. 26 This also has clinical implications because estrogen has several cardioprotective effects that include a reduction in myocardial fibrosis, stimulation of angiogenesis, vasodilation, improved mitochondrial function, and reduced oxidative stress. 35 The apparent higher levels of estradiol seen among women with early menopause was explained by the confounding effects of reproductive risk factors, insulin resistance and inflammation. This may be because both early menopause and estradiol have been linked to insulin resistance 36,37 and inflammation. 38,39
Clinical implications
It is important to adopt preventive strategies that could improve cardiometabolic health in postmenopausal women by optimization of components of the “American Heart Association Life’s Essential 8,” 40 which includes weight management. Nonetheless, consideration should also be given to reproductive risk factors because the androgen hyperactivity that we observed in women with late menopause could have a detrimental role on cardiometabolic function and predispose to adverse changes in cardiac remodeling, 41 endothelial function 42 and vasculature, 43,44 and lipoprotein levels and adiposity. 45 –47 Further studies are needed to address persisting controversies on the association between endogenous sex hormones, cardiometabolic risk factors, and CVD. 48 –50 The similarity in the associations when we adjusted for different prespecified measures of adiposity is likely due to the significant correlations that existed between measures of generalized and abdominal adiposity.
Strengths and limitations
This is the first study to evaluate the associations between menopausal age categories and multiple prespecified sex hormones. Strengths of MESA include a multiethnic cohort from diverse geographic locations and a rich database collected with highly standardized procedures. Our study has limitations. Due to the cross-sectional design of the analytical sample studied, we are unable to make causal inferences or determine the directionality of the associations. Our single baseline measure of endogenous sex hormones does not account for temporal changes in sex hormones over time. Follicle-stimulating hormone was not measured in the MESA study and was not included in our analyses. Menopausal age was ascertained by self-report that can generate recall bias. However, women are able to remember their menopausal age with relative accuracy. 6 Residual confounding may be present due to unmeasured risk factors such as diet and serious illness, which were not included in our analyses. We had inadequate power to explore our analyses among women with surgical menopause who comprised 23.2% of our study sample. It is also possible that some of our findings may be due to chance because of the multiple comparisons performed in this study. Although other measures of adiposity such as visceral adipose tissue obtained from computed tomography may provide more accurate measures of body composition, the anthropometric measures are cheaper, readily available in the clinical setting, and not associated with unwanted side effects from radiation or contrast exposure that may be encountered with use of computed tomography to assess body composition.
Conclusion
Women with late menopause had higher abdominal adiposity but not generalized adiposity when compared to those who experienced menopause between 50 and 54 years of age. Androgenicity was higher among women who experienced menopause between 45 and 49 years of age and those with late menopause, based on DHEA and T/E ratios, respectively. Our findings could have implications for developing preventive strategies focused on optimizing women’s cardiometabolic health, as sex hormone alterations may have deleterious effects that can influence the risk of CVD among postmenopausal women. Further studies are needed to address persisting controversies in this area.
Footnotes
Acknowledgments

Authors’ Contributions
I.A.E.: Conceptualization—lead; methodology—lead; writing original draft—lead; review and editing—equal; funding acquisition; project administration; visualization. M.W.: Methodology—supporting; data curation—lead; formal analysis; software. S.B.R.: Review and edits—equal; supervision—equal. D.A.: Review and edits—supporting. P.J.S.: Conceptualization—supporting; review and edits—equal. M.A.: Methodology—supporting; review and edits—equal. K.W.: Review and edits—supporting. A.G.B.: Methodology—supporting; review and edits—supporting; supervision—equal. E.D.M.: Conceptualization—supporting; methodology—supporting; review; and edits—equal.
Author Disclosure Statement
The authors report no conflicts of interest.
Funding Information
This research was supported by contracts 75N92020D00001, HHSN268201500003I, N01-HC-95159, 75N92020D00005, N01-HC-95160, 75N92020D00002, N01-HC-95161, 75N92020D00003, N01-HC-95162, 75N92020D00006, N01-HC-95163, 75N92020D00004, N01-HC-95164, 75N92020D00007, N01-HC-95165, N01-HC-95166, N01-HC-95167, N01-HC-95168, and N01-HC-95169 from the National Heart, Lung, and Blood Institute (NHLBI) and by grants UL1-TR-000040, UL1-TR-001079, and UL1-TR-001420 from the National Center for Advancing Translational Sciences. The sex hormone ancillary study was supported by R01 HL074406 and HL074338 from the NHLBI. I.A.E. is supported by R21 HL165018-01 and U01 HL160274 grants from the NHLBI and the American Heart Association Strategically Focused Research Network grant 23SFRNPCS1064232. E.D.M. is supported by an American Heart Association grant 946222 and by the Amato Fund in Women’s Cardiovascular Health Research at Johns Hopkins University.
Supplementary Material
Supplementary Table S1
Supplementary Table S2
Supplementary Table S3
Supplementary Table S4
References
Supplementary Material
Please find the following supplemental material available below.
For Open Access articles published under a Creative Commons License, all supplemental material carries the same license as the article it is associated with.
For non-Open Access articles published, all supplemental material carries a non-exclusive license, and permission requests for re-use of supplemental material or any part of supplemental material shall be sent directly to the copyright owner as specified in the copyright notice associated with the article.
