
Abstract
Abstract
Background:
The need for an initial learning experience in laparoscopic colorectal cancer surgery has been well established. However, the inherent differences in the complexity and results of laparoscopic rectal cancer surgery, as compared to colon surgery, warrant a study to analyze the learning curve exclusively for rectal cancer resections.
Materials and Methods:
four hundred thirty-one patients operated on between April 1994 and March 2006 were analyzed retrospectively for changes in surgical outcomes according to case sequence. A multidimensional analysis was done, based on the following parameters: conversion to laparotomy, intraoperative complications, postoperative complications, reoperations, operative time, and transfusion volumes. Multiple statistical methods were used for evaluation of the learning curve, which included the cumulative sum (CUSUM) method, risk-adjusted CUSUM, moving average method, and analysis of variance (ANOVA).
Results:
The risk factors for conversion were prior abdominal surgery (hazard ratio, 2.52; 95% CI, 1.04–6.10; P = 0.04) and tumor size ≥3.5 cm (hazard ratio, 5.05; 95% CI, 1.95–13.08; P = 0.001). Risk-adjusted CUSUM analysis showed that case 61 was the peak change point for conversion. Postoperative complications occurred in 56 patients (13.0%), and the rate was associated significantly with case sequence (P < 0.001). The turning point in the CUSUM model occurred at case 79, and the complication rates decreased thereafter. Operative time and intraoperative transfusion volumes stabilized over cases 61–75 and declined thereafter.
Conclusions:
Multidimensional analysis considering various surgical outcomes is necessary to evaluate the learning curve for laparoscopic rectal cancer surgery. The effective surgical learning curve was approximately 60–80 procedures in this series.
Introduction
Early reports analyzed learning curves by using stabilization of operative time as the end point, and suggested that 11–15 cases are required to reach that point.9,10 Conversely, other studies have reported a failure of operative time to decrease with experience. Besides, shorter operative times did not correlate with better clinical outcomes, and the failure of operative time to decline with experience reflected the surgeons' willingness to attempt more difficult cases, rather than an accurate representation of a “learning curve.” 11 Therefore, it would be inappropriate to assess learning curve based solely on operative time, and a multifactorial analysis based on surgical outcomes would appear to be a better approach. 12
In an extensive review by Ramsay et al. encompassing 272 articles pertaining to learning curve for minimal access surgeries, other surgical procedures, and health technologies, it was found that the majority of the studies used simple graphs, with arbitrary splitting of the data into groups.13,14 Most of these studies performed only univariate analysis, usually without tests for trends. Advanced multivariate techniques were used sparingly, and the cumulative sum (CUSUM) technique was used in only 2% of all studies without any formal adjustment for patient risk factors. The CUSUM technique can identify minor changes by observing the cumulative differences between targets and actual results and has been applied to assess learning curves by analyzing changes in surgical outcomes.15–17 In a more recent study, the risk-adjusted CUSUM has been suggested for assessing the learning curve in laparoscopic colorectal surgery, applying an individual probability of conversion calculated by multivariate analysis. 16 However, in most studies assessing learning curve for laparoscopic surgery for colon and rectal cancer, both have been studied as a single entity, which may influence results. Considering the inherent differences in the results of laparoscopic rectal surgery, when compared to colonic surgery, there appears to be a need to assess learning curve exclusively for laparoscopic rectal cancer surgery in a more comprehensive manner. The aim of this study was to evaluate the learning curve of a single surgeon undertaking laparoscopic rectal surgery by analyzing, in a multidimensional manner, the changes in surgical outcomes according to case sequence. Particular emphasis was given to the adjustment of potential confounding factors that may affect surgical outcomes, and the risk-adjusted CUSUM model was used to assess the extent of surgical experience required to overcome the learning curve.
Materials and Methods
A total of 447 consecutive patients who underwent elective laparoscopic rectal cancer surgery at the Department of Surgery, St. Vincent's Hospital, The Catholic University of Korea (Suwon, Korea) between April 1994 and March 2006 were identified, of which 16 patients were excluded from analysis due to inoperable disease with laparoscopy. Finally, 431 patients who underwent successful elective procedures were included for this retrospective analysis.
Surgical procedure
All surgeries were performed by a single surgeon specializing in colorectal surgery. For patients with upper rectal cancers, partial mesorectal excision was performed to obtain a distal resection margin of at least 5 cm. Every attempt was made to offer sphincter preservation for the patients with mid- and low-rectal cancers. This included offering neoadjuvant radiotherapy or concurrent chemoradiotherapy to selected patients with rectal cancer greater than clinical tumor stage T2 (cT2) of the TNM system within 7 cm from the anal verge and greater than cT3 or cN1 lesions within 12 cm of the anal verge. When a distal resection margin of more than 1 cm was attainable with a linear stapler, a low anterior resection was performed, using a double-stapling technique. However, if a distal resection margin of more than 1 cm was difficult to achieve with a linear stapler, a laparoscopic abdominal transanal proctosigmoidectomy with coloanal anastomosis was performed. The technique for this procedure has been described in earlier publications.18,19 A diverting ileostomy or transverse colostomy was added for patients with an anastomosis within 5 cm of the anal verge or those who had received preoperative radiotherapy. Abdominoperineal resection (APR) was reserved for patients with tumor reaching the dentate line or invading the levator ani muscle.
Surgical outcomes and risk factors
The following surgical-outcome parameters were analyzed for changes over the case sequence: operative time, intraoperative transfusion volume, intraoperative complications, postoperative complications, conversions, and reoperations. Conversion was defined as extension of the minilaparotomy for reasons unrelated to specimen extraction, such as difficult dissection or bleeding control and concurrent surgery for other organs. To analyze the risk factors that might have been associated with surgical outcome, the following factors were examined: age, sex, body mass index (BMI), American Society of Anesthesiologists (ASA) physical status, tumor location, tumor size, pathologic T-status, type of operation, preoperative radiation therapy, and prior abdominal surgery.
Statistical analysis
To assess surgical outcomes according to case sequence, they were divided into eight subgroups of 25 for cases 1–200, while cases 201–431 were designated as another subgroup. Each subgroup was then compared with respect to surgical outcomes. Student's t-tests and chi-squared tests were used for comparing patient characteristics between the laparoscopic and conversion groups. Changes in operative times, according to case sequence, were analyzed from using the moving-average method, in which the subgroup size was 15 and the length of the mean average was 6. One-way analysis of variance (ANOVA) was used for analyzing changes in transfusion volumes, conversions, intraoperative complication, postoperative complication, and reoperation rates, based on case sequence. Analysis of risk factors for conversion and complications was accomplished by multivariate analysis, using the logistic-regression model. Clinical factors were selected as covariates when P-values were less than 0.25 on univariate analysis. Using forward stepwise selection, independent factors were analyzed, for which the cut-off P-value was set at 0.1 and the significance level for entry and staying was 0.05. The probability of event was calculated, which was adjusted with independent risk factors of conversion or complication from the logistic regression model. Changes in surgical outcomes across the case sequence were measured from utilizing the risk-adjusted CUSUM model. The observed score for successful laparoscopic surgery was defined as 0, and the score for conversion or complication was 1. For adjusting the risk factors of each patient, the probability of event calculated from the logistic regression model was defined as the expected score. The accumulated data from the difference between the observed score and expected score were used to form the risk-adjusted CUSUM chart.
The risk-adjusted CUSUM plot gives a visual representation on whether the cumulative events (in this study, surgical outcome, such as conversion) are above or below the predicted cumulative events, taking into account the expected risk associated with a particular caseload.16,20,21 For example, if we consider the risk-adjusted CUSUM for conversion, for each patient, the probability of conversion to open surgery is determined by the logistic regression model, which, in turn, determines the magnitude by which the graph ascends or descends. For every successful case accomplished laparoscopically, the graph descends by an amount equal to the estimated probability of conversion. And, for every case that is converted, the graph ascends by an amount equal to the estimated probability of nonconversion. Therefore, if a laparoscopic case is converted in a high-risk patient, the surgeon's performance chart is not unduly affected. However, a conversion in a low-risk patient is represented as a sharp rising in the graph. When the probability of event was inapplicable, the mean value of our series was used as the expected score for CUSUM charts. When more than 2 complications occurred during the same period in 1 patient, the complication deemed as more serious was counted for analysis in the CUSUM model. The applied statistical software was SPSS® 12.0 (SPSS, Inc., Chicago, IL), while the moving-average method and CUSUM model were analyzed by Minitab® 14.0 (Minitab, Inc., State College, PA). Statistical significance was set at P < 0.05. Continuous variables were expressed as the mean ± standard error.
Results
A total of 431 consecutive patients (233 male and 198 female) underwent elective laparoscopic rectal cancer resections in the specified time period. The average age in the study population was 60.4 years, and the average BMI was 23.9. The different types of surgeries performed are elucidated in Table 1, along with other demographic features. With regard to patient case selection, 25 patients also received surgery for a synchronous intra-abdominal pathology.
LATA, laparoscopic abdominal transanal proctosigmoidectomy with coloanal anastomosis; APR, abdominoperineal resection.
Conversion
Of the 431 patients, 24 required a conversion. The reasons for conversion were: large rectal cancers and/or invasion (29.2%; n = 7), intraoperative complications (20.8%; n = 5), bowel adhesions (16.7%; n = 4), and difficult pelvic dissection (12.5%; n = 3). The 5 other cases included in the conversion group (20.8%) involved an operation on another organ, which consisted of 4 hepatectomies and 1 gastric resection. Hence, the extended incision was not because of difficulty in rectal cancer surgery, but these have been included in the conversion group for the sake of completeness of data. A comparison of patient characteristics in the laparoscopic (n = 407) and conversion groups (n = 24) is shown in Table 1. Hospital stay was shorter in the laparoscopic (16.5 ± 0.6 days) than in the conversion group (18.7 ± 1.7 days), but this was not significant (P = 0.87). No mortalities occurred within 30 days of surgery in either group. The mean operative time for the laparoscopic group was significantly shorter (389.5 ± 5.8 minutes) than in the conversion group (503.7 ± 38.7 minutes; P < 0.001).
The conversion rates had a tendency to decrease along with the case sequence, but this trend was not statistically significant (Table 2). Multivariate analysis showed that prior abdominal surgery and tumor size were independent risk factors for conversion (Table 3). The area under the receiver operating characteristic curve in the logistic regression model was 0.73 (95% CI, 0.63–0.82), which was within the specified confidence intervals, indicating that the model was adequate for discrimination (i.e., the ability to assign the correct probability of outcome, for example, the ability to assign the higher probability of conversion to patients who are actually converted). When compensating for the two risk factors identified on the multivariate analysis, the peak point was case 61 on the risk-adjusted CUSUM graph (Fig. 1).
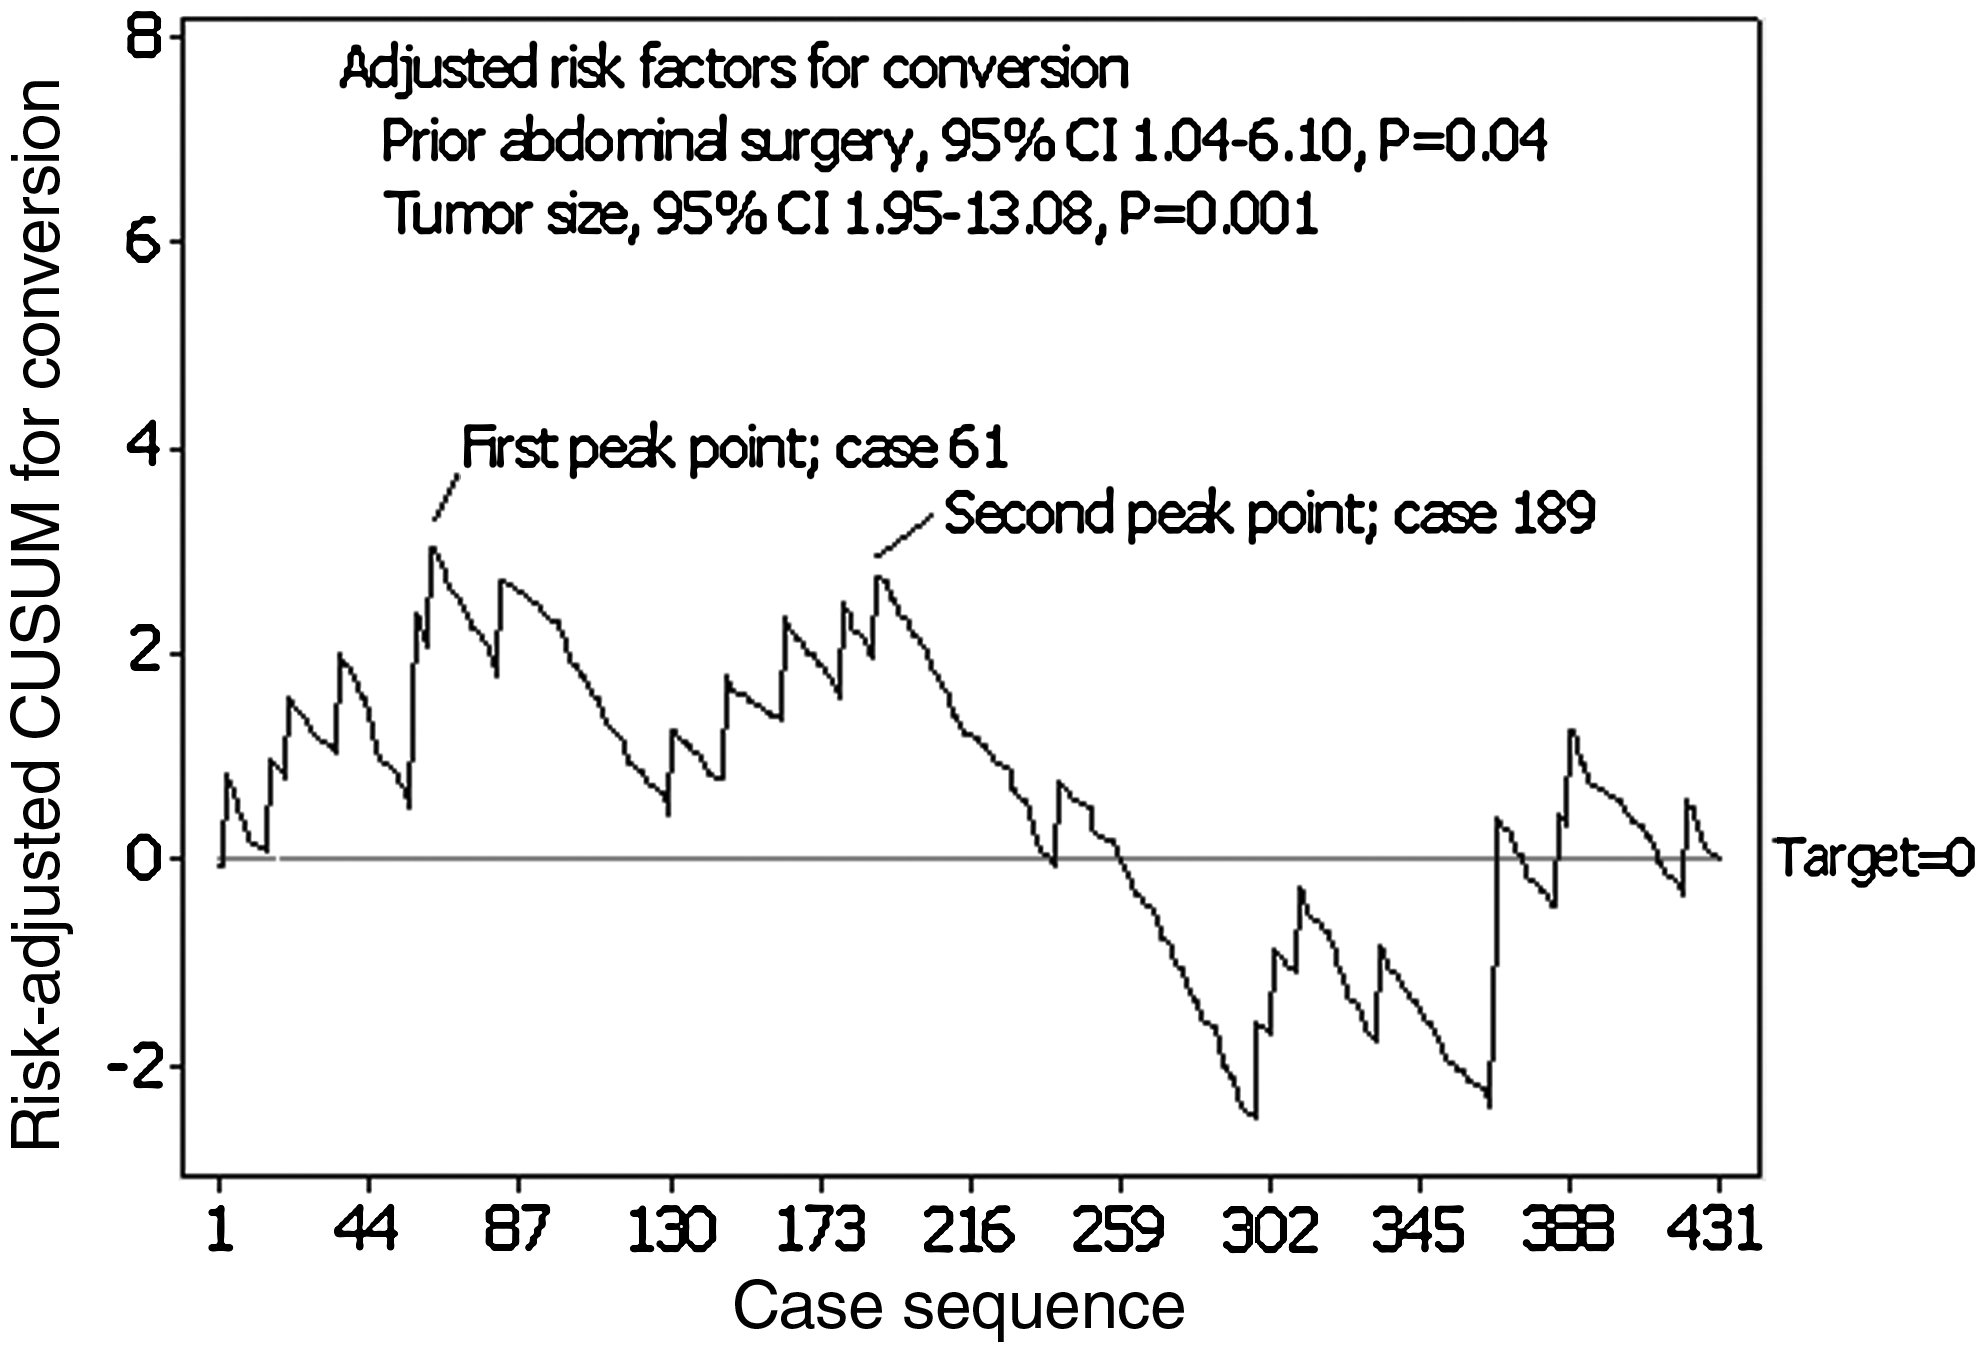
Risk-adjusted cumulative sum (CUSUM) graph for conversion giving a visual representation of the actual conversion rate, compared to the predicted probability for conversion over case sequence. Case 61 is the turning point for the learning curve.
P < 0.05 on one-way analysis of variance (ANOVA).
Pearson's chi-square test.
β, regression coefficient; CI, confidence intervals.
Intraoperative complications
Intraoperative complications occurred in 58 patients (13.5%). These were rectal perforation (3.5%; n = 15), pelvic bleeding (2.6%; n = 11), intestinal injury (1.6%; n = 7), stapling failure (1.2%; n = 5), marginal artery injury (0.7%; n = 3), vaginal injury (0.7%; n = 3), bladder injury (0.5%; n = 2), insufficient distal rectal margin (0.5%; n = 2), seminal vesicle injury (0.5%; n = 2), urethral injury (0.5%; n = 2), trocar complications (0.5%; n = 2), splenic injury (0.2%; n = 1), pancreatic injury (0.2%; n = 1), ureteral injury (0.2%; n = 1), and common bile duct injury, resulting in bile leakage after concurrent cholecystectomy (0.2%; n = 1). There was no statistically significant relationship between intraoperative complications and case sequence (P = 0.24). Multivariate analysis showed no risk factors for intraoperative complications. By setting the 13.5% mean value as the target rate for CUSUM, the turning point was at case 243 (Fig. 2).

Cumulative sum (CUSUM) graph of intraoperative complications over the case sequence. The relatively flat nature of the learning curve indicates that the intraoperative complication rate remained relatively constant over the case sequence.
Postoperative complications
Postoperative complications occurred in 56 patients (13.0%). These were anastomotic leakages (3.2%; n = 14), ileus (2.3%; n = 10), urinary retention (1.9%; n = 8), stoma complications (1.4%; n = 6), wound infections (1.2%; n = 5), anastomotic strictures (0.9%; n = 4), and rectovaginal fistulas (0.7%; n = 3). Delayed splenic bleeding, ureteral stenosis, delayed small-bowel perforation, deep vein thrombosis, pleural effusion, and pelvic abscess were observed in each of the patients (0.2%). The postoperative complication rate decreased significantly as surgical experience accumulated (P < 0.001). Multivariate analysis showed that case sequence and BMI were independent risk factors for postoperative complications (Table 3). With the mean value of 13.0% as the target rate for CUSUM, the turning point was at case 79, after which complications started to decrease (Fig. 3).

Cumulative sum (CUSUM) graph of postoperative complications over the case sequence. The predicted rate of postoperative complications was taken as 13%, the mean value of the series. Case 79 was the turning point of the learning curve.
Reoperations
Reoperations were performed in 20 patients (4.6%). These consisted of diverting colostomy (2.1%; n = 9) and Hartmann's operation (0.2%; n = 1) for anastomotic leakage, adhesiolysis (0.9%; n = 4), diverting colostomy followed by delayed repair of a rectovaginal fistula (0.5%; n = 2), splenectomy (0.2%; n = 1), nephrectomy (0.2%; n = 1), primary repair of delayed jejunal perforation (0.2%; n = 1), and bladder injury repair (0.2%; n = 1). There was no statistically significant relationship between reoperation and case sequence (P = 0.98).
Operative time
The median operating time for the entire study population was 395.8 minutes. The moving-average method showed that the operative time of case group 46–60 was the maximum at 553 minutes and began to decrease from case group 61–75 onward. The operative time continued to decrease up to case group 196–210 and stabilized thereafter (Fig. 4).

Changes in operative time analyzed from using the moving-average method. All patients were divided into subgroups of 15 successive cases (n = 431). Operative time started decreasing from case group 61–75 onward.
Intraoperative transfusion volume
The intraoperative blood-transfusion volume was studied over the case sequence in subgroups of 25 patients. The transfusion volume was highest for patient subgroup 51–75, after which it stabilized to an average of below 1 unit (Fig. 5).
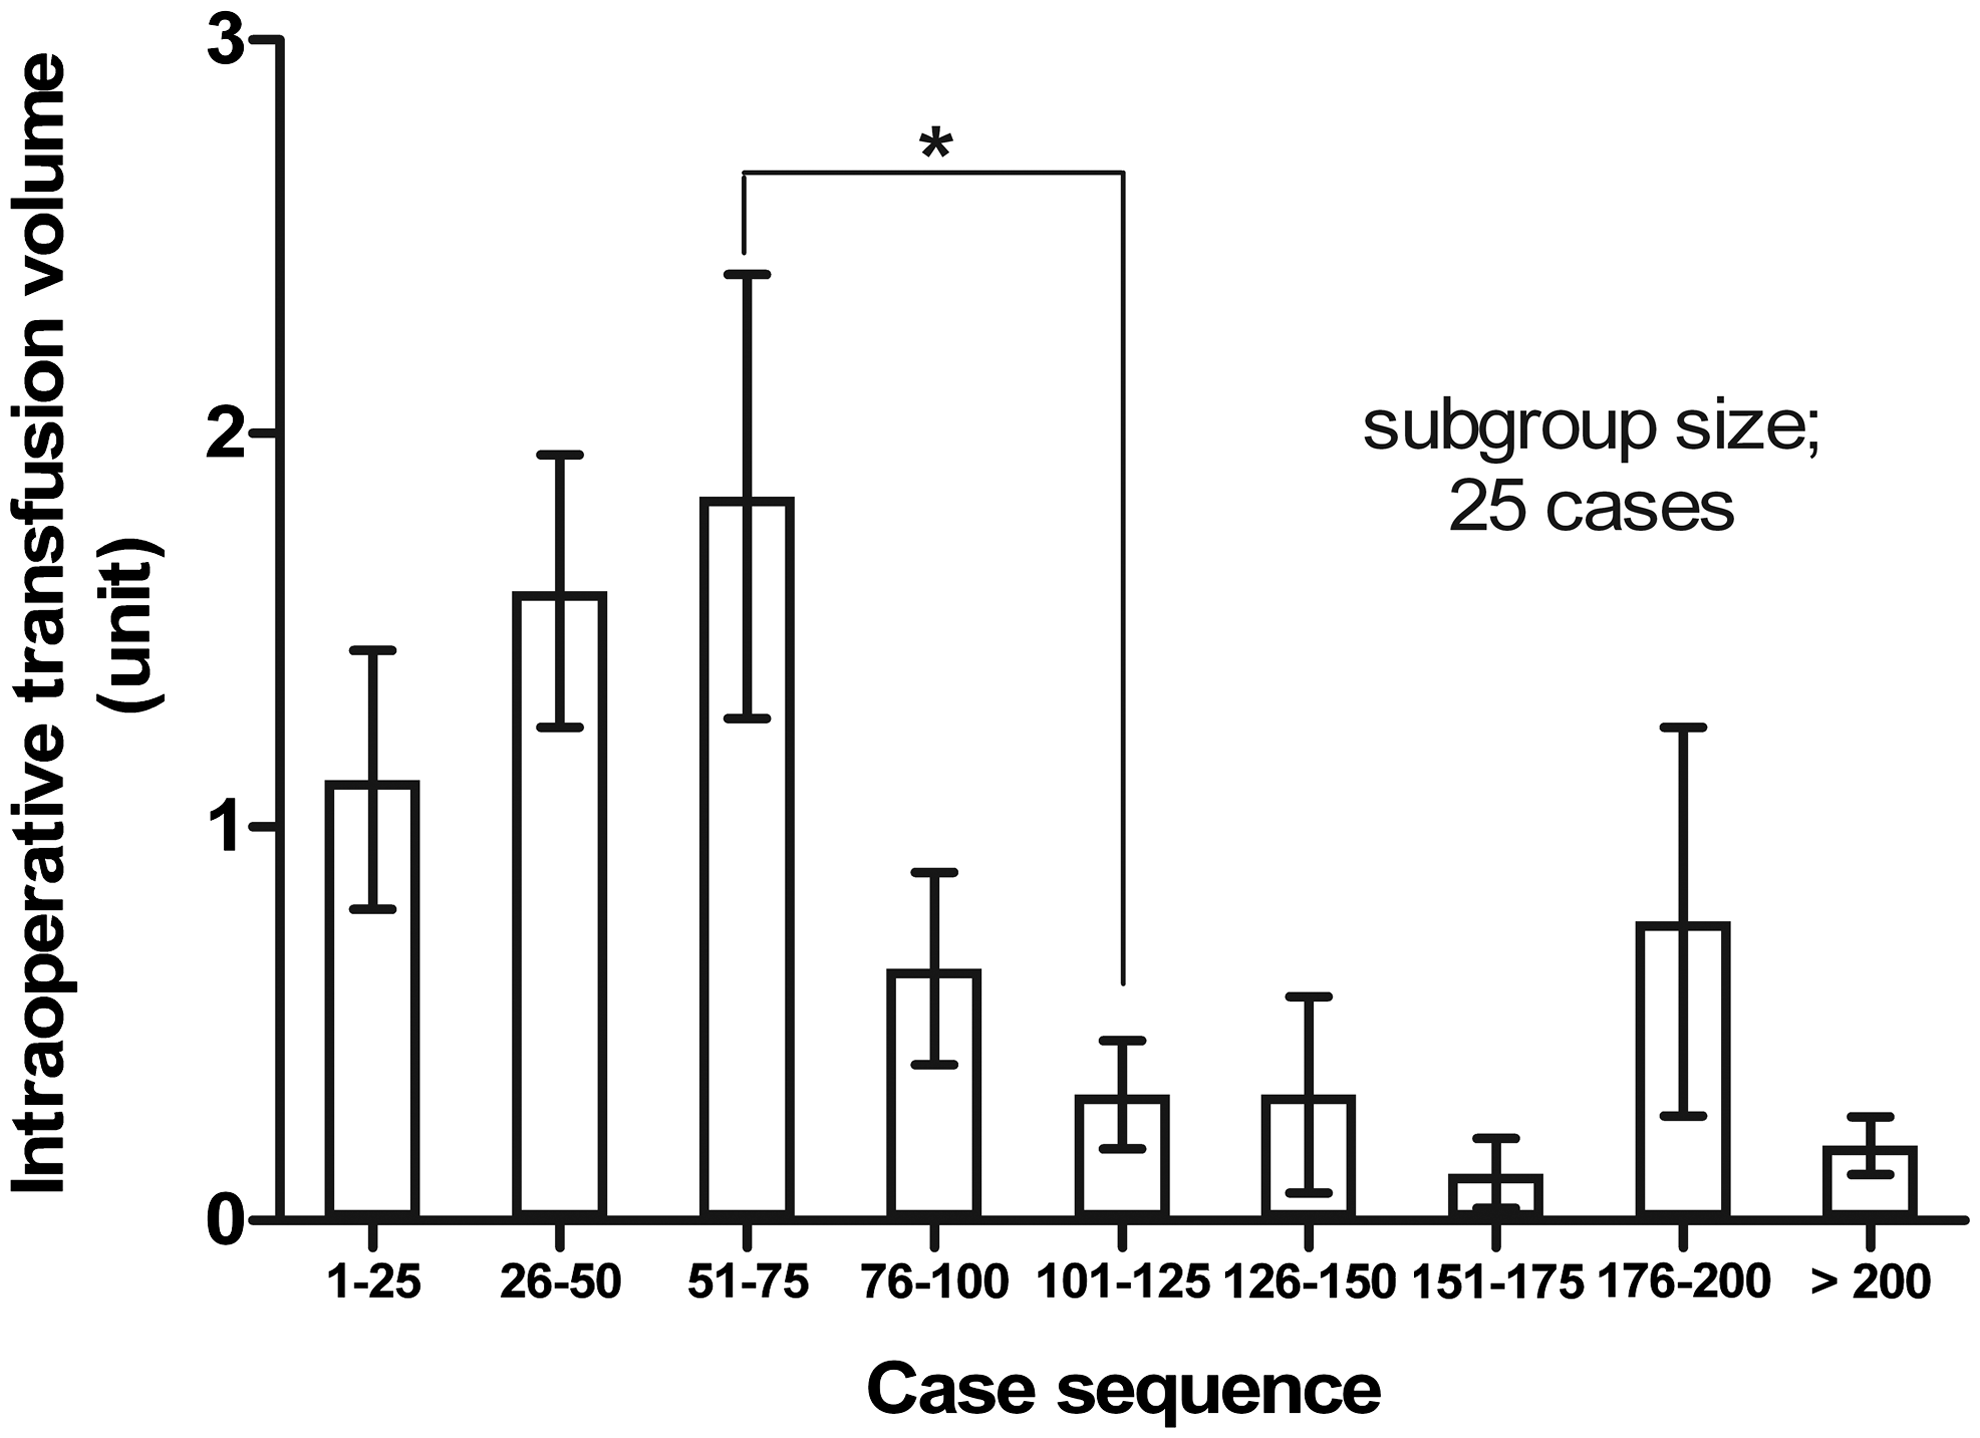
Changes in blood-transfusion volume over the case sequence. Transfusion volume started decreasing after case group 51–75 onward. *P < 0.05 on one-way analysis of variance.
Discussion
Laparoscopic surgery is steadily being established as the standard operative procedure for patients with colorectal cancer. In comparison to open procedures, there is quicker restoration of bowel function, less postoperative pain, and a decreased frequency of wound infection. 7 However, laparoscopic surgery has its limitations. The restricted mobility of the instruments, the fulcrum effect of the trocars, the limited visual operative field, and the two-dimensional picture can lead to unexpected complications in the hands of an inexperienced surgeon. 22
In this study, we aimed to evaluate the learning curve for a single surgeon undertaking laparoscopic rectal cancer surgery by analyzing the changes of surgical outcomes according to case sequence. Studies have shown the utility of CUSUM in the assessment of learning curve in surgical processes, including laparoscopic colorectal surgery.16,17,23 The CUSUM graph provides a visual guide to key performance indicators. This enables an evidence-based review of the accumulated surgical outcomes for surgeons. Additionally, an immediate visual feedback of the surgeon's performance is available, and hence it provides directions for continued improvements in surgical outcome. 24 Nevertheless, the application of CUSUM, which was initially introduced for assessing quality control in industrial procedures, has certain limitations in evaluating surgical procedures. The degree of difficulty in colorectal cancer surgery differs markedly between patients, depending on factors such as age, sex, obesity, ASA physical status, tumor location, tumor size, and depth of invasion. Therefore, it may not be appropriate to apply this method evenly in assessing a surgeon's performance for all patients without adjusting for these confounding factors. 16 To improve upon this limitation, risk-adjusted CUSUM has been suggested for assessing the learning curve in surgery. In this type of analysis, a more accurate assessment is formulated, defining the envisioned individual surgical success rate by taking into account or adjusting for the risk factors of each patient. The method for calculating the risk-adjusted CUSUM has varied between studies, but a common denominator, in most, has been applying the probability calculated by multivariate analysis from using the logistic regression model.25–27 There have been only a few reports that have assessed learning curves for laparoscopic colorectal surgery with risk-adjusted CUSUM. 16 In our series, changes in conversion rates were evaluated by the risk-adjusted CUSUM after taking into consideration the relevant risk factors obtained by a multivariate analysis.
Conversion to laparotomy leads to prolonged operative times, increased complication rates, increased transfusion volumes, and lengthened hospital stay. Therefore, most of the advantages of laparoscopic surgery are lost. In our study, intraoperative complications were more frequent and transfusion volumes were significantly higher in the conversion group. There were trends for more postoperative complications and longer hospital stay in the conversion group than in the laparoscopic group. General factors related to conversion have been mainly reported to be male gender, BMI, ASA physical status, type of surgery, T4 status, operative experience, and the surgeon's seniority.25,28 In this study, we found that prior abdominal surgery and tumor size were independent risk factors for conversion. The risk-adjusted CUSUM analysis, after taking into consideration these risk factors, revealed that the conversion rate stabilized after 61 cases (Fig. 1). However, although case 61 was the turning point for conversion, a second peak was observed at case 189.
CUSUM analysis constitutes a chart by continuously combining the differences in target rates and patient's score, considering a success case as 0 and failure case as 1. CUSUM curve inclines in a failure case and declines in a successful case. Hence, if failure cases accumulate, it becomes the highest point from the baseline. When successful cases continue, a turning point is established and this point can be considered as the point when initial experience overcomes the learning curve. When the success rate reaches the target rate, it gets closer to the baseline.
While analyzing CUSUM, the outcomes may differ according to the set target rates. If the CUSUM graphs curve excessively up- or downward, this may be related to problems with quality control or inappropriate target rates. Risk-adjusted CUSUM can be determined by the target rates, based on the level of each patient's risk. The highest peak in the CUSUM graph for conversion refers to the highest conversion rate, and the bottom point represents the highest success rate. As experiences accumulated, the success rate became closer to the target rate and the CUSUM curve reached the baseline.
The CUSUM graph of intraoperative complications also showed a similar effect (Fig. 2). After a decreasing trend following case 36, there was an increase seen from case 133, arriving at a break point at case 243. These apparent paradoxic events are, perhaps, explained by the significant shift toward more complex procedures and high-risk patients in the later part of the series as the experience and confidence of the surgical team grew. Similar findings have been noted in previous studies. Surgeons, after completing the learning phase, tend to be more liberal in their case selection and are more likely to undertake complex, challenging cases, leading to an apparent rise in the complication and conversion rates.11,29
On multivariate analysis of postoperative complications, the case sequence and BMI were revealed as independent risk factors. However, in an analysis of the risk-adjusted CUSUM by taking the case sequence into account, the early subgroup's complication probability was shown to be overestimated. To offset this issue, we set the target rate as 13.0% (the mean value of our series) in the CUSUM analysis. The CUSUM graph for postoperative complications reached a break point at case 79 and then declined (Fig. 3). This is consistent with a report that major complications started to decrease after completing 60–75 cases of laparoscopic surgery. 17
In this study, as surgical experiences accumulated, technical complications, such as anastomotic leaks, stricture, or rectovaginal fistulas, decreased. Nontechnical complications also decreased as the learning curve progressed. Since an operative view was easily secured and unnecessary procedures decreased under the laparoscope, operative time shortened. Such changes made recovery of bowel motility quicker, reducing postoperative ileus. Additionally, as laparoscopic surgery became familiar, autonomic nerve plexus, such as hypogastric nerve or pelvic nerve plexus, became well preserved. After conducting the CUSUM analysis, except for the 33 cases with nontechnical complications, the first peak point was formed in 75 cases, and the results were similar to the CUSUM analysis of all postoperative complications.
Operative time and transfusion rate stabilized over case groups 61–75 and 51–75, respectively, and declined thereafter. Thus, based on our analysis of conversion rate, postoperative complications, operative time, and transfusion volume, the optimal experience constituting an adequate learning curve for laparoscopic rectal cancer surgery is approximately 61–79 cases. Most previous publications have suggested that the learning curve in laparoscopic colorectal surgery ranges from 30 to 70 cases, with the exception of Simons et al., who reported the shortest learning curve of 11–15 cases in a series of 144 patients. 9 Bennet et al. reported a learning curve of 40 cases among 1194 patients. 30 Schlachta et al., in a series of 461 patients, reported a learning curve of 30 cases, 12 and Dincler et al. suggested that 70–80 cases may represent the learning curve for sigmoid colectomy. 17 Tekkis et al., in a series of 900 patients, reported a learning curve of 55 cases for right-sided colectomies and 62 cases for left-sided resections. 16 Although 61–79 cases may appear to be a large number for most trainee surgeons, it must be considered in the light that this study deals exclusively with rectal cancer cases. Also, this learning curve includes the initial experiences of a pioneer in laparoscopic colorectal surgery who began performing laparoscopic surgery for rectal cancer in the early 1990s through self-education, when the procedure had not yet been standardized. This is reflected by the longer operative times in the early cases, compared to other reported studies.6,31,32 In recent years, laparoscopic surgery has become more widespread, as there is increasing information available in the literature, educational videos, and symposiums. Moreover, it has been reported that the younger generation, who have grown up with video games, are more likely to familiarize themselves with laparoscopic surgical skills, and this may help to shorten their learning curves. 33 Hence, this number is to be taken merely as a guideline for beginner surgeons and may be the duration for prospective mentorship by an experienced surgeon to optimize results.
The relatively large sample size of this study affords for an adequate case mix. Besides, the study spans several eras in the development of rectal cancer surgery, from the establishment of standard procedural protocols through self-education to the introduction of preoperative radiotherapy and expansion of indications of sphincter-saving surgeries and, finally, to the development of the laparoscopic abdominal transanal proctosigmoidectomy with coloanal anastomosis.18,19 This shows that after the initial learning experience, the surgeon can competently undertake relatively new, complex procedures without much increase in conversion and complication rates.
There were some limitations of this study. First, during the study period, the surgeon was performing laparoscopic surgery not just for rectal cancer, but also for colon cancer and benign colon diseases, such as diverticulitis. The experience acquired from laparoscopic colon surgery accommodates the laparoscopic skill that facilitates better execution of laparoscopic rectal cancer surgery. Second, the results cannot be inferred to be that of a study of the learning curve for total mesorectal excision. When operating on mid- or low-rectal cancers in a narrow pelvic cavity, it is quite challenging to dissect down to the pelvic floor and avoid injuries to structures, such as the seminal vesicles or vagina, pelvic nerve, and presacral venous plexus, to complete the total mesorectal excision. 8 Most of all, the cancer-free circumferential margin is the key factor that determines oncologic outcome, and thus an adequate lateral margin must be secured. 34 Another difficulty is in the use of an endoscopic stapler to transect the low rectum in a male patient with a narrow pelvic cavity. 31 When the double-stapling technique in a laparoscopic visual field is too difficult, a hand-sewn coloanal anastomosis needs to be attempted.18,35 Therefore, a study of the learning curve for total mesorectal excision in patients with mid- and low-rectal cancer taking into account not only surgical outcomes, but also final pathological evaluation as an outcome measure to ensure the completeness of total mesorectal excision might be necessary. Last, the present study included 49 patients with upper rectal cancer located 12–15 cm from the anal verge, most of whom received partial mesorectal excision. Thus, our results cannot be claimed to be a study of the learning curve for a total mesorectal excision.
Conclusions
In conclusion, multidimensional analysis considering various surgical outcomes is necessary to evaluate the learning curve for laparoscopic rectal cancer surgery. Operative time and the need for blood transfusions declined from cases 61 to 75 onward. The rate of conversion and postoperative complications stabilized after cases 61 and 79, respectively, as shown by the CUSUM model. To attain proficiency in laparoscopic rectal cancer surgery, we suggest that the surgical learning curve should entail a minimum of 60–80 cases for a laparoscopic beginner.
Footnotes
Acknowledgments
The authors would like to acknowledge Dr. Sanket S. Mehta, MD, for his technical help and writing assistance.
Disclosure Statement
No competing financial interests exist.