




Abstract
Abstract
Background:
Induction of pneumoperitoneum during laparoscopic surgery leads to diverse cardiovascular changes that can be used as a model to study pathophysiologic phenomena. Application of novel signal processing and figure extraction enabled searching for correlation between various signals and pathophysiologic setting. Our aim was to quantitatively correlate cardiac functionality (as expressed by cardiac output) with the spectral energy of the first heart sound (S1) obtained from the phonocardiogram, during laparoscopic surgery.
Patients and Methods:
Patients who were scheduled for elective laparoscopic operations were enrolled in the study. Cardiac output was maximally changed during anesthesia and abdominal insufflation and was obtained from the arterial pressure wave (FloTrac™ sensor and Vigileo™ monitor [Edwards Lifesciences Ltd.]). Heart signals were recorded during surgery from each subject by a computerized digital data acquisition system. The automatic analysis of the heart sounds included segmentation that was based on the energy envelope of the heart sounds together with analysis of the electrocardiogram signal. We analyzed the morphology of the sounds using hierarchial cluster analysis to remove those sounds that were not reliably recorded. The magnitude of the amplitude of heart sounds was obtained by using the Hilbert transform for each heartbeat. Statistical analysis was based on linear regression.
Results:
Following exclusion of 3 patients (mainly because of technical reasons), we were left with 7 patients who demonstrated statistically significant positive correlation between cardiac index and the amplitude of S1 (regression coefficient between 0.4 and 0.9, P<.05). Linear regression analysis was done on the normalized values of all 7 patients and was found to be highly significant.
Conclusions:
In this study we have demonstrated significant linear correlation between the acoustic amplitude (spectral energy) of S1 and cardiac functionality, through sophisticated computerized analysis, using the pneumoperitoneum model for changing the cardiac output.
Introduction
The information obtained from heart sounds has been studied for decades and correlated with various clinical settings. The acoustic energy (expressed by heart sounds) produced by the mechanical activity of various cardiac components and processes has been used to provide data related to diverse cardiac pathophysiological abnormalities as well as physiological variations. Traditionally, heart sounds are explained by the forceful closure of the atrioventricular and aortopulmonary valves. The first heart sound (S1) is considered to have four subcomponents and reflects the vibration of the entire cardiohemic system due to accelerations and decelerations of blood within the heart and great vessels following ventricular contraction. 1 Specifically, systolic contraction of the ventricles triggers vibrations of the heart walls, valves, and blood. These vibrations propagate through the thoracic cavity and are received on the chest wall as transient low-frequency vibroacoustic signals, commonly known as S1. 2 The mechanical cardiac cycle is continuously controlled by the autonomic nervous system, which induces changes to both rate and intensity of myocardial contraction. In addition, the pulmonary system plays an important part in modulating the cardiovascular mechanical activity by respiratory-induced changes of the pleural pressure, arterial resistance and venous return, namely, preload. 3 As such, the amplitude and morphology of S1 might be related to the force of cardiac contraction. Previous studies have shown effects of hemodynamic changes on characteristics of the heart sounds.4–10 However, most studies were limited to qualitative assessment and were done on animal models. The evolvement of significant technological achievements enabled better various signal processing techniques for phonocardiogram (PCG) analysis.11,12 Applications of different methods for signal analysis were tested to provide the best features and characteristics of the PCG signals.13–15 Application of novel signal processing and feature extraction has demonstrated good linear correlation between the spectral energy and frequency bandwidth of the acoustic signal of S1 and systolic functionality (peak systolic velocity and strain rate) during the pharmacological stress test in human subjects.16,17 In particular, methods that rely on morphological clustering of the heart sounds provide a good handle, enabling the association of different physiological conditions with heartbeats. 18 To achieve robust automatic analysis of heart sounds, it is necessary to perform segmentation of the heart sounds into heart cycles and discern the heart sound components (either only S1 and the second heart sound, or also the third and fourth heart sounds and murmurs).19,20 Often, classification of the heart sounds enables recognition of cardiac pathologies.18,21
In the present study we aim to quantitatively correlate cardiac output (the end point of cardiac functionality) with the spectral energy of S1 obtained from the PCG in patients undergoing upper abdominal laparoscopic surgery. We suggest that the hemodynamic changes that usually follow positive pressure PP (during operation) may serve as a high-quality model to test such correlation. We further demonstrate that it is possible to automatically monitor the heart sound to detect physiological changes associated with abdominal pressure changes.
Patients and Methods
Ten patients who were scheduled to elective laparoscopic upper abdominal surgeries were enrolled in the study. Nine patients had undergone laparoscopic cholecystectomy due to symptomatic cholecystolithiasis, and one underwent gastroplasty. All were categorized as American Society of Anesthesia Class I–II. Informed consent was obtained from all participants, and the study was approved by the local ethics committee (in accordance with the Helsinki Declaration). The study population included 7 men and 3 women, between 31 and 84 years old.
Preoperative medication included diazepam (5 mg) and intravenous first-generation cephalosporin antibiotics. Anesthesia was induced by fentanyl (1–5 μg/kg), propofol (2 mg/kg) or thyopentone (4 mg/kg), and esmerone (0.5 mg/kg) or atracurium, following preoxygenation by mask. Midazolam was additionally prescribed (1–2 mg). Anesthesia was maintained with nitrous oxide in oxygen (2:1), isoflurane (1%), esmerone or atracurium (0/1–0.15 mg/kg), and fentanyl (5–10 mg on demand). Ventilation was mechanically controlled at a frequency and tidal volume to maintain normocapnea. (Normocapnea was maintained by monitoring end-tidal CO2. When increased, tidal volume was slightly elevated, standardized by peak inspiratory pressure. When it was further necessary to maintain normocapnea, a mild increase in respiratory frequency was induced, without affecting cardiac performance.)
All patients underwent laparoscopic procedures following peritoneal inflation by CO2 and the introduction of four cannule, as usually accepted. PP was automatically maintained at 14 mm Hg, at an average insuflation rate of 1–1.5 L/minute.
Intraoperative monitoring included blood pressure, pulse oximetry, continuous electrocardiogram (ECG) recording, and end-tidal CO2.
Cardiac output was continuously derived and recorded from the arterial pressure using a FloTrac™ sensor connected to a Vigileo™ monitor (Edwards Lifesciences Ltd.) (software versions 1.07, 1.14). 22
Heart signals were recorded from each subject by a digital data acquisition system. In brief, the system consists of piezoelectric contact transducers (PPG sensor model 3, OHK Medical Devices), an ECG sensor (model EKG-BTA, Vernier Software & Technology), a preamplifier with high input impedance and a linear frequency range of 1–4 KHz, a 16-bit analog-to-digital converter (model PMD-1608FS, Measurement Computing Corp.), and a recording software written in Matlab version 6.5 (The Mathworks Inc.), running on a mobile computer. The transducers were placed in four auscultation points: 2nd and 4th intercostal spaces at the left sternal border, the suprasternal notch, and the 2nd intercostal space at the right sternal border. The acquired signals were preprocessed by band-pass filtering in order to remove low-frequency baseline wandering and high-frequency ambient noise. Several recordings (at least 30 seconds) were done during surgery with respect to three different phases while the patient was under anesthesia: Before establishment of PP, during PP and operation, and after evacuation of CO2 PP. Figure 1 depicts an example of the recorded heart sounds. Figure 2 demonstrates the final graphical analysis of heart sounds and the respiratory cycle from which the final computerized data are extracted.
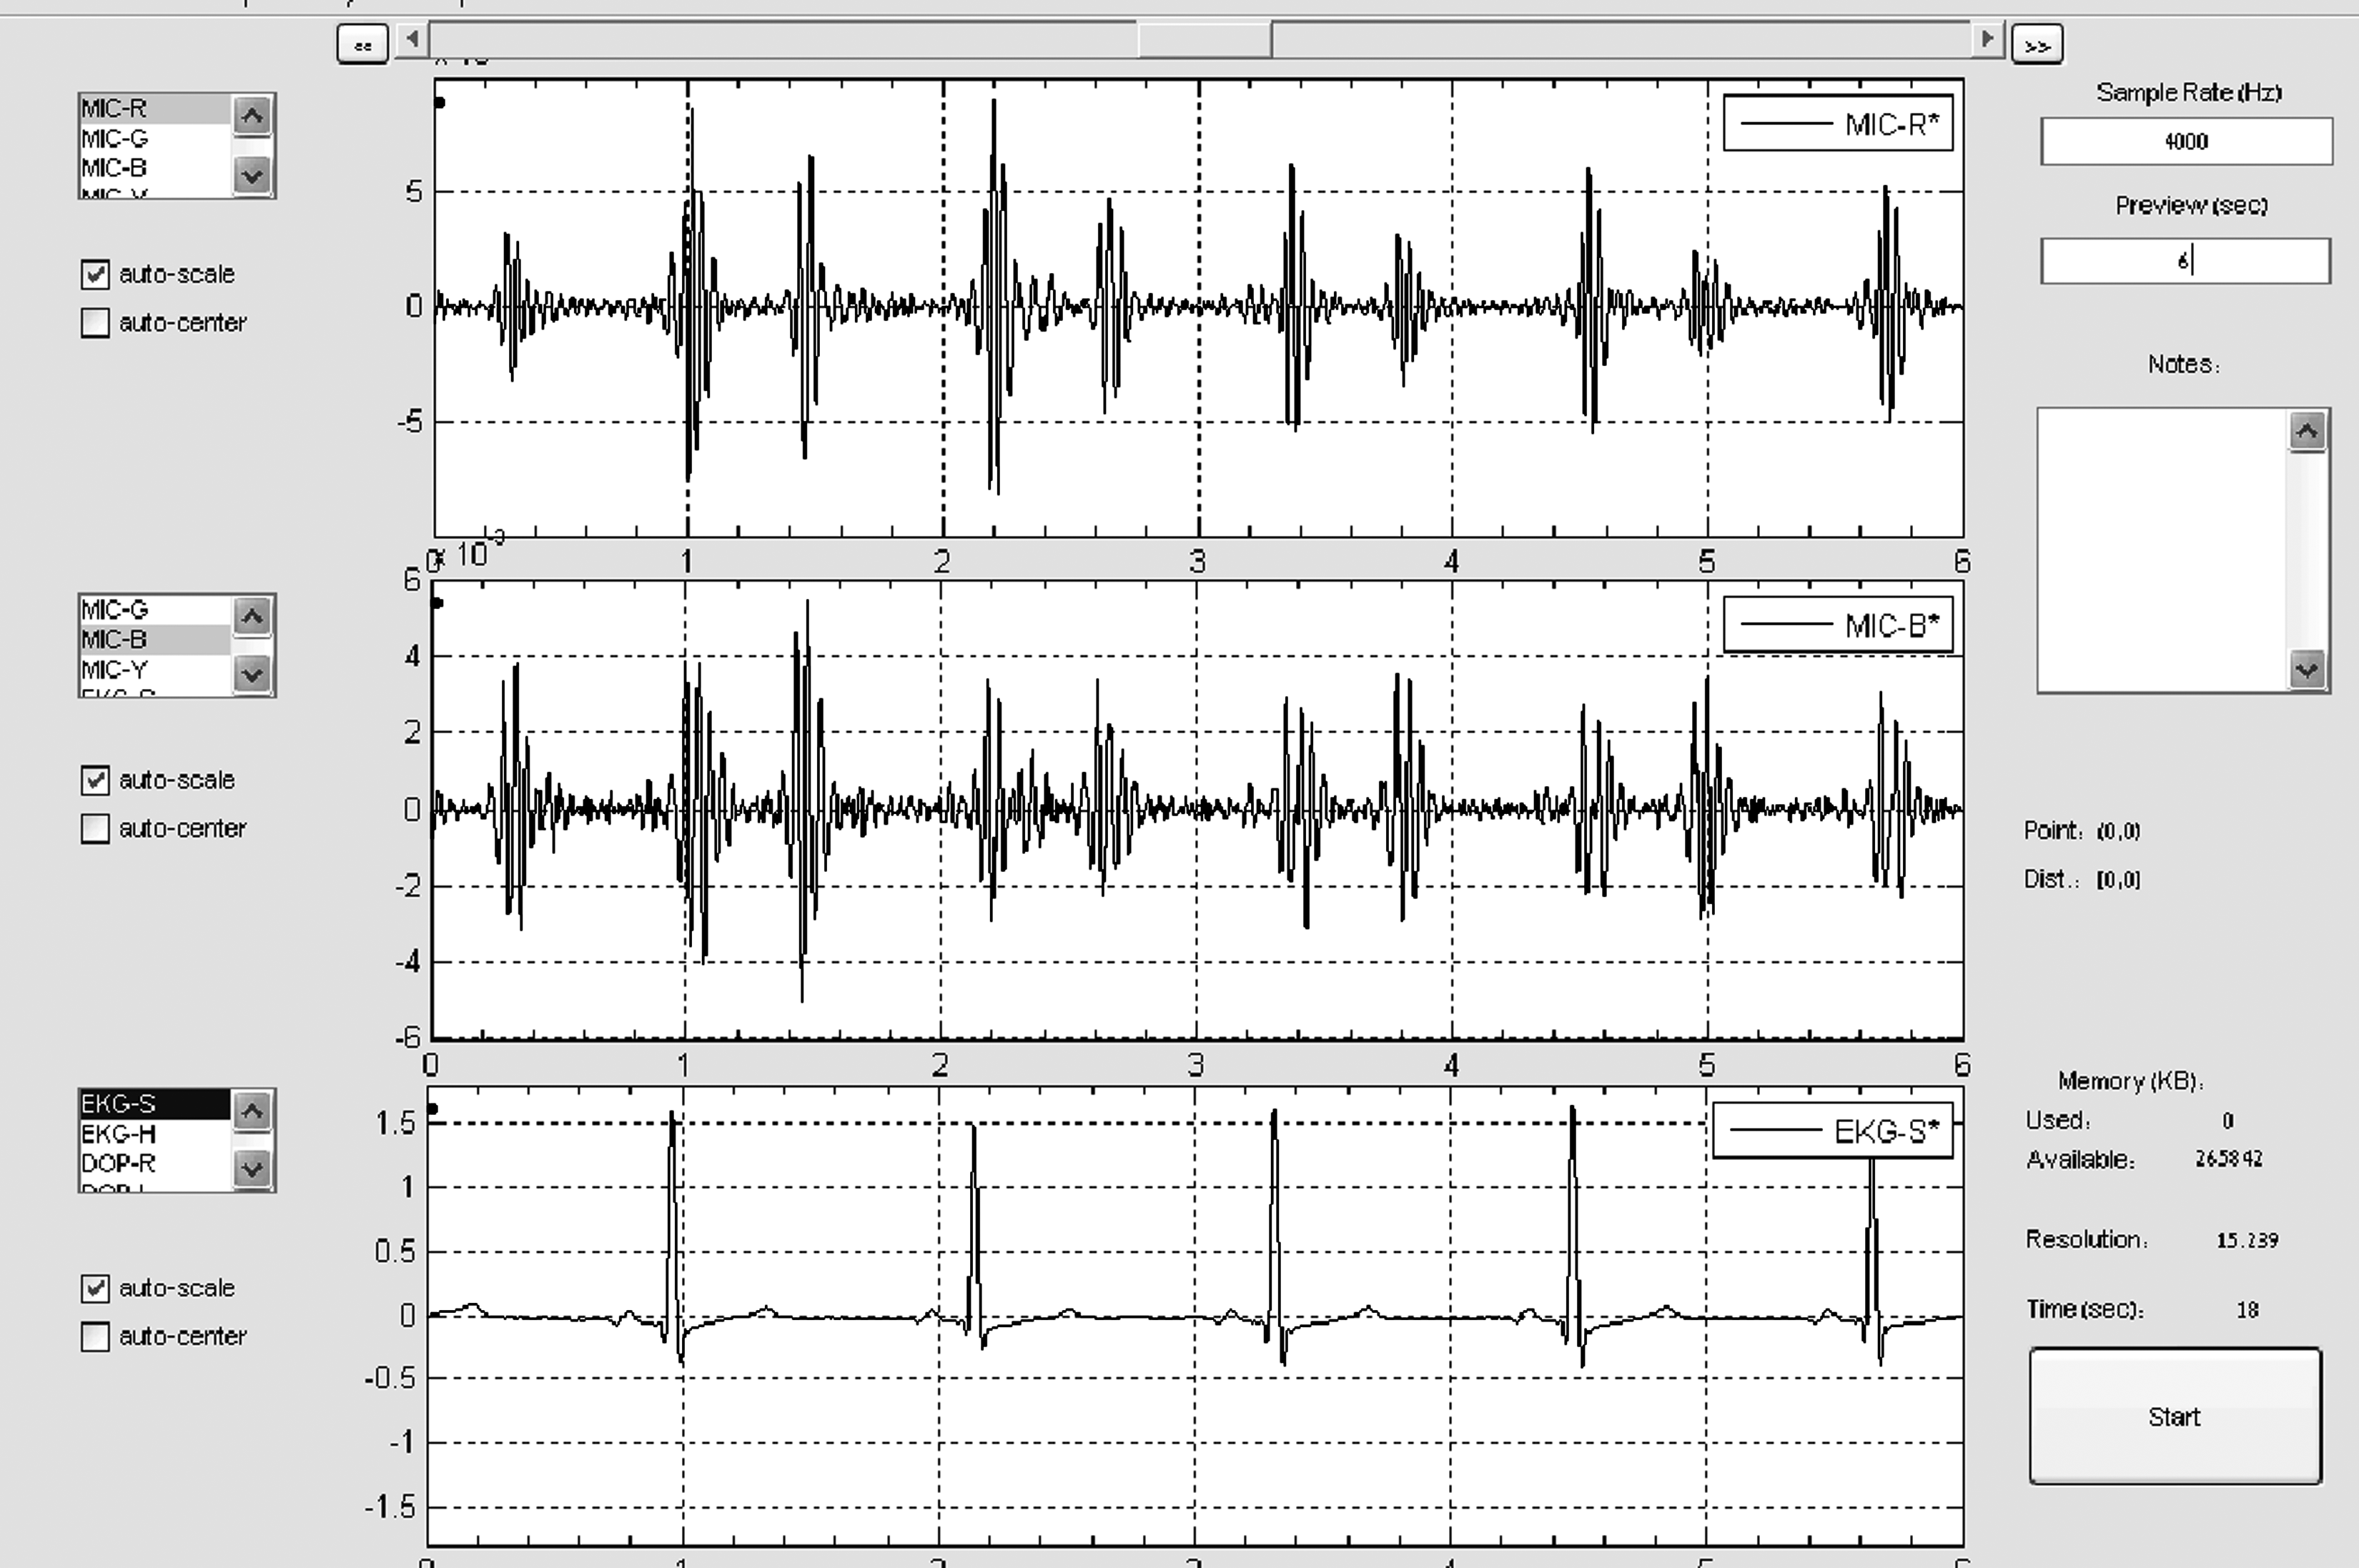
An example of

Graphical analysis of heart sounds and the respiratory cycle, as elicited during the recording. The computerized data are obtained from such an illustrated extract. HR, heart rate; S1, first heart sound; S2, second heart sound.
In the final analysis we included only vibroacoustic signals recorded in a satisfactory quality (i.e., without significant movements of the patient's body causing interruption of the recording and without strong background noise, which sometimes exists in the operation room). Also, for each patient, the analysis included only recordings that were done while the patient's bed position was not changed during surgery. This was necessary so as to avoid any effect on the heart sound amplitude from technical factors such as the distance of the sensor from the heart. The automatic analysis of the heart sounds included segmentation based on the envelope of the energy of the heart sounds together with analysis of the ECG signal for detection of the QRS complex. We further performed a morphological analysis of the heart sounds for finer and more accurate localization and identification of the sounds. This was based on tools that we have recently developed for fine segmentation and morphological analysis.18,23 Following the segmentation of S1 and the second heart sound, we analyzed the morphology of the sounds using hierarchical cluster analysis to remove from the statistical analysis those sounds that were not reliably recorded. A few heartbeat sounds were excluded as a result of the patient's movement or too high background noise in the operating room. The magnitude of the amplitude of heart sounds was obtained by using the Hilbert transform (a linear transformation, widely used in signal processing) of each heartbeat. 24 Statistical analysis of the duration and amplitude changes of the heartbeats was then performed. This heart sound analysis enabled us to identify distinct changes in the sound amplitude.
Amplitude normalization of heart sounds was obtained by dividing the amplitude of each recording by the amplitude of the recording that was obtained prior to the operation. The amplitudes were calculated using the Hilbert transform. By performing such individual normalization, rather looking for the absolute values of the amplitude, we eliminate the dependency of the sound on external factors such as large body mass index or poor placement of the contact sensors.
Statistical analysis was based on linear regression to identify significant correlation between the amplitude of the vibroacoustic signals of S1 and the second heart sound and the cardiac index values.
Results
We studied the relation between cardiac index (cardiac index/body surface area) and the amplitude of S1 (expressed by arbitrary units that were normalized). The relationship was examined by a linear regression analysis.
Three patients were excluded from the study because of technical problems during surgery. One of these was exposed to unexpected variations in intraabdominal pressure (due to muscular relaxation difficulties and technical problems related to the computerized monitoring apparatus), precluding a proper correlation between cardiac index and S1. The other two patients were excluded because of too many changes in their bed position during surgery, which prevented a sufficient number of reliable recordings in each surgical phase.
The remaining 7 patients demonstrated a statistically significant positive correlation between cardiac index and the amplitude of S1. Regression coefficients varied between 0.4 and 0.9 (P<.05). Figure 3 illustrates such correlation in one of the patients, representing a similar trend in all 7 patients. We normalized the values of cardiac index and S1 per each patient, in order to demonstrate the overall trend of such relation (Fig. 4). Linear regression analysis was done on the normalized values of all 7 patients (Fig. 5). The correlation was found to be highly significant (r=0.56, P<1E−6).

The relation between cardiac index and S1 in one patient. The correlation is statistically significant: P=.008.
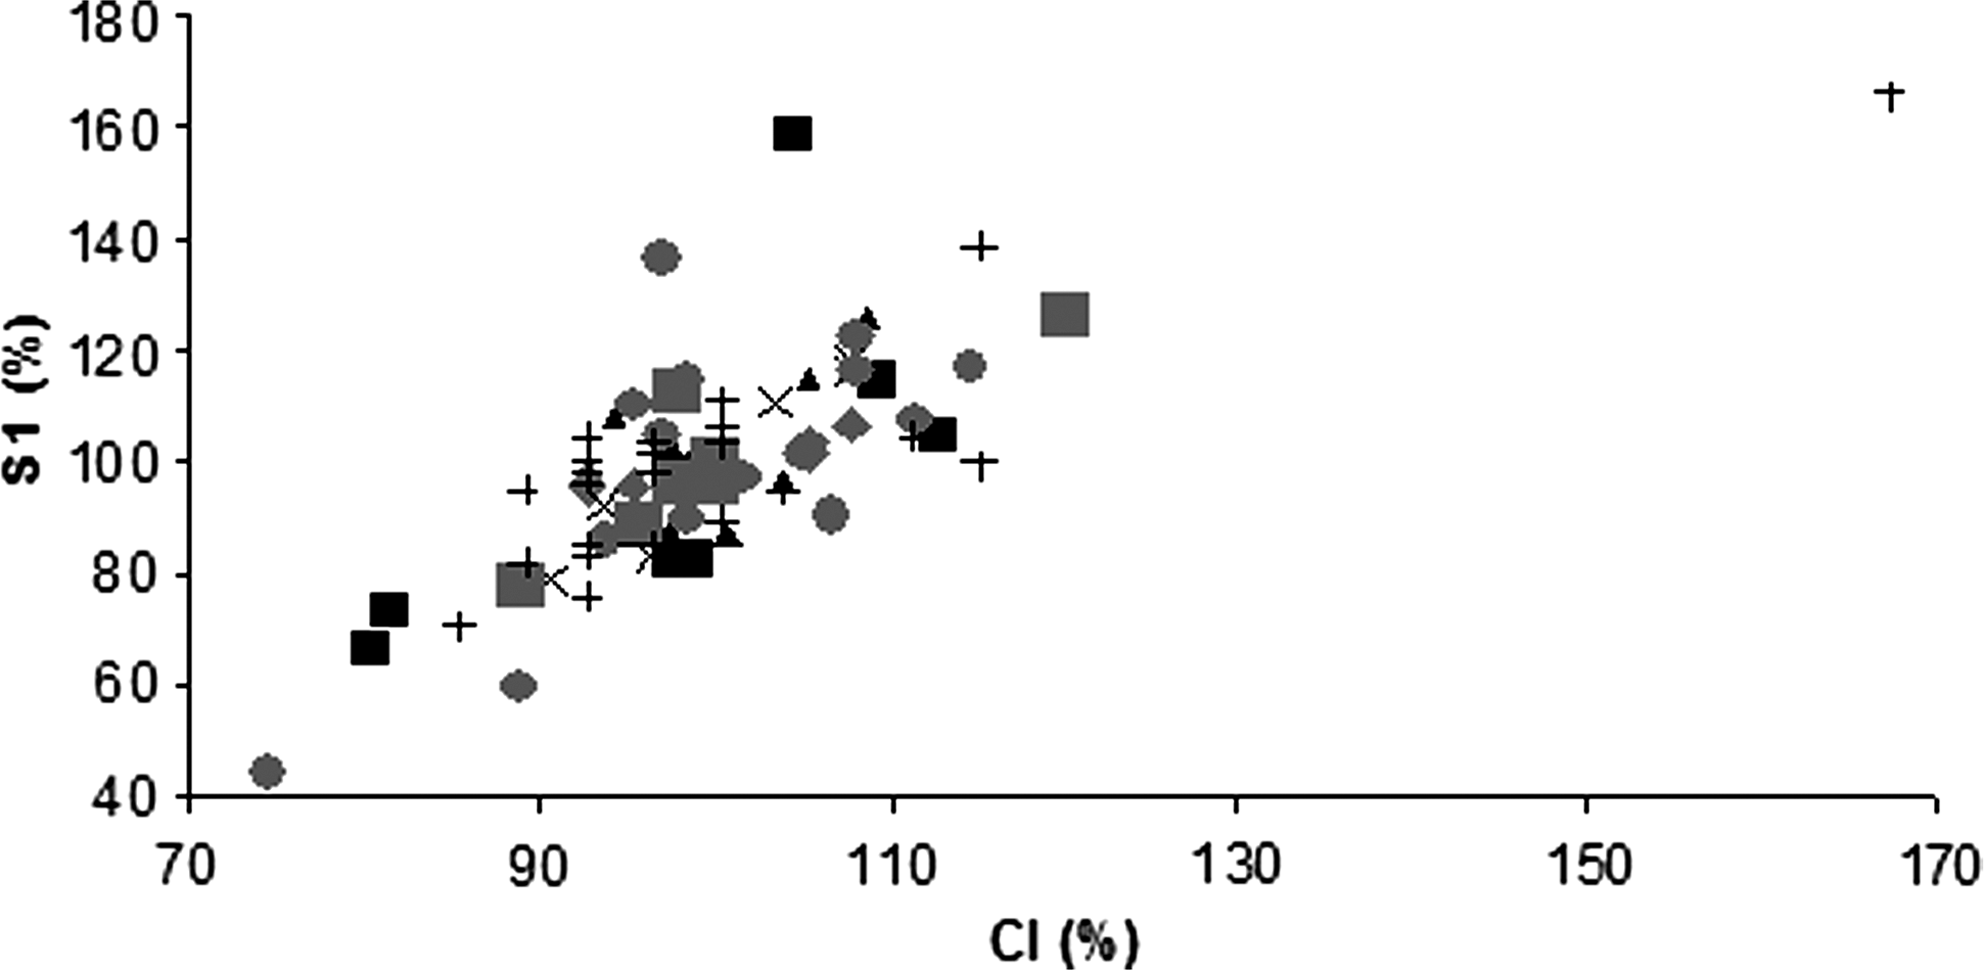
Relation between the normalized values of cardiac index (CI) and S1 of all 7 patients who demonstrated statistically significant correlation between CI and S1.
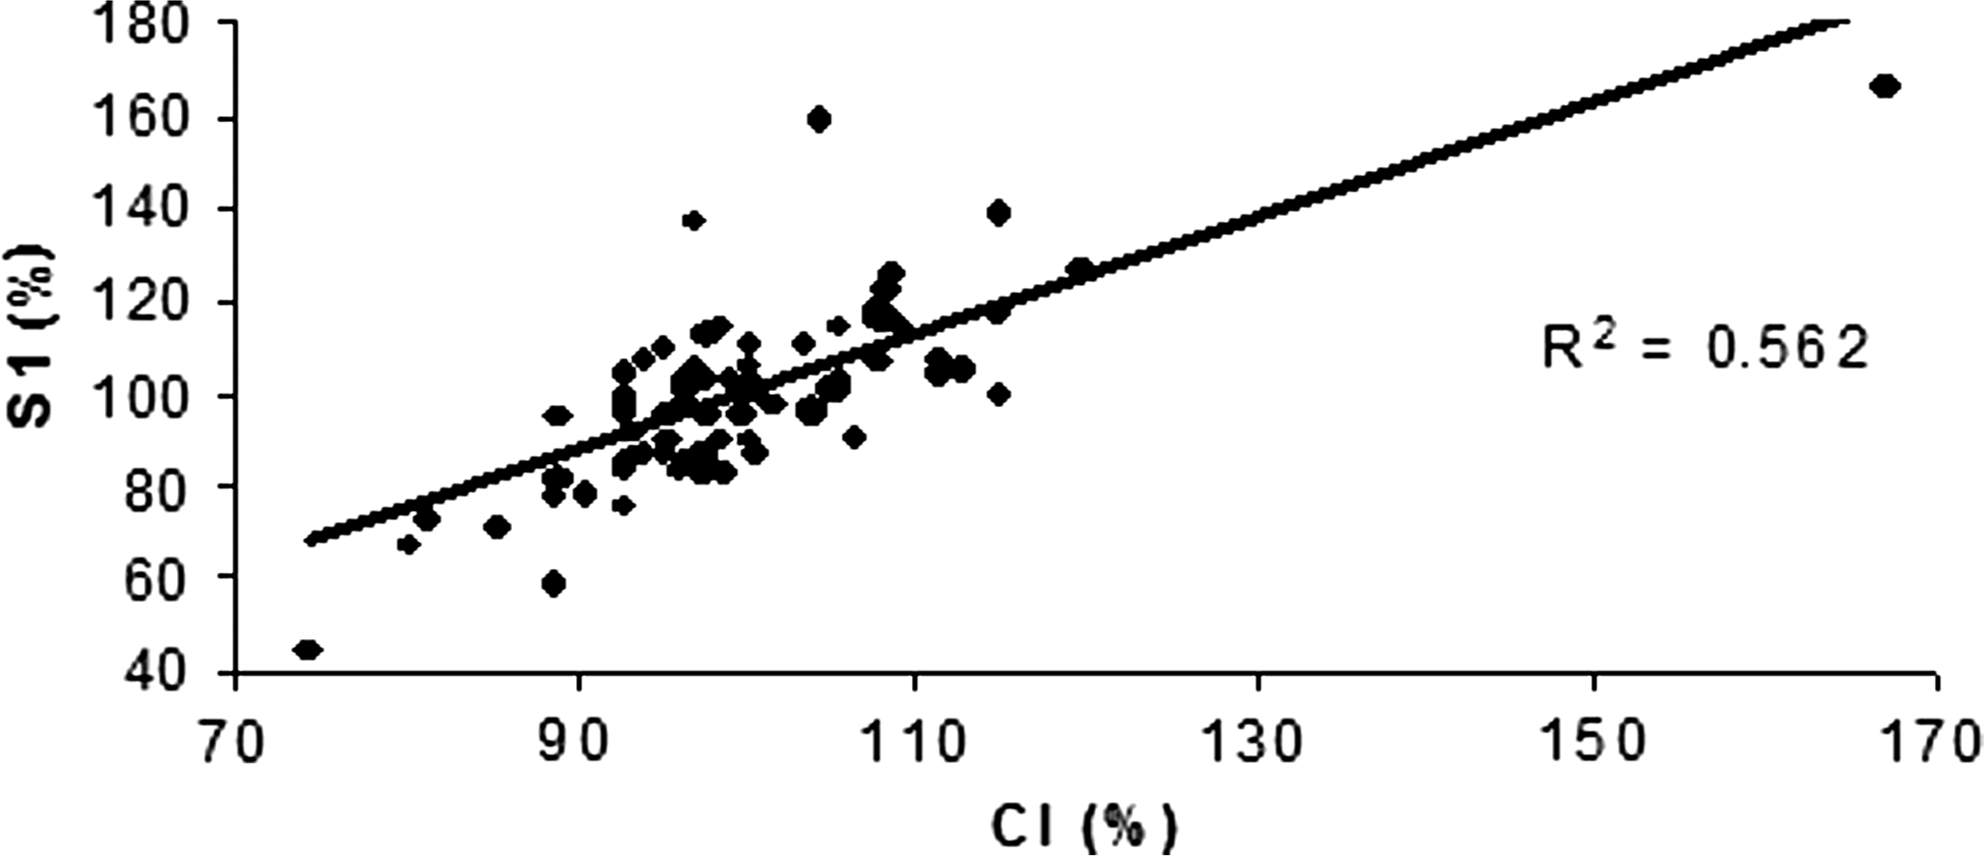
Relation between the normalized values of CI and S1 of all 7 patients who demonstrated statistically significant correlation between CI and S1. The correlation illustrated here is also statistically significant (P=1.09E−10).
Discussion
In the past, it has been shown that the amplitude of S1 is related to the degree of separation of mitral valve leaflets, determined by the relative timing of the left atrial and ventricular systole. Left ventricular contractility was also shown to be an independent factor determining the amplitude of S1.4,25 In this study we have demonstrated significant linear correlation between the acoustic energy of S1 and cardiac index in 7 healthy patients undergoing elective laparoscopic operations. This study complements our previous findings indicating amplitude and sound morphology changes due to intrathoracic pressure changes. 23 Positive pressure PP that was established during surgery functioned as a good physiological model, enabling sufficient hemodynamic fluctuations that were appropriate to delineate such correlation. There was no need for vasomotor drugs with potential harmful side effects, such as those used previously in trials involving animals or human volunteers.4,16
Actually, heart sounds reflect the vibration of the cardiohemic complex, triggered by the acceleration and deceleration of blood through the valves and against the cardiac walls, following abrupt mechanical events of the cardiac cycle. 1 The magnitude, timing, and morphology of heart sounds are influenced by relationships between pressure gradients in the cardiac chambers, muscle tension of the ventricles, and arterial pressure and distensibility. The orchestrated cardiac activity is continuously regulated by the autonomic nervous system and is affected by hormonal and pulmonary activities. The relation between the physiological processes producing the heart sounds and the morphology of the externally acquired acoustic signals is highly complex. The heart sounds, and in particular the amplitude of S1, directly manifest the mechanical heart cycle and actually reflect the contractility of the left heart ventricle.4,25 The computational analysis framework included detailed heart sound morphology analysis and automatic elimination of noisy heart beats via clustering analysis. This novel signal processing and feature extraction method essentially followed and enabled us to delineate a linear relationship between the acoustic amplitude (spectral energy) of S1 and cardiac functionality. 18 Although this is in accordance with previous studies reporting the influence of various cardiac indices on the acoustic energy of S1, the current work expresses such interplay for the first time, by using the end result of cardiac performance, namely, cardiac output.4–10
Technically, it is not possible to correlate an absolute measure of cardiac sounds to cardiac output, as the measurement is dependent on several external factors that cannot be controlled. Thus, to capture the correlation between the amplitude of S1 and cardiac output, a correlation that can be applicable across patients, we used a normalized measure of amplitude. This measure was obtained by dividing the amplitude of each heart sound by amplitude of the reference heart sound obtained individually. For reference we have chosen the average amplitude of the sound at rest, which, in this case, is before the beginning of the operation. Using such a normalized measure removes individual factors like body mass index and electrode location and enables concentration on the slope of the change and equate this with the change in cardiac output.
The clinical utility of our technology (depending on further cumulative data supporting our findings) might be the application of noninvasive cardiac monitoring in medicine, particularly in general as well as laparoscopic surgery. Based on the concept of using PP during laparoscopic surgery as a novel experimental model to study cardiovascular phenomena, we might expect further clinical (medical) and scientific profits.
The limitation of the study is the small number of participants, making it a preliminary work. Another limitation concerns the production of nonperiodic external noise made by distortion of body movements and environmental sounds noise that may affect the morphology of the recorded signals. Some technical problems that were faced during the acoustic recording, leading to the exclusion of some participants (described in Results), should be overcome in the future in order to test our computerized analysis system on a broader study population.
In conclusion, using sophisticated computerized analysis, a significant linear correlation was demonstrated between acoustic heart signals of S1 and cardiac output, using the PP model. The PP model was found to be advantageous and feasible, as PP was induced as a prerequisite part of an elective laparoscopic surgery. Beside the scientific relevance of the study and the possibility of improving intraoperative monitoring during laparoscopic operations, establishing such a correlation may lead to the use of such sophisticated analysis methods for cardiac noninvasive monitoring in the future. We also recommend using the PP as a model for further physiological research.
Footnotes
Disclosure Statement
No competing financial interests exist.