
Abstract
Purpose:
Acute appendicitis (AA) is a common surgical emergency affecting 7–8% of the population. Timely diagnosis and treatment are crucial for preventing serious morbidity and mortality. Diagnosis typically involves physical examination, laboratory tests, ultrasonography, and computed tomography (CT). This study aimed to evaluate the effectiveness of artificial intelligence (AI) in analyzing CT images for the early diagnosis of AA and prevention of complications.
Methods:
CT images of patients who underwent surgery for AA at the General Surgery Clinic of Kanuni Sultan Suleyman Health Application and Research Center between January 1, 2019, and June 31, 2023, were analyzed. A total of 1200 CT images were evaluated using four different AI models. The model performance was assessed using a confusion matrix.
Results:
The median age of the patients was 28 years, with a similar sex distribution. No significant differences were observed in terms of age or sex (P = .168 and P = .881, respectively). Among the AI models, MobileNet v2 showed the highest accuracy (0.7908) and precision (0.8203), whereas Inception v3 had the highest F-score (0.7928). In the receiver operating characteristic analysis, MobileNet v2 achieved an area under the curve (AUC) of 0.8767.
Conclusion:
AI’s role in daily life is expanding. In the present study, the highest sensitivity and specificity were 77% and 86%, respectively. Supporting CT imaging with AI systems can enhance the accuracy of AA diagnoses.
Introduction
Acute appendicitis is a common emergency abdominal surgical pathology with a lifetime development rate of 8.6% in men and 6.9% in women. 1 Anamnesis, physical examination, laboratory findings, and imaging methods play an important role in the diagnosis of this disease. For this purpose, various diagnostic tests have been utilized to increase diagnostic accuracy. Among the diagnostic methods used, ultrasonography (USG) has a sensitivity of 74% and a specificity of 94%. 2 Computed tomography (CT), which is used in adults and for differential diagnosis, has a sensitivity of 88–100%, specificity of 91–99%, and accuracy of 94–98%. 3
Complications due to delayed diagnosis may result in morbidity and mortality. The most common complication is perforation, which occurs in approximately 13–20% of patients and usually develops within 24 hours after the onset of the disease.4,5 Less frequently (4%), an abscess develops in the intra-abdominal or pelvic region. 6 Therefore, an early and accurate diagnosis is important to prevent complications.
Artificial intelligence (AI) is a machine system that simulates human intelligence and completes tasks without human intervention. 7 Prediction models created from many datasets have popularized the use of AI in diagnostic processes in health care systems. 8
In our study, we aimed to evaluate the diagnostic performance of CT in suspected patients treated with AI to prevent acute appendicitis complications and reduce morbidity and mortality.
Materials-Methods
Dataset and ethics committee
In this study, the dataset consisted of 2400 images of 1200 acute appendicitis patients and 1200 healthy patients. The resolution of all the images obtained was 1164 × 734 pixels (px). The images in the dataset were partitioned such that 77.5% of the images were used for model training, 2.5% for validation, and 20% for the test group.
Images were collected at the General Surgery Clinic of Kanuni Sultan Süleyman Training and Research Hospital. Images from the disease group were collected from 400 random patients who underwent surgery for acute appendicitis and had CT images available during the diagnostic process. Images from the healthy patient group were collected from 400 random patients with CT images who were hospitalized in the general surgery clinic for other reasons without appendiceal pathology.
The ethics committee of Kanuni Sultan Suleyman Training and Research Hospital approved this study (approval number 80929729-000-5628).
Convolutional neural network model architectures
For image classification, the convolutional neural network (CNN) model architectures MobileNet v2, 9 Inception v3, 10 EfficientNet b2, 11 and ResNet v2, 12 which have various model depths, numerous parameters, and computational loads, were selected (Table 1). Only the feature extraction parts of the models were used, and a single-layer binary classifier model was added after the feature extraction parts to create the final model structure.
Model Information
px, pixels.
Model experiments
The experiments were performed without data augmentation of the classifier model. When transfer learning was used, the parameters of the feature extraction part were not updated if the model was frozen during the training process. In other words, only the parameters of the fully connected part were learned during the training. In our models, a predetermined fixed number of epochs were used and performed 20 times. During the training of the models in this study, the Adam optimizer was used to update the model parameters during the backpropagation phase. 13 Because the result evaluated in this study is a binary classification problem, we calculated the binary cross-entropy loss at the end of the backpropagation at each epoch. The batch size is a parameter that determines the number of samples used in each training iteration and how much data the network will process in one step during the training process. The batch size calculates the gradients to be used to update the network and is set to 32 in our system. The other settings used for training the model are listed in Table 2. All experiments were performed using the TensorFlow framework (version 2.5.0) and the Python programming language (version 3.8.8).
Model Parameter Adjustments
Statistical analysis and evaluation
Categorical variables are presented as frequencies and percentages, and continuous variables are presented as median (minimum-maximum) and interquartile range (IQRs). The normality of continuous variables was checked using the Shapiro–Wilk test. The Mann–Whitney U test was used for continuous variables that did not show a normal distribution. The chi-square test was used to compare categorical variables. All analyses were performed using the Statistical Package for Social Sciences (version 22.0; SPSS Inc., Chicago, Illinois, USA), and results with P < .05 were considered significant.
The performance of the models was evaluated by creating 2 × 2 confusion matrices corresponding to the outputs (Table 3). As the aim of our study was to evaluate acute appendicitis, these patients were considered to have positive images. After the images were evaluated by the models, a value from the matrix was assigned to all outcomes.
The Confusion Matrix
Based on the results obtained from the confusion matrix table, four performance values were obtained. Accuracy, which measures the proportion of correct guesses in the whole test group, could not be used as a single evaluation criterion because of the proportion of correct guesses from individual classes. This problem was eliminated by calculating the precision and recall results of the performance-evaluation process. Precision is the ratio of true correct predictions to all correct predictions, while recall is the ratio of correct predictions to all true positives. The F1 score is the harmonic mean of the precision and recall values, and this value was used to provide common information regarding both results. The effectiveness of the studied parameters in identifying patients with acute appendicitis was evaluated by receiver operating characteristic (ROC) analysis, and area under the curve (AUC) data were calculated.
Results
A total of 800 patients were included in the study: 535 (66.88%) were male, and 265 (33.13%) were female. The median age was 28 (17–88) years (IQR, 13).
As a result of randomized training and testing of the models, different values were observed between the models. The results of the model are listed in Table 4. When the results of all the models were analyzed, it was observed that the diagnosis of acute appendicitis was detected with low error rates in all four CNN models. The highest recall and F1-score values were 0.7808 ± 0.0505 and 0.7928 ± 0.0147, respectively, for the Inception v3 model. The model with the highest accuracy and precision was MobileNet v2, with values of 0.7908 ± 0.0068 and 0.8203 ± 0.0203, respectively. The MobileNet v2 model had the lowest number of parameters compared with the other CNN architectures.
Prediction Performance of the Models (Presented as the Mean ± Standard Deviation)
The ROC analysis results of the models (Fig. 1) showed that the MobileNet v2 model achieved an AUC of 0.8767 (95% CI 0.8740–0.8794), the Inception v3 model reached an AUC of 0.8784 (95% CI 0.8758–0.8810), the EfficientNet b2 model reached an AUC of 0.8412 (95% CI 0.8399–0.8424), and the ResNet v2 model reached an AUC of 0.8341 (95% CI 0.8310–0.8371). No comparison was made between the models; however, the highest AUC values were observed for the MobileNet v2 and Inception v3 CNN models.
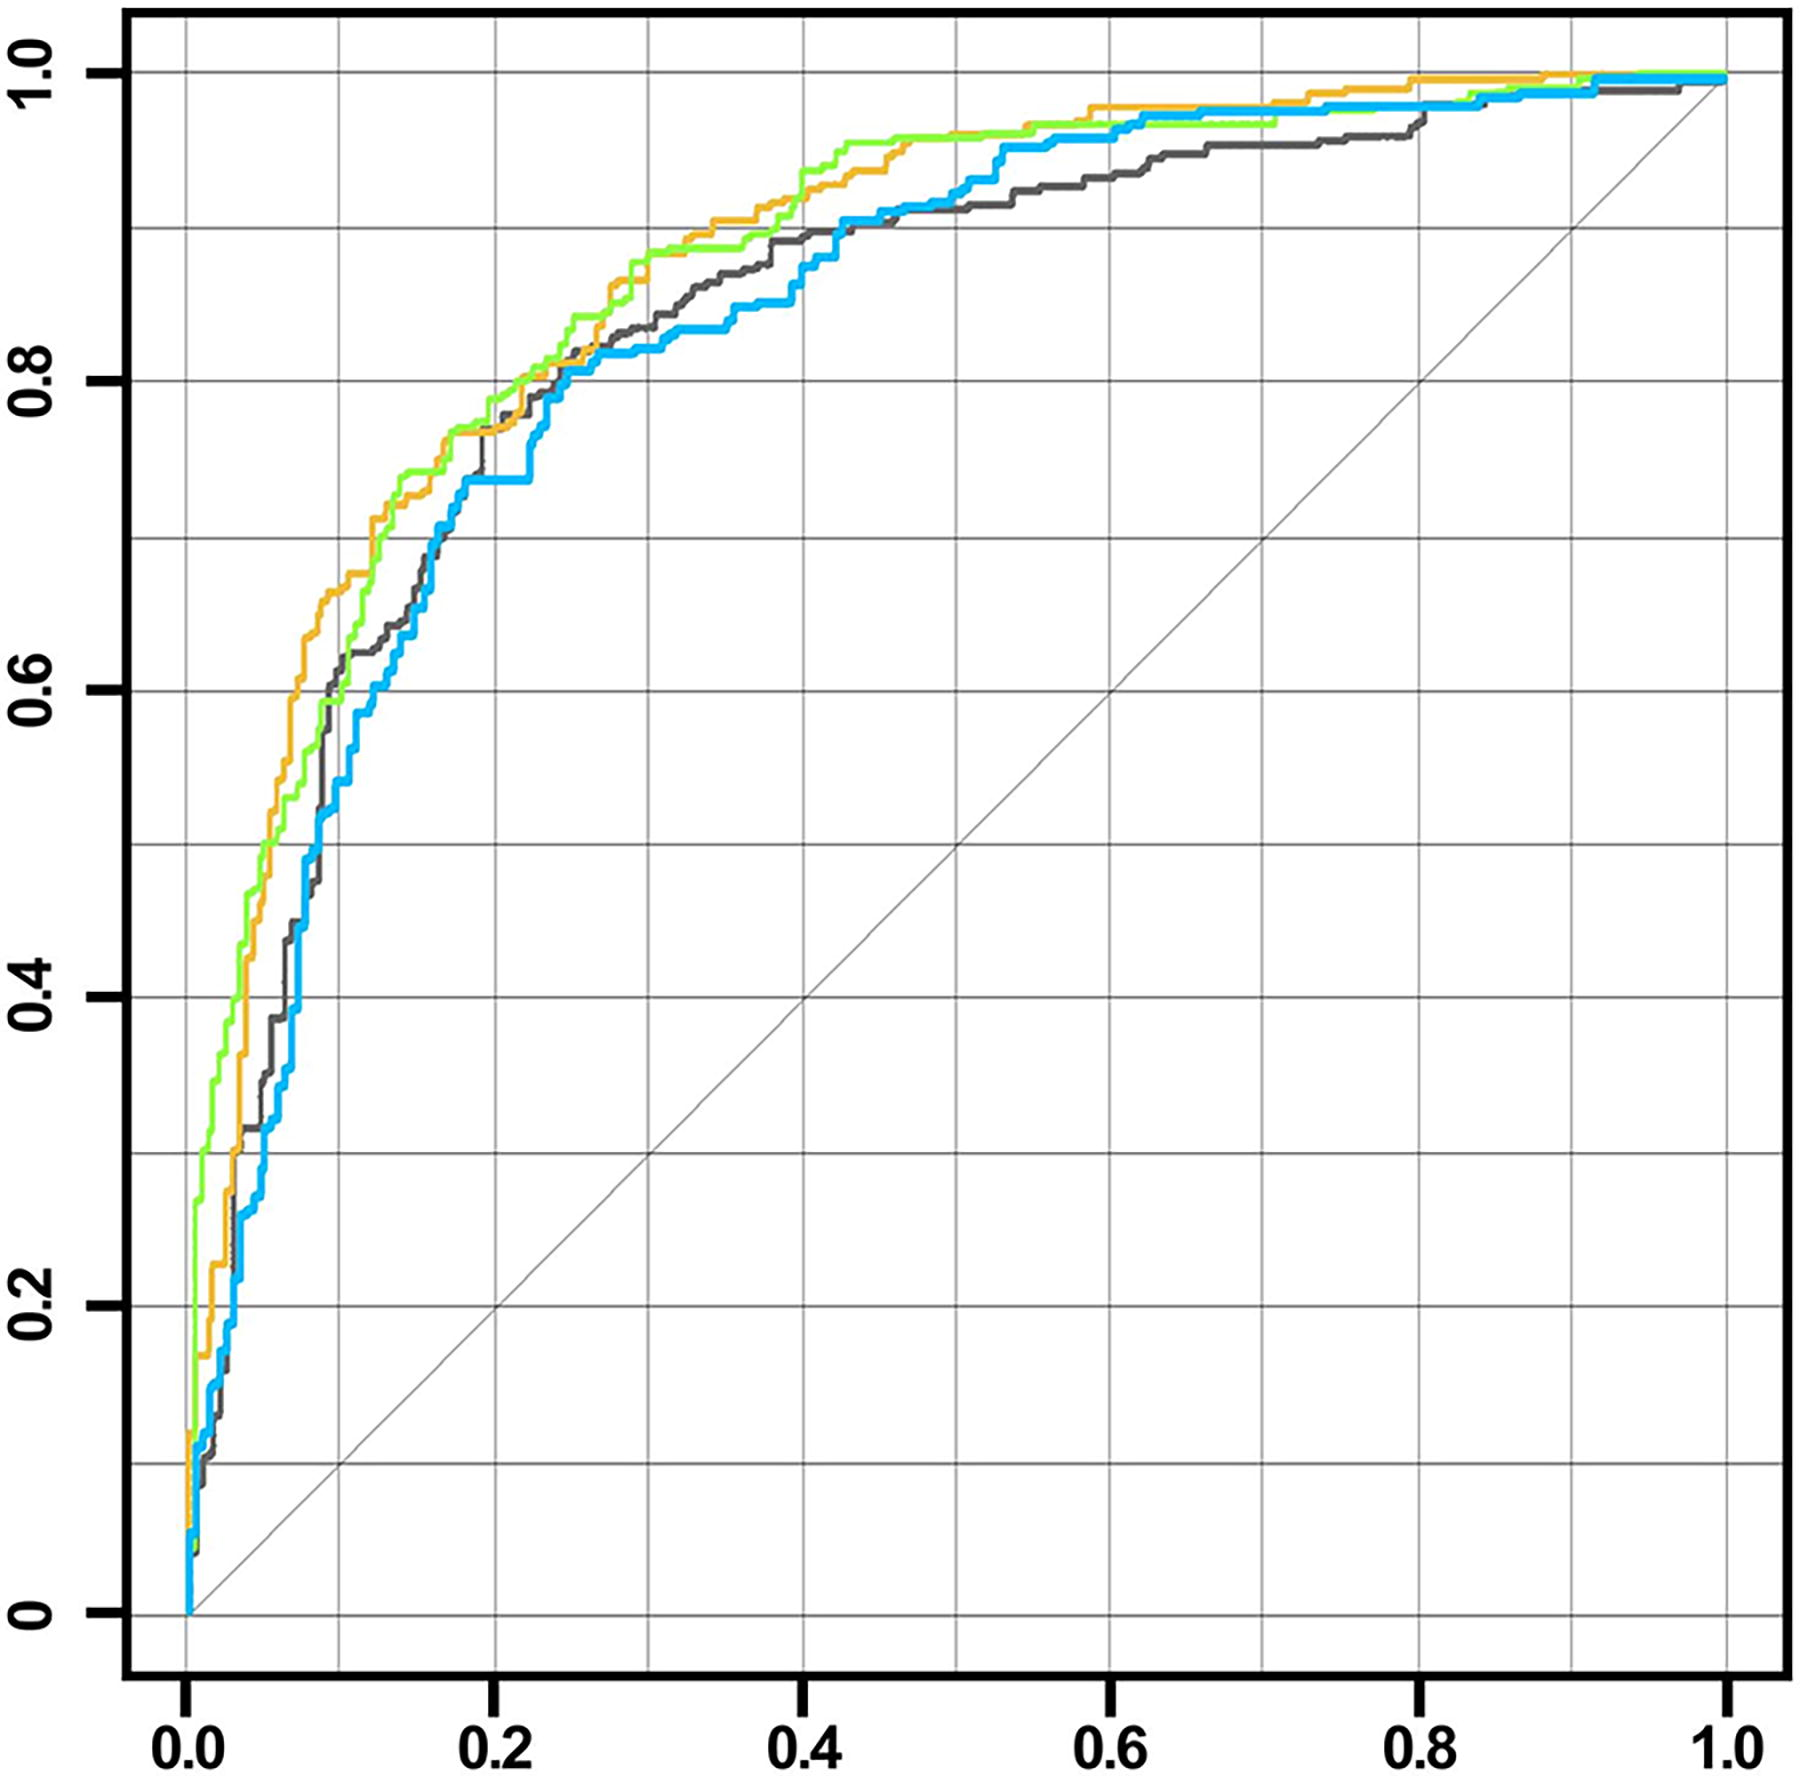
ROC curves of all the models (Yellow: MobileNet v2, Green: Inception v3, Blue: EffcientNet b2, Black: ResNet v2). ROC, receiver operating characteristic.
Training loss graphs were created to visualize the performance of the CNN models during training. This graph shows how well or poorly the model performed in each training period. In the best CNN case, the training loss of the model decreased over time, and the model performed better on the data. Decreasing the training loss indicates that the model is better able to recognize patterns in the dataset and that its generalization ability increases. The learning graphs of the models are shown in Figure 2.
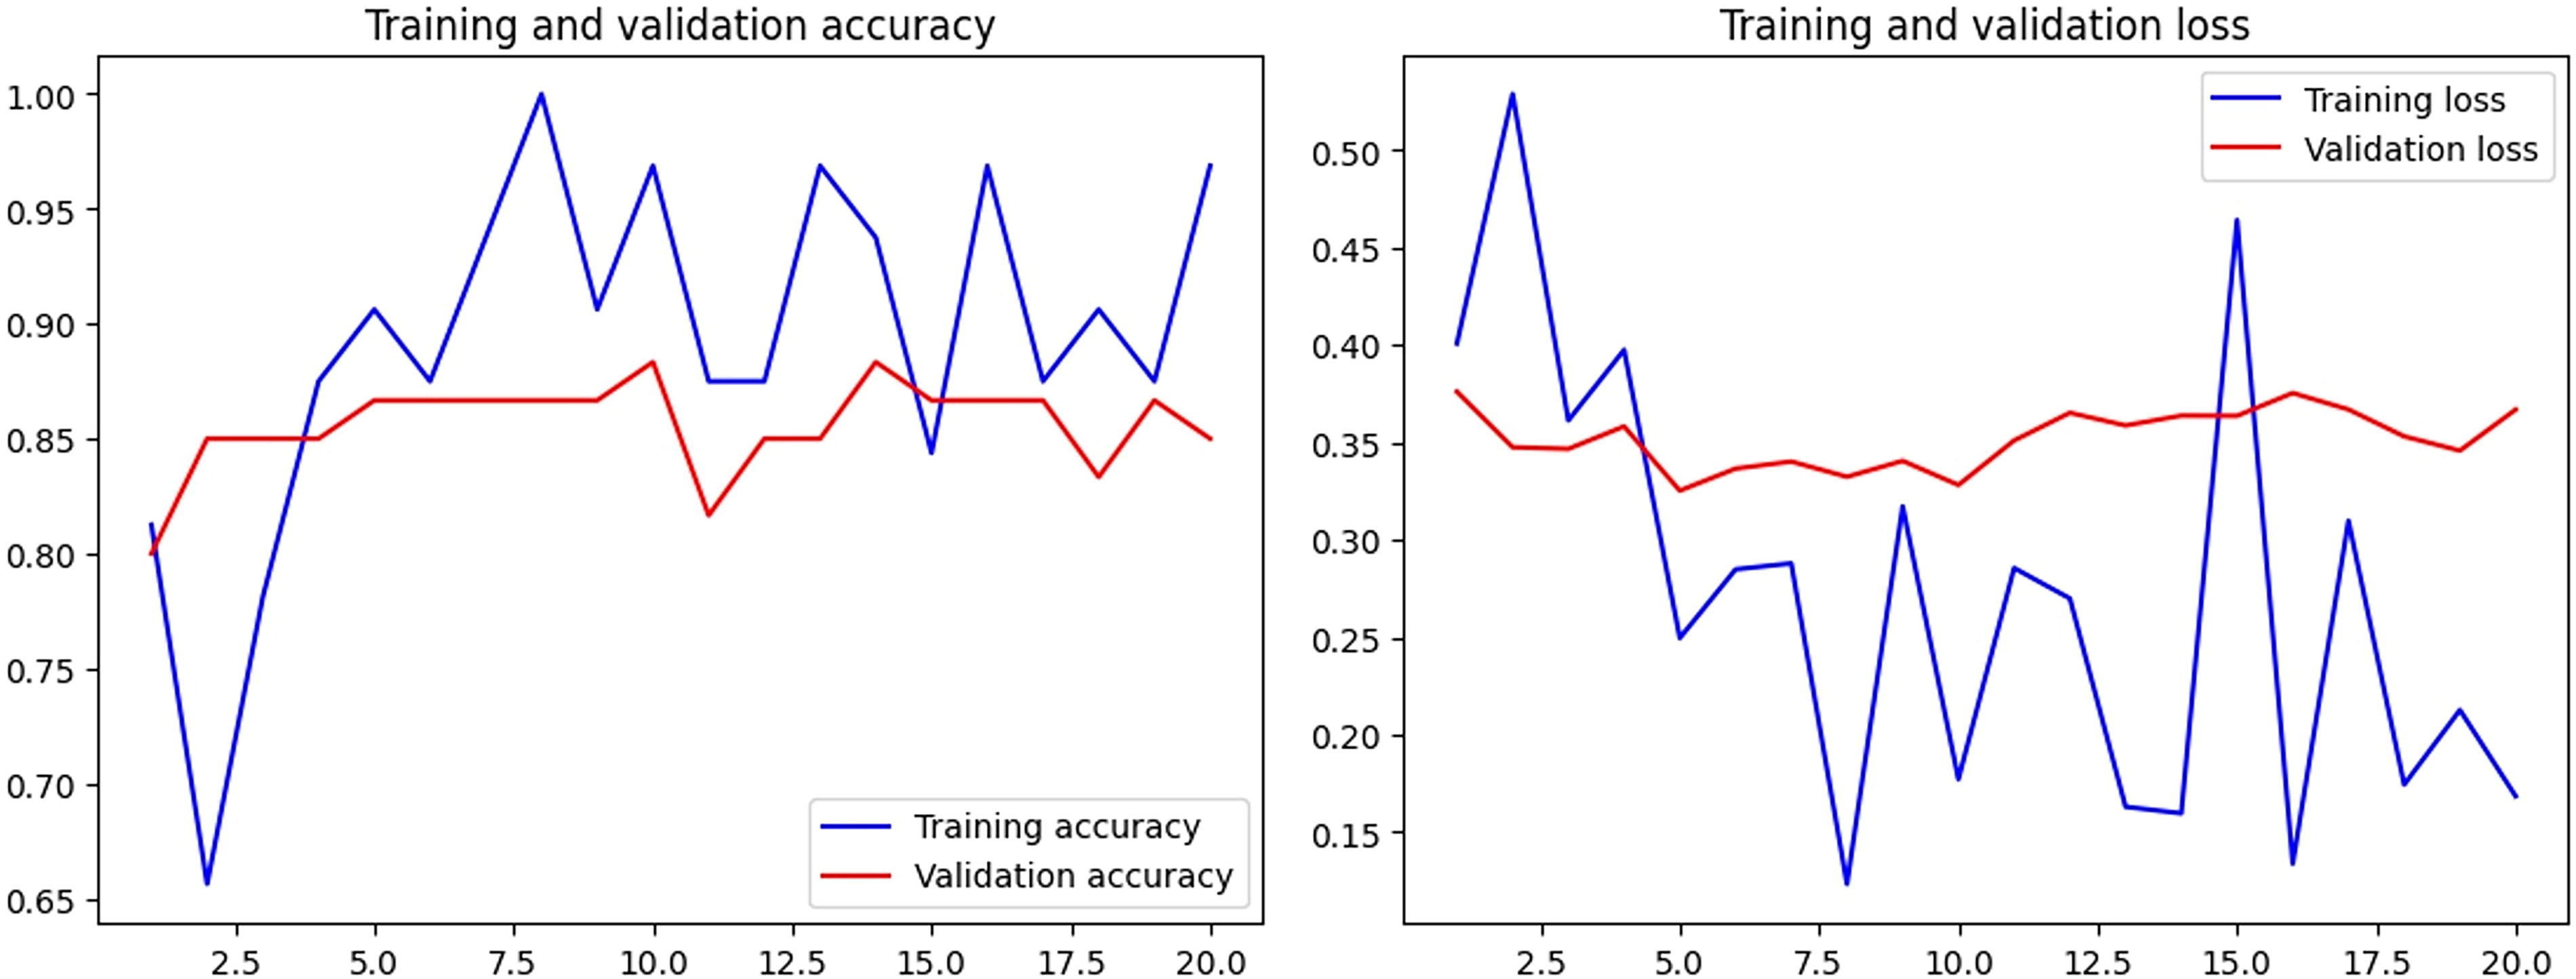
Training loss-accuracy graphs of the AI model with the best results (MobileNet v2). AI, artificial intelligence.
Discussion
Acute appendicitis is the most common clinical presentation of an acute abdomen in general surgical practice. Despite the fact that clinical findings have different results for each patient, the lack of diagnostic value of imaging methods and the clinical scoring systems developed, the diagnosis of AA is still not easy. Among the complications that may arise as a result of delayed diagnosis, perforation is observed in 13–20%, and pelvic or intra-abdominal abscess is observed in 4% of cases.4,6 These data support an early diagnosis of AA.
Acute appendicitis is relatively more common in males (male-to-female ratio, 1.4:1) and occurs most frequently in the second and third decades of life. In our study, a high male incidence was observed, similar to the literature, and similar results were obtained in terms of age (male-to-female ratio 2.02:1, median age 28 years). In addition, no difference was observed between the AA and healthy groups. These results confirmed that the groups in our study had a homogeneous distribution.
Various techniques have been developed for the treatment of acute appendicitis using AI and medical diagnostic methods. In the first study, artificial neural networks were used for the diagnosis of AA, and the laboratory findings and clinical results of the patients were evaluated. In some of these studies, the accuracies were 88.2%, 14 97.9%, 15 91%, 16 and 81.7–93.5%, 17 respectively. The accuracy rates were found to be high in these studies, in which the diagnosis of acute appendicitis was definite and the findings were generally collected for the diagnosis of acute appendicitis. Imaging methods were not evaluated in any of these studies.
In another study, USG, one of the most frequently used imaging methods for the diagnosis of acute appendicitis, was evaluated. In the evaluation of USG images by Kim et al. using an AI model named fuzzy C-means, images from 85 patients with acute appendicitis were used, with an accuracy rate of 96.47%. 18 The need for a specialist physician to perform a USG examination and the use of patients diagnosed with AA in the present study may be the reasons for the high success rate.
Lee et al. evaluated the diagnoses of AA and diverticulitis using 2D CT images. Of the 500 patients included in the study, 2782 axial CT slices were recorded for AA and 823 were recorded for diverticulitis. In a study using the EfficientNet model, the accuracy of EfficientNet b2 was 90.47%, and the precision was 92.78%. 19 In this study, which was conducted using CT, the absence of a negative group and the fact that only the accuracy of the real patients was considered in the model supported a high rate of correct prediction.
This article was published by Park et al. in 2023; 246 patients with acute appendicitis and 215 healthy controls without acute appendicitis were examined by introducing CT images into the EfficientNet model. The sensitivity, specificity, and accuracy of the model for predicting AA were 85.6%, 86.5%, and 86.07%, respectively. 20 A total of 646 patients were included in the study by Rajpurkar P. et al., who developed a model named AppendiXNet. In this study, which was published in 2020, the diagnosis of acute appendicitis was attempted by examining CT images in three dimensions. The detection rate of AA was 81%, while the detection rate of a normal appendix was 43–58%. 21 A study by Park JJ. et al. CT images obtained from 215 patients with acute appendicitis and 452 healthy subjects were recorded in three dimensions. The mean age of the participants in the study group was 45.6 years, and the male/female ratio ranged from 49.62% to 50.38%. The images were analyzed using CNN models designed for three-dimensional examination, and the sensitivity and specificity were 90.2% and 92%, respectively. 22
In our study, the model success rates were similar to those of other two-dimensional studies in the literature (accuracy: 0.7908; precision: 0.8203; recall: 0.7466; F-score: 0.7808). Compared with three-dimensional imaging, it is predicted that evaluating images from different angles increases the success rate of the model, and the precision, accuracy, and F-score are high in 3D studies in the literature.
Consequently, AI and technologies related to AI are becoming common in daily life. In this changing world, AI diagnostic tools are used, and the results are often similar to and better than those in the literature. We believe that if the use of CT imaging in the diagnosis of acute appendicitis is supported by AI systems, the sensitivity, specificity, and accuracy will increase in the diagnosis of AA.
Our study has several limitations. Only patients with acute appendicitis pathology data were included in this study. Patients with other gastrointestinal system findings were also excluded from the study. In this case, it can be thought that the model may lead to specific evaluation of AA patients and may not show real performance value. In addition to its retrospective design, future prospective randomized studies will increase the reliability of our results.
Footnotes
Authors’ Contributions
O.S.: Data collection and analyses; S.Y.: Statistical analyses, revision of the article, and drafting of the article; E.S.: Clinical practice, drafting article; E.B. and O.S.: Concept/design, data interpretation, and drafting and revision of the article; A.O., M.O.A., C.O., and O.S.: Clinical practice and data collection; E.A.: Data analyses, data interpretation, and critical revision of the article.
Author Disclosure Statement
The authors declare that they have no affiliations with or involvement in, any organization or entity with any financial interest in the subject matter or materials discussed in this article.
Funding Information
No funding was received for this article.