
Abstract
Abstract
Introduction:
Lymphedema is a chronic disease of increasing importance to cancer survivors. A tape measurement tool used for lymphedema relies on indirect volume calculations based on external circumference, which may not reflect the true extent of abnormal fluid accumulation accurately. Fluid-sensitive MRI sequences may be able to delineate the severity of this condition more precisely and thus also monitor response to therapy.
Methods and Results:
Eight patients being followed by physical therapy for clinically diagnosed breast cancer-related lymphedema were recruited to participate in this study. External measurements and upper extremity MRI were performed on all subjects. Arm circumference, arm volume, and lymphedema volumes were calculated for each method. MR imaging detected lymphedema in all study subjects. Correlation was found between external circumferential measurements and with the 3.0T MRI (r=0.9368). There was poor correlation between lymphedema volumes calculated from clinical measurements and MR imaging (r=0.5539).
Conclusions:
External measurements were not found to be an accurate measure of lymphedema volume associated with breast cancer lymphedema. MRI is a reliable means to obtain upper extremity circumferential and volume measurements. MRI is able to evaluate morphologic change associated with breast cancer-related lymphedema. Lymphedema research requires integrated use of tools to further describe the disease process over time, quantitate the distribution of tissue changes, and improve the sensitivity and specificity of the measurements.
Introduction
T
Lymphedema is a high protein edema of a body part, typically an extremity, breast, or trunk, that results from decreased lymphatic transport or increased lymphatic load. This may lead to persistent swelling and soft tissue change that may have a substantial effect on quality of life and perception of well-being.3–7
Incidence of lymphedema has been challenging to quantify as there is no agreed upon standard for diagnosis/diagnostic criteria and those that do exist vary broadly. Incidence estimates of breast cancer-related lymphedema (BCRL) vary widely and a recent review reports a range of 2%–65% based on various factors such as surgical technique, axillary sampling/sentinel lymph node biopsy (SNLB) methods, radiation therapy fields, and utilization of chemotherapy. 8 The incidence of lymphedema remains controversial due to discrepancies in measurement methods and the length of follow up studies. The timing for presentation of lymphedema shows a correlation between how long breast cancer survivors live and lymphedema development. 9 As the survival rate increases for breast cancer, the prevalence of BCRL will be considerably larger. 10
Several studies have explored the morbidities of breast cancer survivorship and lymphedema and their relationship to functioning and quality of life. The sequellae may include negative impact on physical function parameters such as impaired arm mobility, pain, strength and function, numbness/paresthesias,11–14 as well as on psycho-social parameters of recreational activity, social relationships, altered body image, work related issues, and emotional distress/depression.15,16
Lymphedema has historically been challenging to diagnose definitively, as there are few valid and reliable measures. The clinical diagnosis is typically based on clinical history and physical examination.5,17 The staging of lymphedema is generally based on four categories: from 0- not clinically evident, to 3- elephantiasis. 5 In clinical trials, outcomes can vary based on criteria used for lymphedema identification. The most commonly found clinically applied criteria for diagnosis has been a finding of 2 cm or more difference in arm circumference, or 200 mL limb volume difference between the affected and unaffected limb. 18 Measurement using water displacement is rarely used due to its inconvenience in the clinical setting, as well as difficulties in reliability of accurate measurements of upper arms and inability to detect subclinical lymphedema. 19 Lymphoscintigraphy is used when more precise delineation of a lymphatic abnormality is needed.5,17 However, downfalls of this technique include limited availability and patient discomfort. Other tools include perometry for volume measurements, 20 bioimpedance spectroscopy for changes in electrical conductance,21,22 tonometry for changes in skin texture and resistance, 23 ultrasound,24,25 computed tomography, 5 and magnetic resonance imaging.26–28
Circumferential measurements have been found to have a strong correlation with water volumetry,29–31 and because of their ease of application are the most frequently used clinical measure. 18 One clinical approach utilizes a specialized measuring tape, Gulic measuring tape, which has a built-in tension device that gauges how tightly the tape is pressed against the skin to prevent excess compression of tissue. Measurements are obtained at standardized 4 cm lengths along the arm. Geometric formulas are used to indirectly calculate volume. Edema volume is then calculated by comparison to the unaffected arm, based on an assumption that the volumes would be symmetrical.
One fundamental issue with external volumetric measures is that the accumulation of extracellular fluid in lymphedema accounts for only a small percentage of total arm volume. 22 Factors such as hand dominance and body composition are often ignored. Tape measure technique and geometric calculations are additional factors confounding this methodology. Attempts have been made clinically to standardize tape measuring tools (i.e., Gulic tape) and methods of measurement (i.e., use of protocols for reproducility) to improve reliability.
Magnetic resonance imaging is a safe, noninvasive technique that provides excellent contrast for visualizing the soft tissue change associated with lymphedema. 32 Distinct patterns of structural change within the subcutaneous tissue are associated with breast cancer-related upper extremity lymphedema. Three specific patterns of structural change associated with breast cancer-related lymphedema have been characterized, including fluid in adipose tissue, fluid accumulation between fibrous septa and fat globules, and fat globule hypertrophy. 28 Previous studies have used 1.5T MRI. 28 In this study, 3.0T MRI has been used, which provides better signal and superior contrast between water and fat. 3.0T MRI is particularly suited for this task because of an increased difference in the resonance frequencies of water and fat. 33
The lack of a standardized assessment tool for breast cancer-related lymphedema inhibits better understanding of the natural progression of disease and limits assessment of treatment effectiveness. MRI may provide an accurate and standardized method of longitudinal assessment. It is the aim of this study to assess the validity of MRI as an assessment tool in the clinical measurement of lymphedema in BCRL.
Materials and Methods
Patients were recruited through a hospital lymphedema clinic, as well as a physical therapy private practice. The study was IRB-approved and HIPAA compliant and all patients gave written informed consent. Eligibility criteria included any patient with clinically detected breast cancer-related lymphedema. Exclusion criteria included patients with contraindications to the MRI scan. Each patient underwent data collection by the lymphedema physical therapist and physician. The MRI was done at the UVM MRI Center for Biomedical Imaging.
Circumferential measurements were made according to a standardized protocol with the patient lying supine with the upper extremities resting along the side. The forearm was pronated prior to measurement. The starting position was established at the distal edge of the ulnar styloid by palpation. Reference measurements from the most proximal point of the nail bed of the fifth digit to the distal edge of the styloid process were recorded. Marks were made on the arm at 4 cm intervals from the ulna to the axilla as per protocol. The superior/proximal edge of the Gulic tape was placed on the marked points, and circumferential measurements were made. The process was repeated for the unaffected arm. The same senior therapist did each measurement using the same Gulic tape and the standard protocol.
Upper extremity volumes were calculated from clinical circumferential measurements. Assuming an approximately circular cross-section, and calculating the volume as a sum of cylindrical sections, the total volume can be calculated based on the circumference measures as:
where ci represents the circumference measure at each location and t is the distance between measurements.
MRI scans were performed on a Philips 16 Channel 3T Achieva X-series MRI scanner. It utilizes Dual Quasar gradients that perform at /80 mT/m (40×2)/m peak, 200 mT/m/ms slew rate. An 8 channel SENSE Knee coil was used for image acquisition.
WATSc (Water Selective Cartilage Specific) is a T1-weighted MRI acquisition protocol that gives a strong signal from proteinaceous edema while suppressing fat signal. The Axial WATSc scan was acquired using a 130 mm Field of View (FOV), 0.5×0.5 mm2 pixel resolution, 3.5 mm slice thickness, TR 19 ms, TE 4 ms, and signal averages 2. Scan duration was 5 min and 21 sec.
The STIR (Short Tau Inversion Recovery) sequence is designed to suppress signal from fat, while giving a strong signal for edema or fluid. It was used to determine if there was edema present within the muscle, since edema and muscle have similar signal characteristics on the T1 WATSc images. Axial Turbo Spin Echo (TSE) STIR parameters were: 120 mm FOV, 0.5×0.7 mm2 pixel resolution, slice thickness 4 mm, scan duration 4 min 50 sec, TR 8549 ms, TE 30 ms, 2 signal averages.
Semi-automatic segmentation of the MRI data was performed using in-house developed Matlab (Mathworks, Inc) software. The inner and outer edges of the soft tissue volume were first defined using a two-dimensional cubic spline interpolation. The contour for a single slice was defined using between 10 and 20 manually placed control points on each slice. After initially defining the contour on a small number of slices, the remaining slice contours were generated automatically by linear interpolation of the control point locations (x,y) by slice (z). The interpolated images were then checked and the control points adjusted as required. This process was repeated until the contours were acceptable on every slice. This took typically less than 10 min per volume.
Contours defining the inner and outer surfaces were then used to generate three-dimensional masks of the total limb and soft tissue volumes. The soft tissue volume was then segmented into edema and muscle/fat. Since the MRI signal intensity scale is arbitrary (depending on many factors including receiver coil positioning, and scanner settings), a radiologist determined a signal threshold that best delineated edema from muscle and fat. On the WATs scan, the lymphedema fluid is much brighter than the surrounding tissue, such that more sophisticated segmentation algorithms (such as fuzzy c-means and k-means clustering) were found to be unnecessary.
The limb, soft tissue, and edema volumes were calculated as the product of the number of voxels in the corresponding mask and the voxel volume. In addition, for direct comparison to external measures, the outer circumference was calculated based on the length of the spline curve on each slice.
Results
MR imaging detected lymphedema in all study subjects. Distinct patterns of change were identified within the subcutaneous tissues of the affected limbs. A uniform pattern of abnormal increased signal on the T2 weighted STIR sequence was identified in the subcutaneous fat of a subset of patients (Fig. 1). This pattern was more frequently observed in patients with recent onset of disease.
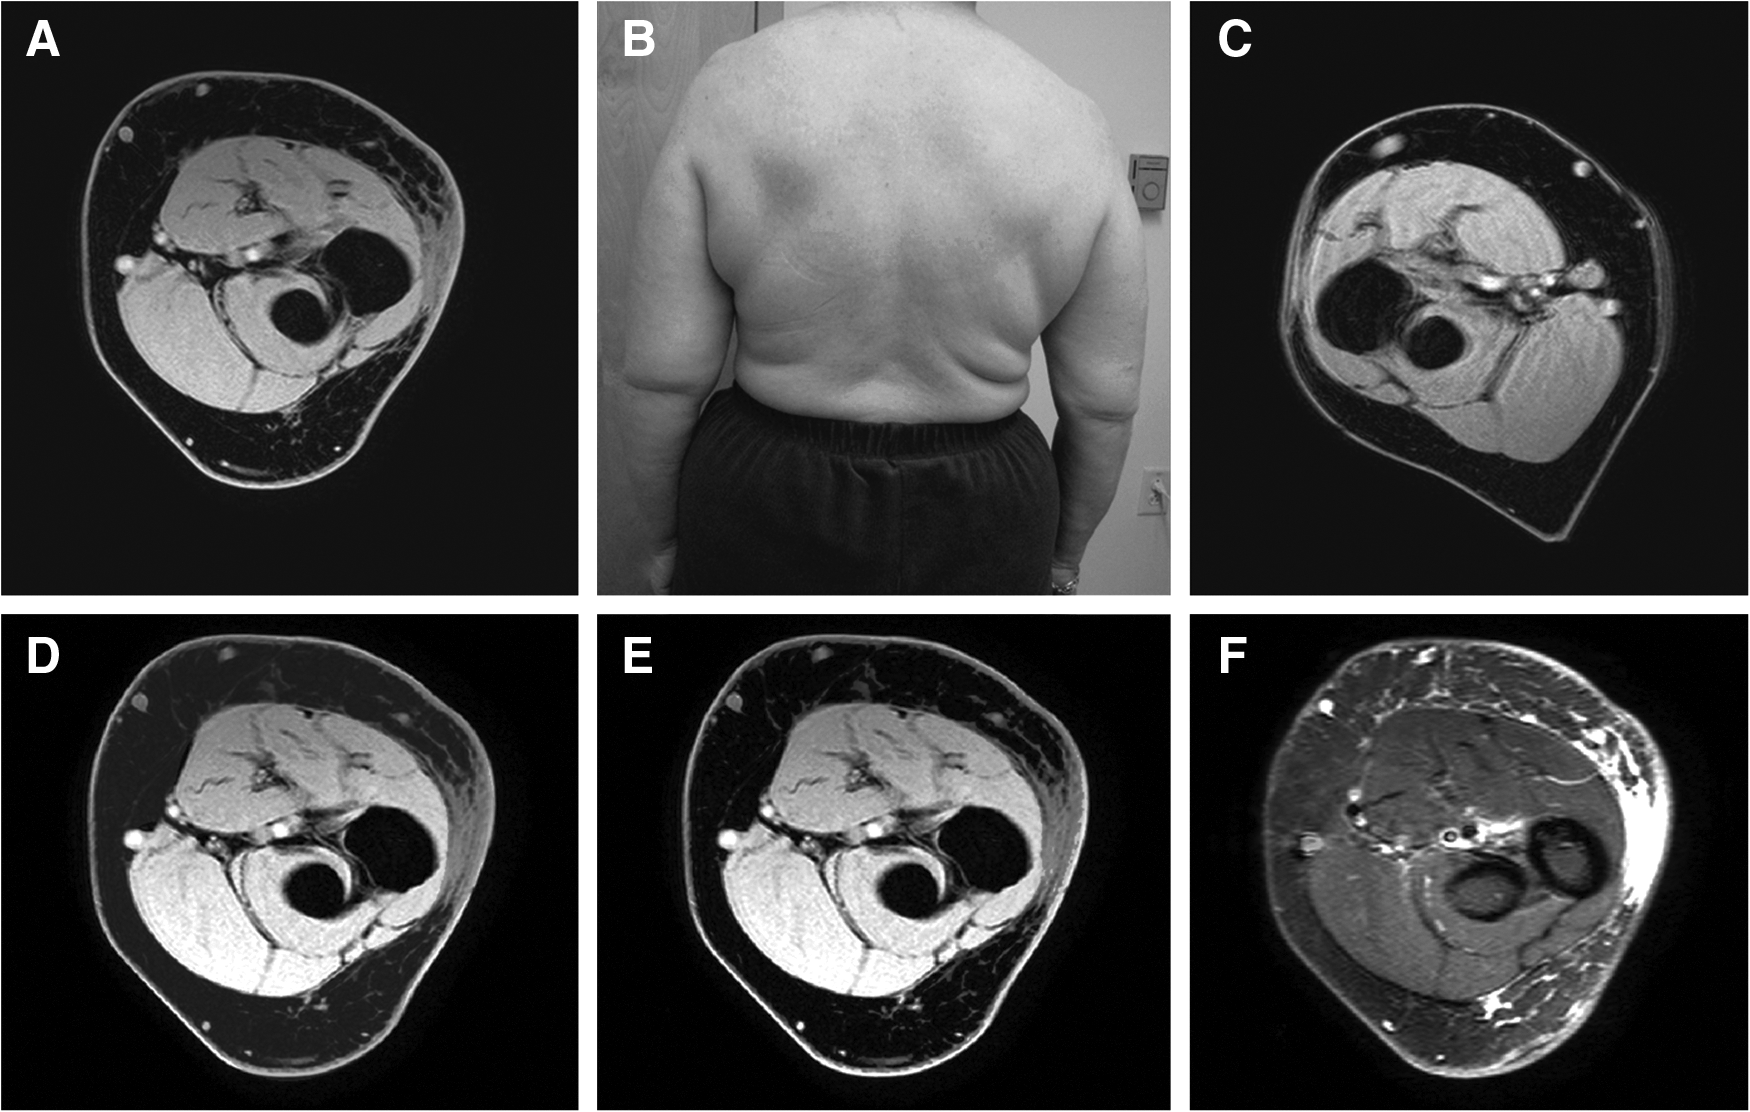
Patient #7 is a 59-year-old woman with left-sided upper extremity lymphedema
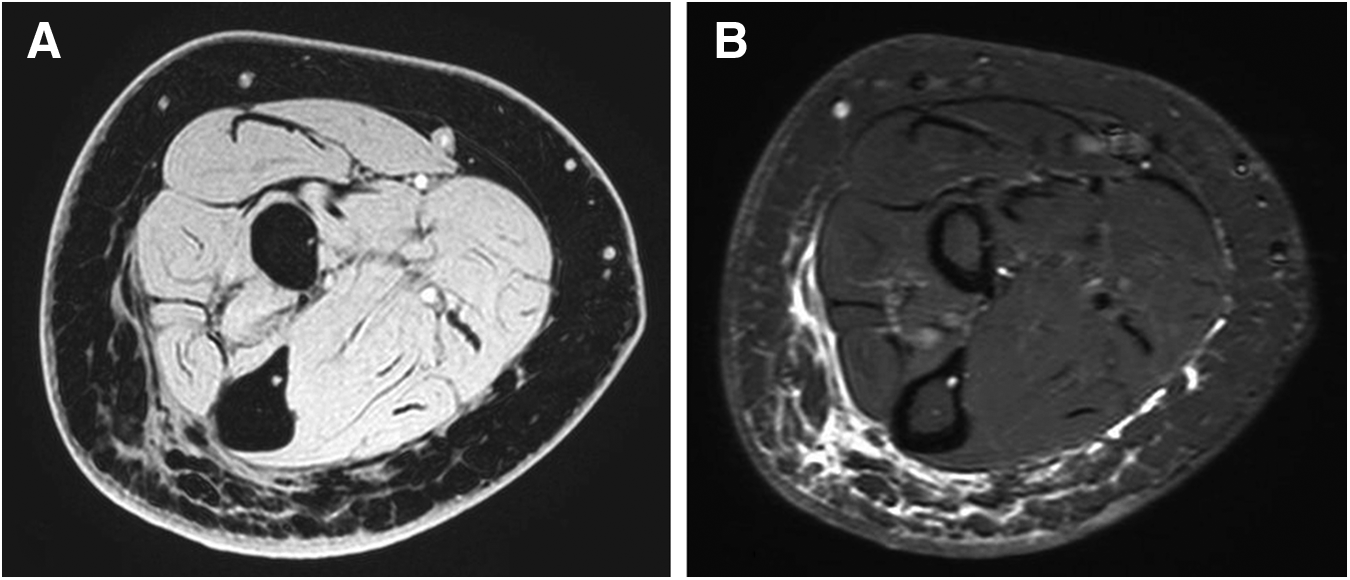
A second “honeycomb” pattern of abnormal signal distribution was identified within the subcutaneous tissues of the affected limbs. This trabecular pattern of bright signal distribution represents proteinaceous fluid interspersed between low signal fat lobules (Figs. 2 and 3). Commonly associated with this pattern were hyper-intense signals along the muscle fascia representing epifascial fluid accumulation.
Patient #3 is a 63-year-old woman, more than 10 years from breast cancer therapy.
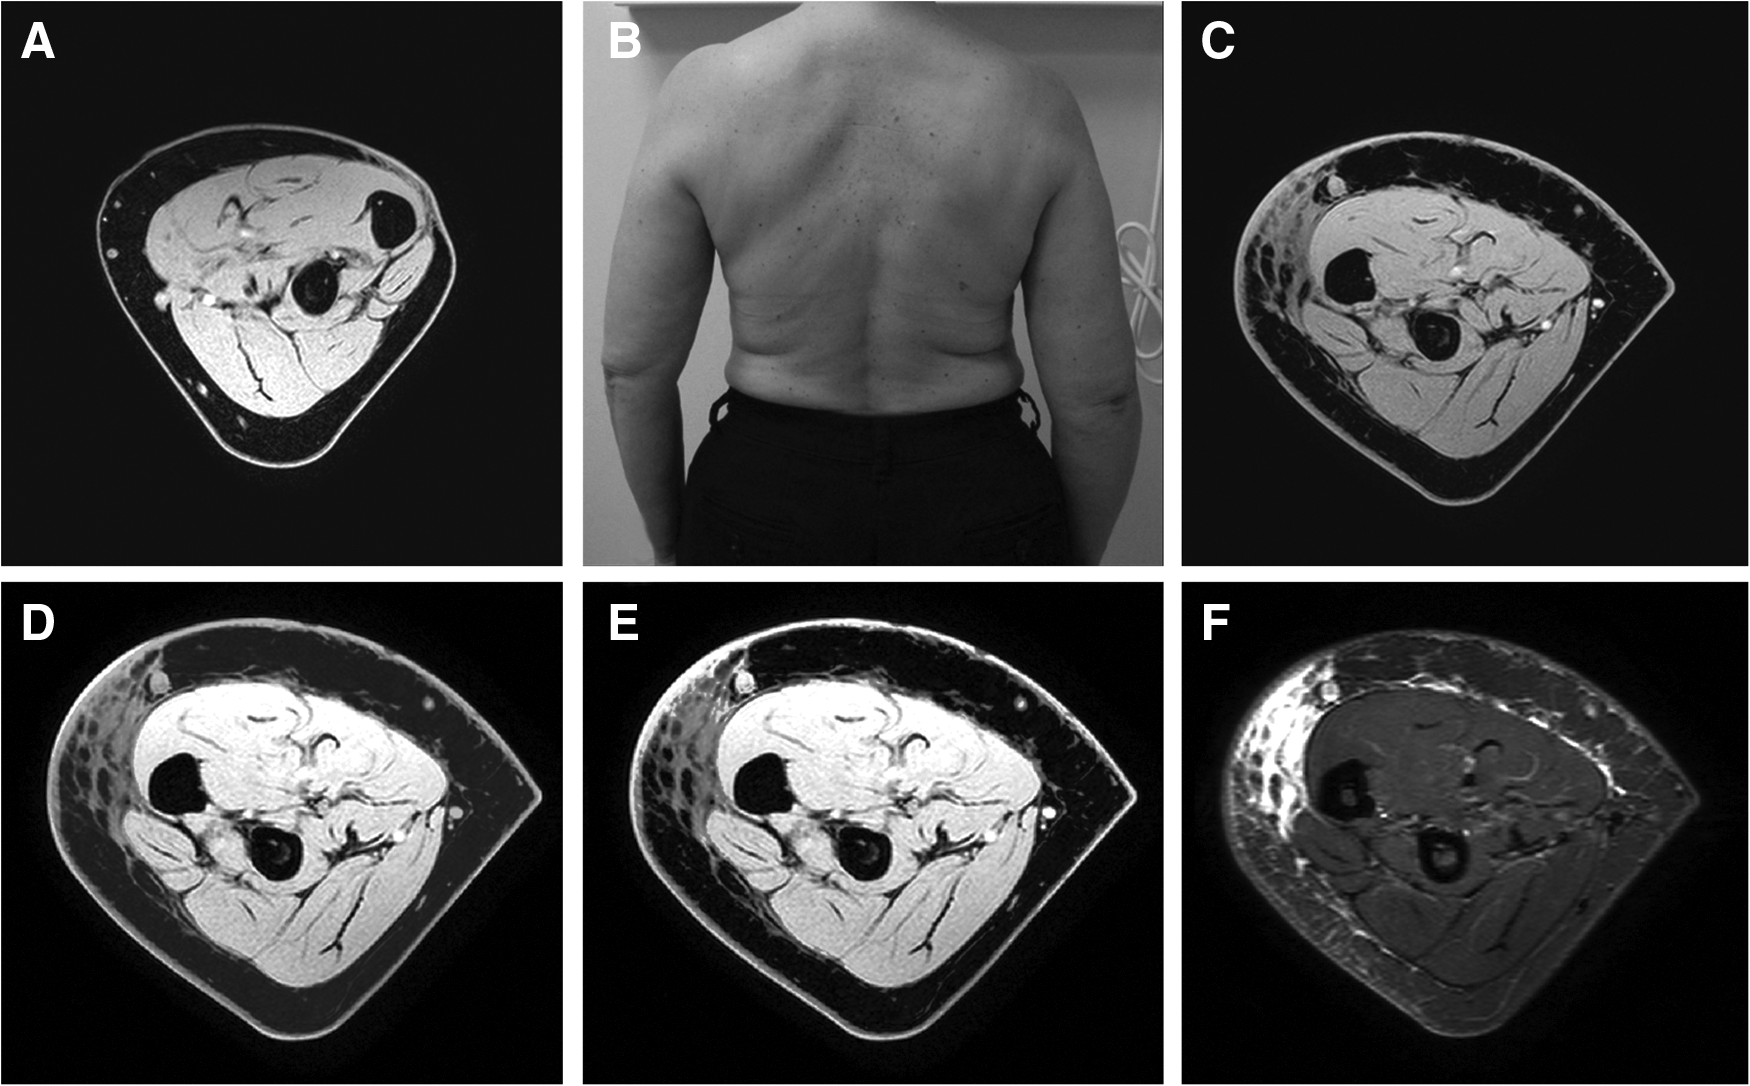
Patient #4 is a 64-year-old woman with right-sided upper extremity lymphedema
A third pattern of signal distribution and structural change was characterized by abnormal uniform hypo-intense signal distribution present in the context of thickened subcutaneous tissue. The relative lack of hyper-intense T2 weighted STIR and WATs signal abnormality in these regions represents lack of proteinaceous fluid. Fat hypertrophy is shown to contribute greatly to the increased upper extremity volume. This pattern was more commonly observed in patients with long-standing lymphedema.
Images were selected from patients' with recent-onset and long-term breast cancer-related lymphedema. The example shown in Figure 2 is a 59-year-old female with 12 months of elapsed time from breast cancer therapy. The MR imaging demonstrates a uniform pattern of increased signal distribution within the dependent subcutaneous tissues of the affected limb representing fluid within adipose tissues. Comparison to the unaffected limb demonstrated persevered symmetry of the subcutaneous adipose tissue thickness. Clinical measurements detected a 2.9% (20 mL) difference in limb volume that was attributed to lymphedema volume. MR imaging techniques measured 144 mL of lymphedema volume in the dermal and subcutaneous layers.
Figure 3 represents selected images from a patient with long-standing breast cancer-related lymphedema. Axial images demonstrate a region of abnormal “honeycomb” signal distribution within the subcutaneous layer representing fluid signal interspersed between low signal fat lobules. There is thickening of the subcutaneous layer with regions that lack signal contribution from proteinaceous fluid. Regions of subcutaneous thickening with homogeneous hypo-intense signal are representative of fatty hypertrophy. Clinical measurements detected a 23% (179 mL) difference in limb volume that was attributed to lymphedema volume. MR imaging techniques measured 178 mL of lymphedema volume in the selected subcutaneous tissues.
Dermal changes were identified in all patients. Asymmetric dermal thickening with accompanying hyper-intense T2 signal is representative of proteinaceous fluid interspersed within the dermal interstitium.
Correlation was found between external circumferential measurements obtained mechanically and with those measured on the 3.0T MRI (Fig. 4, r=0.9368). Circumferential measurements obtained from MR images were greater than those based on external measures, with linear regression showing that the average measurement using MRI was 9% greater.
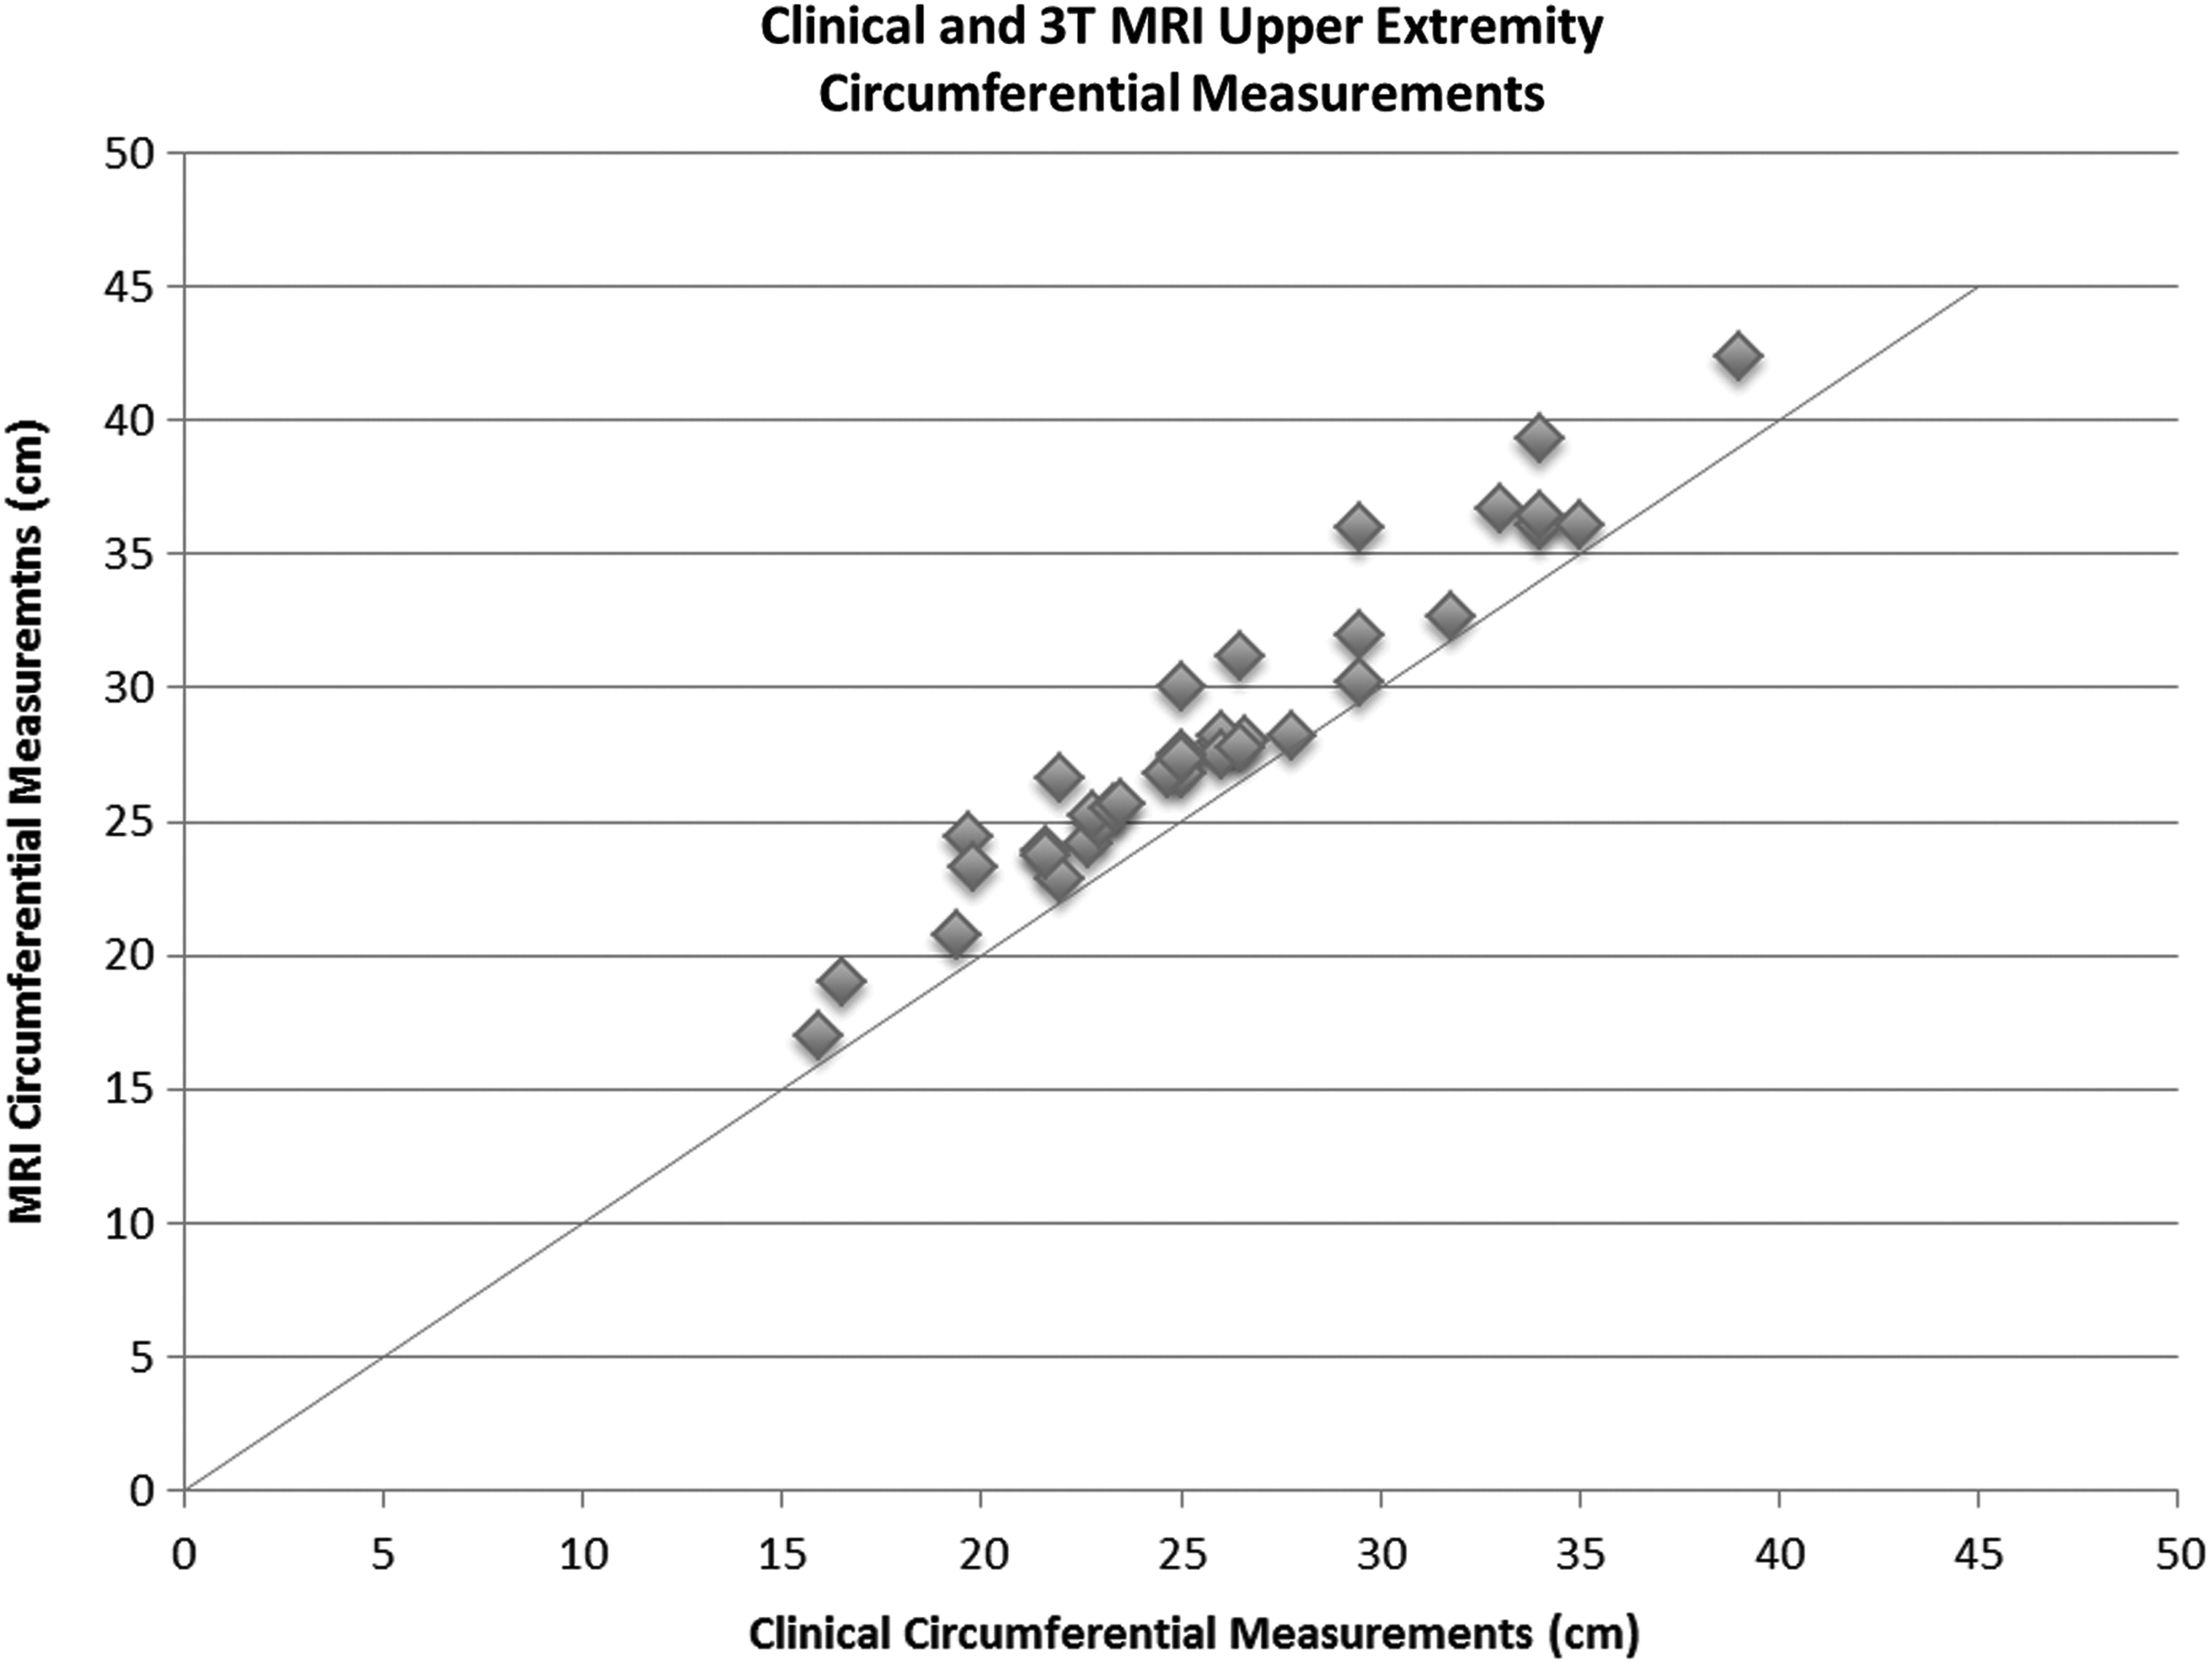
Circumference and limb volume measures derived from external and MRI data. The correlation coefficient is high (r=0.9368).
Upper extremity volumes were calculated from circumferential measurements. The total volume measurements across each of the 8 subjects showed a 20% higher value estimated using MRI. This is consistent with the observation that the volume depends on the square of the circumference measure, such that the percentage difference would be expected to double. Clinically measured total upper extremity volumes ranged from 512 cm3 to 1126 cm3. MR imaging upper extremity volumes ranged from 609 cm3 to 1392 cm3.
Lymphedema volumes were obtained by MR image technique and calculations from external circumferential measurements. Corresponding regions of interest ranging in length from 12–20 cm were evaluated with both techniques.
There was poor correlation between lymphedema volumes calculated from clinical measurements and MR imaging (r=0.5539; Fig. 5). Lymphedema volumes calculated from clinical circumferential measurements ranged from 20 mL to 512 mL. These volumes represent a 3%–45% volume differences between the affected and unaffected limbs. Lymphedema volumes calculated by MR imaging techniques ranged from 120 mL to 211 mL.
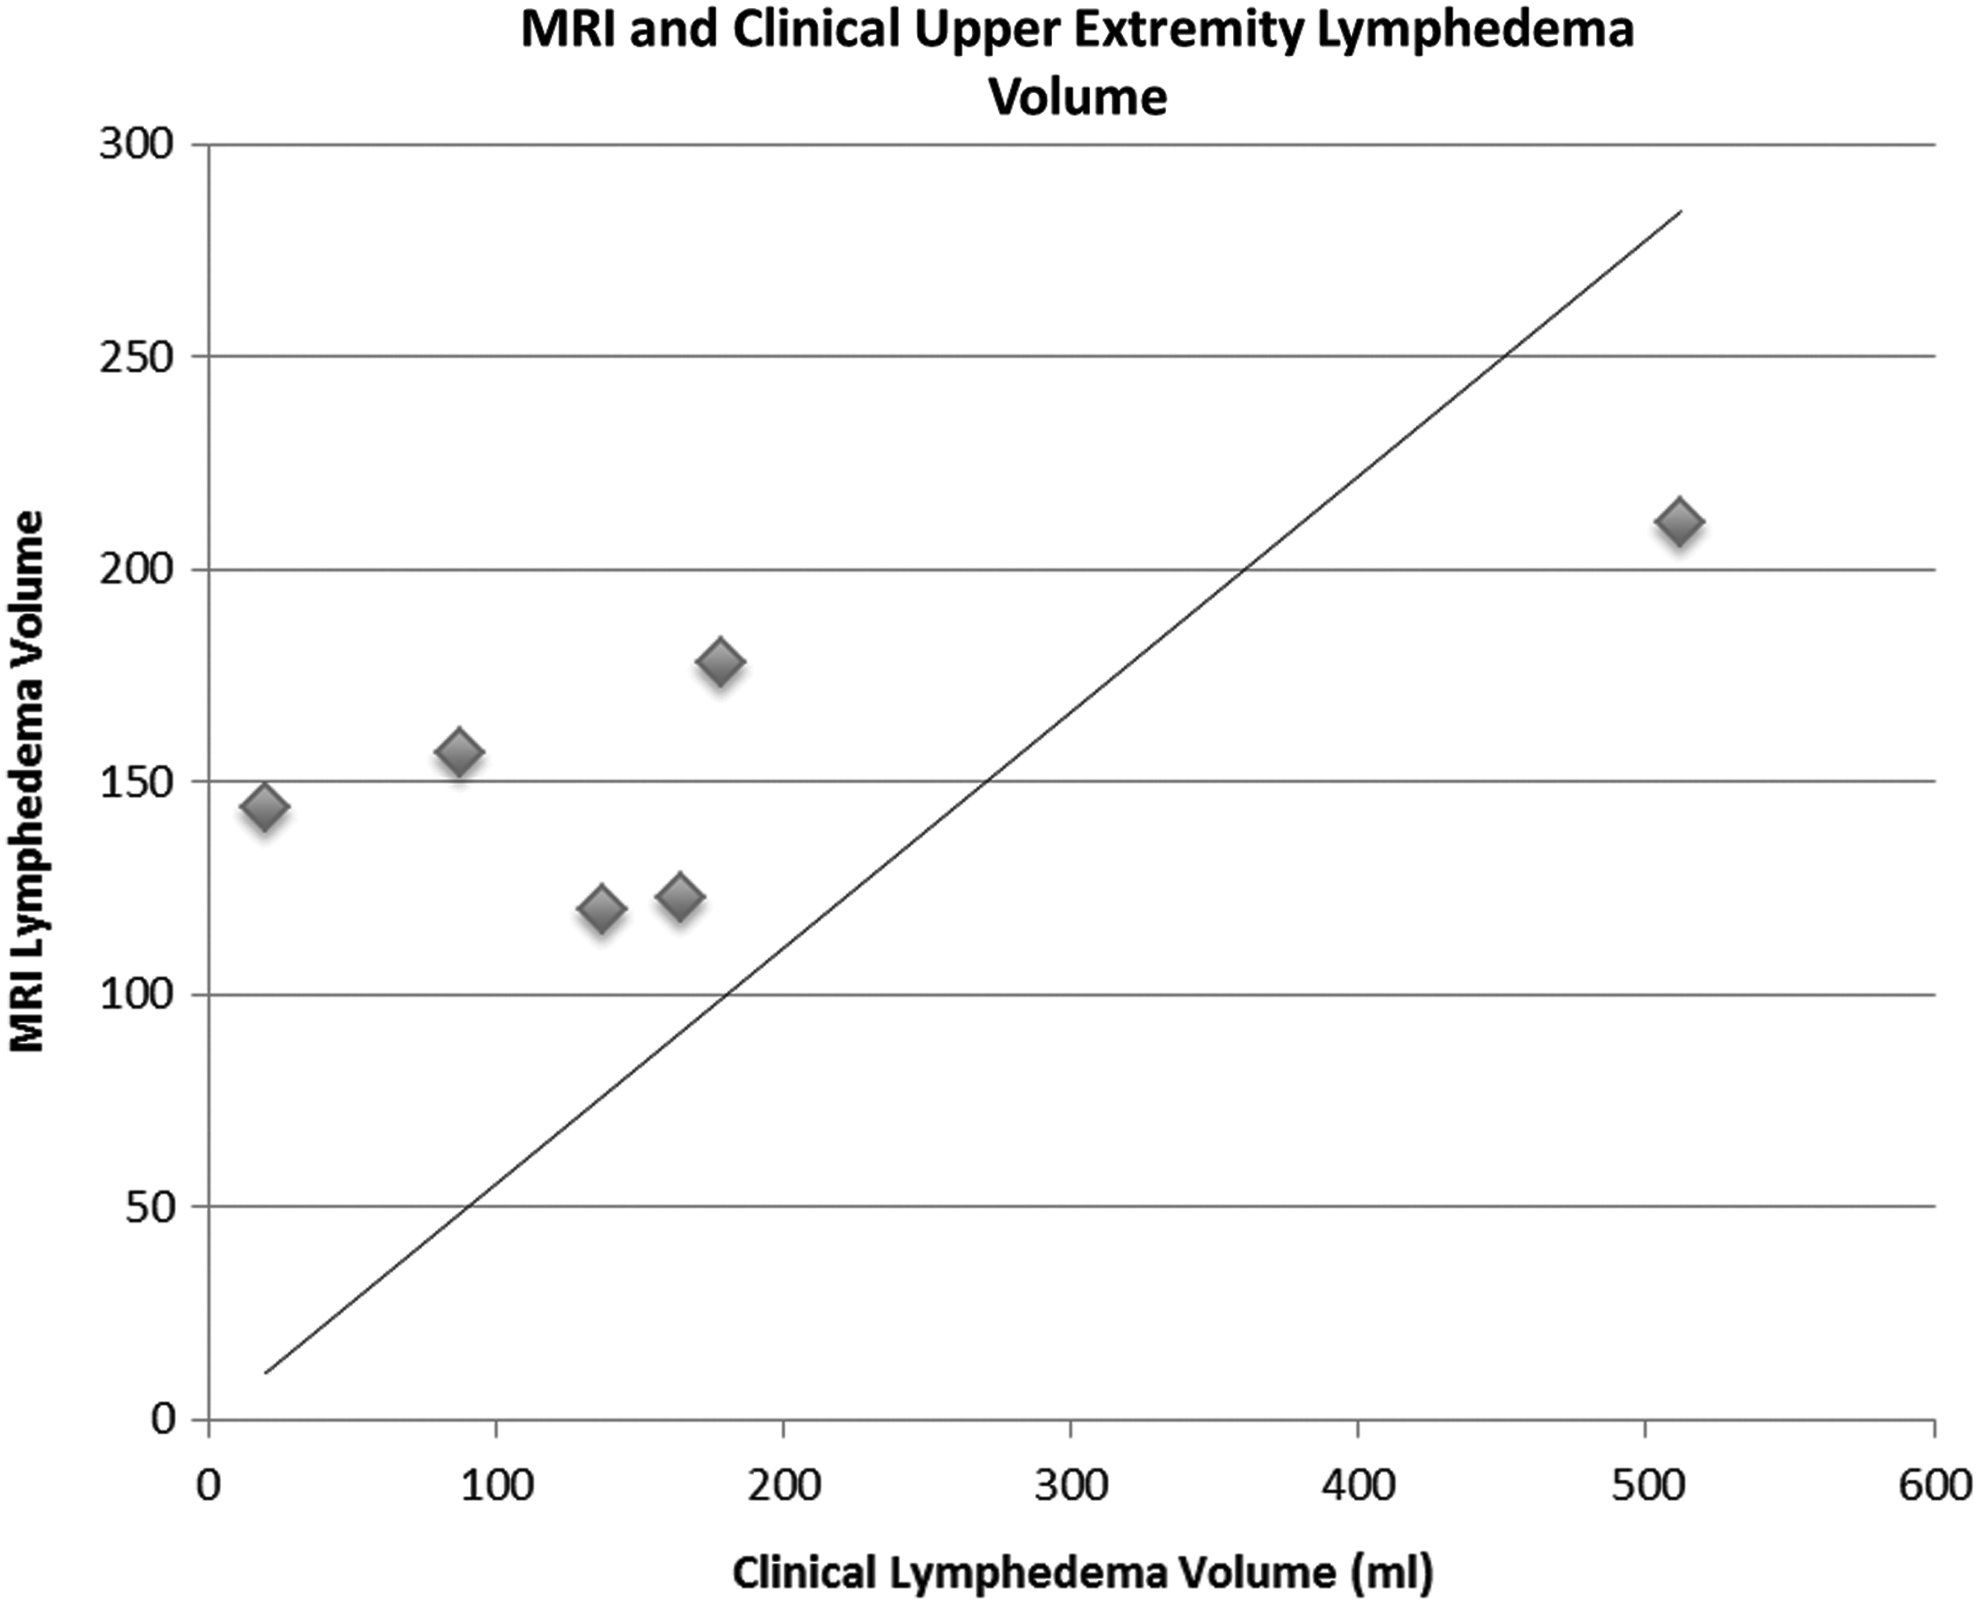
Edema correlation between external and MRI measures. Poor correlation coefficient (r=0.5539).
Conclusions
A reliable means of quantitative measure is needed for the assessment of breast cancer-related lymphedema. The most commonly used method, clinical circumferential measurements, does not account for the soft tissue composition. Circumferential measurements have proven to provide reliable assessment of upper extremity volumes when compared to light and water displacement controls.29–31 There is little insight into the significance of accurate circumferential measurements in the detection and longitudinal assessment of breast cancer-related upper extremity lymphedema. This method needs to be combined with other tools in order to capture tissue changes that underlie those measurements.
Assumptions inherent to external measure techniques may affect accuracy. The effect of handedness and fluctuations in BMI should be taken into account when comparing arms. It was found that the volume of the dominant arm was greater than the non-dominant arm by 2.5% or approximately 50 mL in the normal-sized adult. 34 Other researchers have shown that 30% of patients had an asymmetry in arm volume preoperatively exceeding 100 mL or 5%. 35
In this study, upper extremity circumferential measurements and volumes obtained with MR images have proven to correlate statistically with clinical measurements. Circumferential measurements obtained from MR imaging were slightly larger on average when compared to clinical measurements obtained at corresponding level. A possible explanation for this discrepancy is compression at the time of clinical measurement related to the Gulic measuring tape.
MR imaging provides the ability to assess the volumetric contribution from designated soft tissues by manual selection or signal windowing. Despite correlation in measured circumference and volumes between two techniques, there was poor correlation between calculated lymphedema volumes. Clinical measurements do not account for the tissue change related to long-standing disease. Lymphedema volumes obtained from clinical measurements varied greatly between patients (20 mL—512 mL) over the designated region of interest. MRI-defined lymphedema volumes were more consistent between subjects (144 mL—211 mL). MRI was able to differentiate the soft tissue components that contribute to this volume and more selectively assess fluid volume. A significant portion of the measured clinical circumference was found to relate to chronic soft tissue change related to long-standing lymphedema.
It has previously been demonstrated that the increased thickness of the dermal layer and the increased volume of the subcutaneous tissues represent the most important contribution of the total swelling of the arm. 28 Abnormal fluid accumulation in the dermal layer was detected in all patients with clinically apparent lymphedema. In the cases of recent onset lymphedema, bright T2 weighted signal was easily identified in all test subjects, even subjects with what was assessed to be low-grade lymphedema.
A limitation of this study is that partial-volume effects (a single voxel containing more than one tissue type) of edema with adjacent soft tissue leads to intermediate signal intensities. However, a suitable choice of signal threshold can partly account for this problem by assigning only voxels containing more than a certain fraction of edema to be labeled as edema. Blood vessels also appear bright on the WATs scan, and were misclassified as edema, although the volume was small compared to the edema volume in all cases. Our relatively small sample size of 8 patients may also be a limitation of the study.
Standardization of measurement methods would allow a clearer understanding of incidence, prevalence, and relative risk in subgroups of patients and more meaningful comparisons of the efficacy of preventive and therapeutic measures. 36 Table 1 shows the therapeutic cancer treatments the patients in this study received. MRI can provide circumferential and volume measures in post therapy breast cancer patients that correlate with clinical measurements. MRI provides the advantage of distinguishing the tissue characteristics that encompass this change providing a reproducible means by which to obtain a quantitative assessment of edema volumes and tissue characteristics.
AD, axillary node dissection; BC, chemotherapy; RT, radiation therapy; PM, partial mastectomy; TM, total mastectomy.
The enlargement of a limb does not necessarily reflect fluid accumulation in the soft tissues. Volumetric measures used to quantify the presence and severity of lymphedema and follow the response to treatment are misleading. In advanced stages of lymphedema, the presence of fibrosis and fat tissue becomes more important. It has been shown that the gain in volume is partly due to the growth of adipose tissue. 32 Therefore, conservative decongestive physical therapy (CPT) is not likely appropriate for this subgroup as CPT will not reduce hypertrophied adipose tissue. In patients where diffuse or honeycomb lymphedema patterns predominate on MRI, appropriate CPT can still ameliorate the volume of the edema. 32
MR has the potential to recognize early evidence of fluid accumulation that may be overlooked by current standards of clinical assessment. Early diagnosis and nonpharmacologic interventions should be implemented as soon as possible after surgery when they are more likely to be effective. 36 Studies have shown that early physiotherapy is associated with a significantly lower risk of developing secondary lymphedema in the first year after breast cancer surgery.37,38
An unfortunate consequence of volume/circumference-based lymphedema grading systems is the inability to use these systems in the assessment of non-limb lymphedema. Breast lymphedema is of increased frequency with lumpectomy and radiation treatment used in breast conserving therapy. It would also be useful for axial lymphedema, since bladder, prostate, ovarian, cervical endometrial, and colon cancers lack a standardized means of assessment. 39 Clearly this limitation does not apply to MRI-based assessment tools that may be employed at any anatomic location.
Longitudinal studies utilizing MRI may be useful in the assessment of therapeutic interventions. MRI may provide a more accurate assessment of therapeutic interventions as it provides a means to differentiate the components contributing to the measured volumes.
Footnotes
Acknowledgments
The authors are grateful to the Department of Energy for funding of the University of Vermont MRI Center for Biomedical Imaging through grant SC 0001753. The authors would like to acknowledge Christopher G. Filippi, MD, Trevor Andrews, PhD, Jay Gonyea, and Scott Hipko for their contributions to the study conception and data acquisition.
The study was approved by Committee on Human Research in Medical Sciences; University of Vermont.
Author Disclosure Statement
No competing financial interests exist.