
Abstract
Abstract
Background:
Long-term observations confirm lasting effects and lack of complications of intermittent pneumatic compression (IPC) therapy. So far, no test has been designed that would provide data necessary for setting pressure and time parameters of the IPC device to obtain optimum decrease in limb volume.
Aim:
To design a test providing data on decrease of circumference under the inflated chamber in time depending on the applied compression pressure.
Methods:
One chamber was placed above the ankle joint and inflated to 120 mmHg in order to occlude tissue fluid backflow during inflation of the proximally located test chamber. The latter was inflated sequentially to 50, 80, 100, and 120 mmHg, for 1–3 minutes each. Calf circumference changes were recorded continuously using the plethysmographic strain gauges placed under and proximally to the inflated chamber.
Results:
Four different types of the recorded circumference change curves were observed during inflation of the test chamber. The first was decrease under and increase proximally to the inflated chamber, another showed decrease under the inflated chamber and little change proximally, the third small decrease under the chamber but increase proximally, and the fourth no change under and proximally. Depending on the steepness of the obtained curves, pressures and timing of IPC device were increased to values bringing about edema fluid mobilization.
Conclusions:
The two-chamber inflation-deflation test provides plethysmographic data on the circumference changes during calf IPC, time necessary to obtain optimum decrease of circumference, and an insight into tissue elasticity. These data are useful for setting the compression devices at levels bringing about a decrease in limb swelling as well as may be of prognostic value with respect to the efficacy of long-term use of IPC.
Introduction
A
To solve this problem, we worked out a simple method for providing data to program the IPC device before its administration. In this test the change of calf circumference is recorded continuously under the chamber inflated to various pressure levels and in the proximal tissue fragment. Three parameter recordings are analyzed: 1. decrease of circumference under the inflated chamber and increase in the proximal calf fragment, followed by 2. return of circumferences during deflation to the pre-inflation values minus difference brought about by the squeezed out fluid, and 3. time to obtain decrease in circumference under the inflated chamber by the evacuated fluid. Based on these recordings, the compression pump timing and inflation pressures are set. This test is performed on the calf, as this part of the limb is most affected by edema due to gravity and predisposition to tissue changes.
Material and Methods
Patients
The study was carried out on 20 patients, aged 28–62 years, mean weight 68 kg (58–76), mean height of 168 cm (159–178), BMI range 1.8–2.5, with diagnosis of lymphedema of one lower limb, stages II to IV, duration of 2 to 15 years. Cases with acute inflammation, chronic venous insufficiency, lipedema, and systemic etiology of edema were excluded from the study. The contralateral healthy limbs served as controls for the hydromechanic measurements. The study was approved by the Warsaw Medical University Ethics Committee. Informed consent of patients was obtained. The procedures followed were in accordance with the ethical standards of the responsible committee on human experimentation and with the Helsinki Declaration of 1975, as revised in 2008.
Clinical staging
Staging was based on clinical evaluation: level of edema embracing limb from foot to groin, and degree of skin keratosis and fibrosis. Briefly, in stage I, pitting edema was limited to the foot; in stage II, pitting edema affected the foot and lower half of the calf; in stage III, foot and calf were involved, with hard foot and ankle area skin; in stage IV, the whole limb was edematous with foot, and calf skin hyperkeratosis and papillomatosis of toes. 3
Scheme of the test
The test setting is shown in Figure 1. Two pneumatic chambers were placed around the calf. The length of each chamber was 9 cm, corresponding to that of chambers in compression sleeve routinely used for IPC (Biocompression Systems, Moonachie, NJ, USA). One chamber was placed above the ankle joint and inflated to 120 mmHg in order to occlude tissue fluid backflow during inflation of the proximally located test chamber. The latter was inflated sequentially to 50, 80, 100, and 120 mmHg, for 1–3 minutes each, timing depending on tissue elasticity with longer times in cases with hard skin. Calf circumference changes were recorded continuously using the plethysmographic strain gauges placed under and proximally to the inflated chamber.

Two inflation cuffs were placed around the calf. The inflated chamber at ankle level
Continuous circumference measurement
A plethysmograph (type EC6, Hokanson, Bellevue, WA) in a recording vein mode was applied. Two mercury strain gauges of a length of 32–53 cm (depending on calf circumference) were put around the limb, one under the test mid-calf chamber, the other 4.5 cm proximally (Fig. 1). Shortening and elongation of the gauge were read off on the recorder graph scalę in mm. They reflected the change in limb circumference when inflation of chamber squeezed out and propelled mobile tissue fluid in the proximal direction. The obtained numerical data could be used for calculation of vołume by multiplying the cross area of the studied limb segment by 90 mm (length of the compressing chamber). Subtracting the volume value obtained before compression from that during compression would provide data on the proximally transferred fluid volume.
Evaluation of recording curves
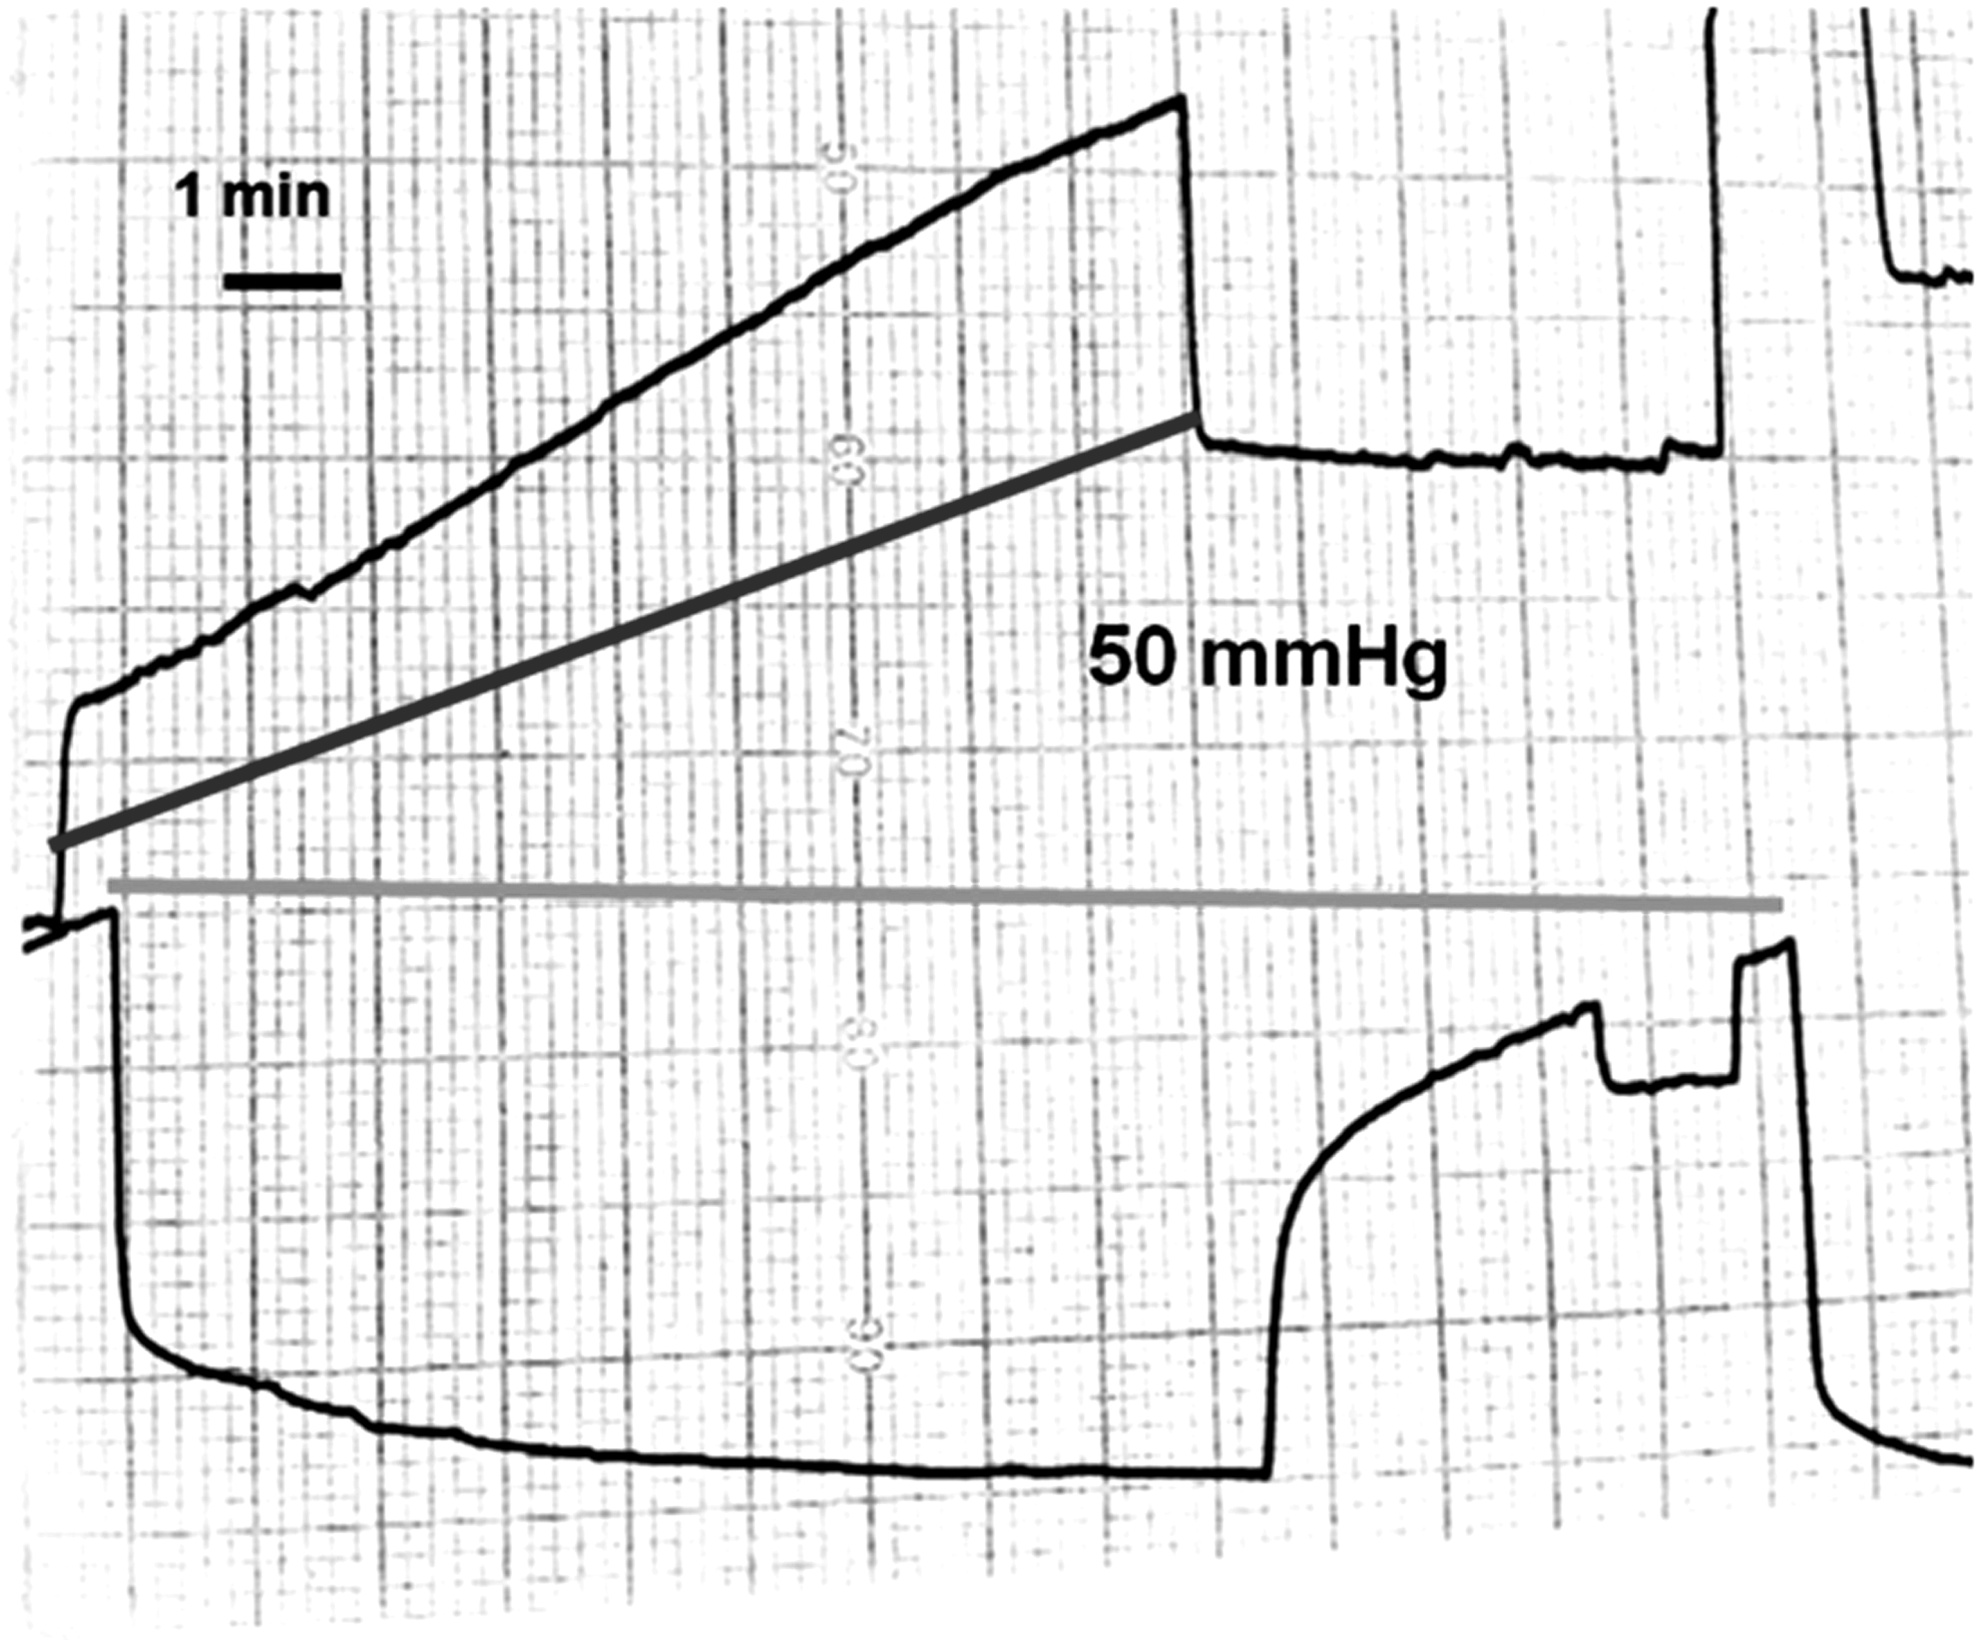
The scheme of typical recording is presented in Figure 2. Chamber inflation brought about decrease in circumference under the chamber and simultaneously increase in the proximal noncompressed calf region. Deflation was followed by increase in circumference under the chamber to a level dependent on the tissue recoil but lower than before inflation due to squeezing out of a volume of fluid. The circumference of calf proximal to the deflated chamber decreased due to recoil of tissues, but to a level higher than before inflation because of inflow of fluid squeezed out from the distal tissues.
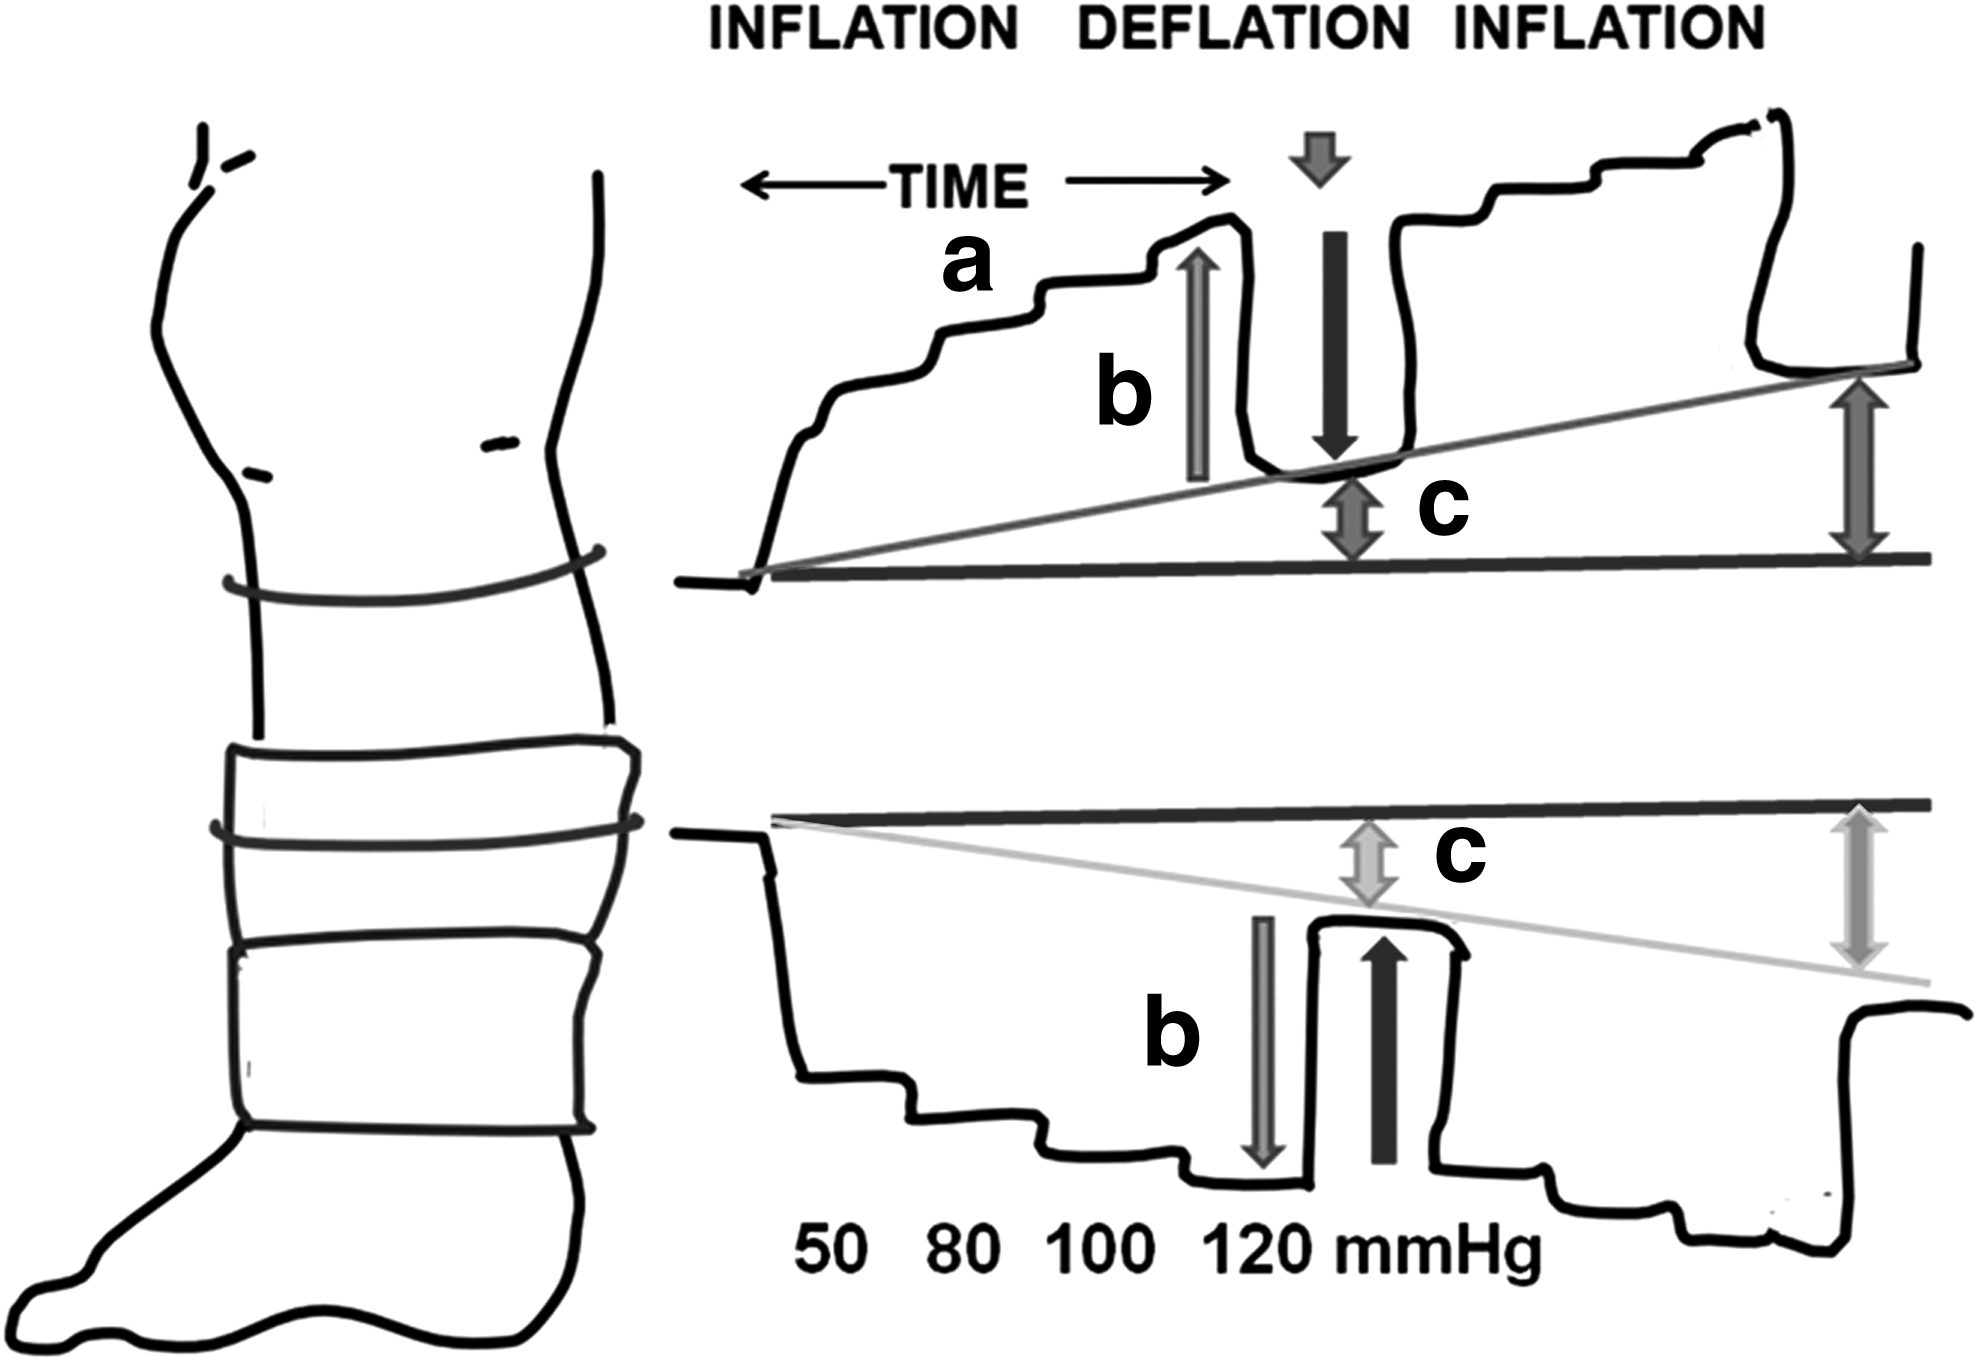
The scheme for analysis of the recorded circumference changes. The chamber located above the ankle was inflated to 120 mmHg to prevent tissue (edema) fluid backflow, and venous inflow. Inflation of the mid-calf (test) chamber brought about decrease in circumference under the chamber (lower curve and flat line, downward arrow) and increase in the proximal below-knee noncompressed region (upper curve with flat line, upward arrow). Deflation of the test chamber was followed by increase in circumference under this chamber by recoil of tissue but to a level lower than before inflation due to proximal evacuation of a volume of fluid (difference shown by a two-head arrow). Concurrently, the circumference of the below-knee region decreased due to recoil of tissue moved proximally during inflation but to a level higher than before inflation, because of inflow of fluid from under the mid-calf inflated chamber (difference shown by a two-head arrow). The test chamber was inflated consecutively to 50, 80, 100, and 120 mmHg. The effect of increasing inflation pressures was evident (rising curve).
Statistics
The double tail Student t-test was applied. Data were means±s.d. Statistical significance at the level p<0.05.
Results
Results of three parameters are presented and analyzed: 1) circumference under and proximally to the a). inflated and b). deflated chamber, the difference providing data on how much fluid was moved; 2) time of inflation to obtain highest difference of circumference; and 3) values of circumference change due to tissue elasticity.
Change in mid-calf circumference under and proximal to the inflated chamber
The results showed decrease of circumference under the inflated chamber and increase above it in the proximal tissues. These changes were composed of two components, one generated by tissue compression and displacement, and the other brought about by fluid movement. Whereas the first was seen within the first minute of inflation, the second was most evident after 3 minutes (Fig. 3).
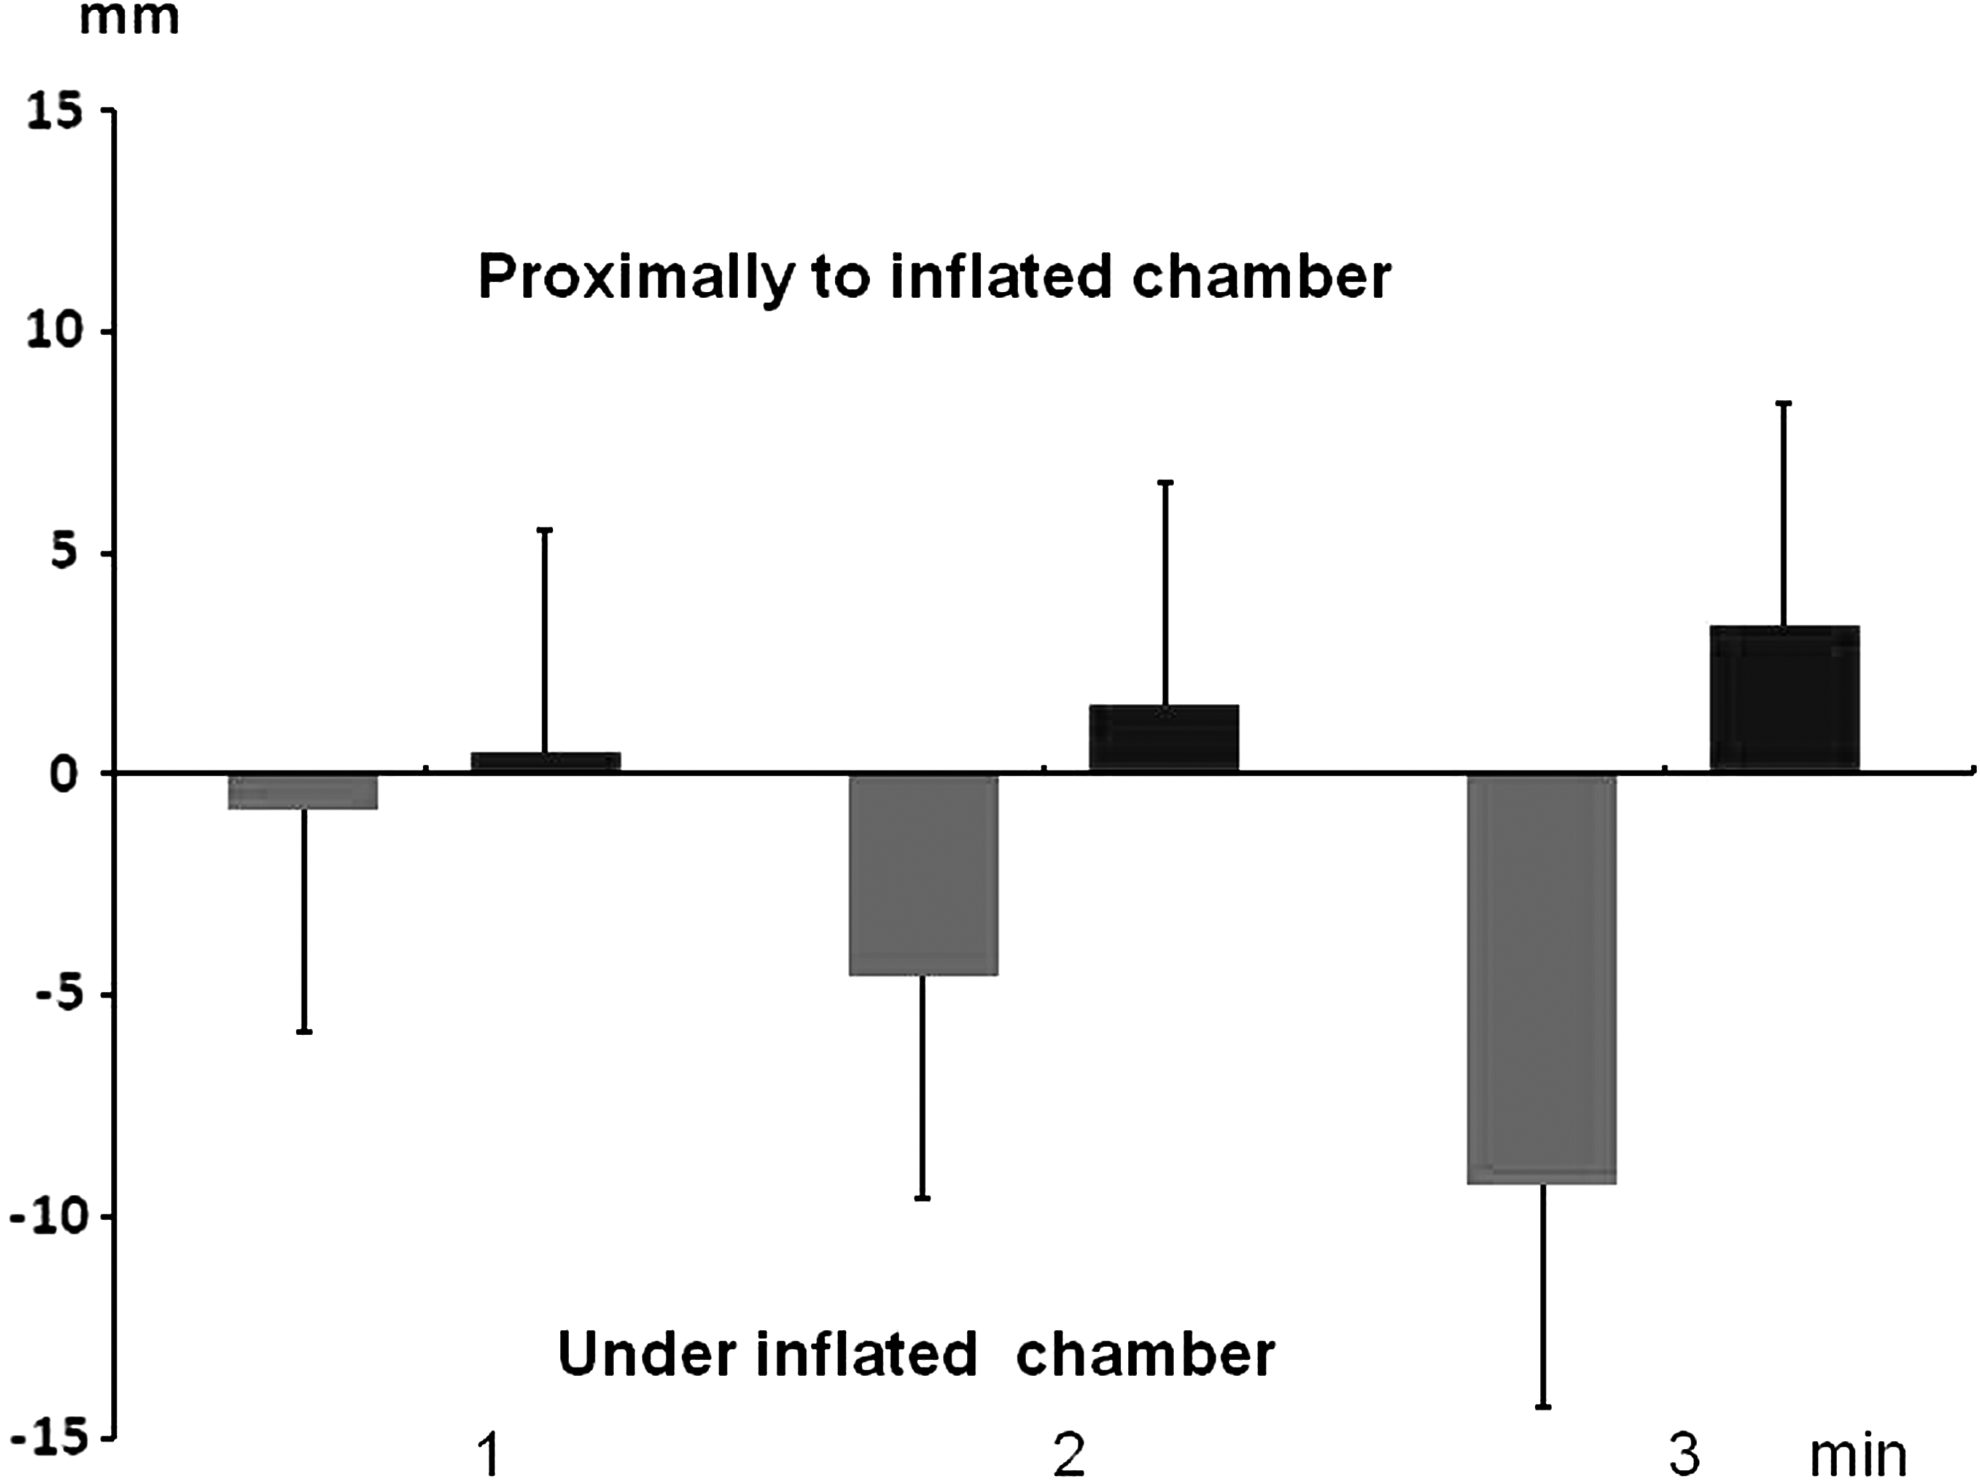
Net changes in calf circumference under the inflated chamber and proximal to it brought about by the moved fluid after 1, 2, and 3 minutes. Inflation pressure 50 mmHg. n=20. Mean±s.d.
Inflation brought about tissue compression and its partial proximal displacement, whereas deflation caused tissue decompression (recoil mechanism) and return to a normal position. The obtained values reflected tissue elasticity (Fig. 4). Increasing chamber inflation pressures resulted in more tissue compression. This indicated that even at compression pressure of 120 mmHg, tissues were still compressible and fluid could be squeezed out.

Changes in calf circumference under the inflated chamber (U) and proximally due to tissue compression (value of circumference due to moved fluid volume subtracted) at inflation pressure of 50, 80, 100, and 120 mmHg for 3 min; n=20. Mean±s.d.
Variations in mid-calf edema fluid and tissue elasticity in patients
Lymphedema is characterized by accumulation of edema fluid in the interstitial space and fibrosis of skin and subcutaneous tissue with fat deposits. These two changes are more expressed in advanced stages of the disease with more fibrous than fat tissue (Fig. 5). Moreover, there is no direct relationship between edema fluid volume and tissue fibrosis. This was the reason why we observed four different types of recorded curves during inflation of the test chambers. They have been presented on Figures 6–13. The first was decrease under and increase above the inflated chamber (Fig. 6), another showed decrease under the inflated chamber and little change proximally, the third small decrease under the chamber but increase proximally and the fourth no change under and proximally. There was no change in circumference under and proximally to the chamber in the healthy calf.

Calf skin, subcutaneous tissue and fascia specimens taken during debulking surgery in various stages of lymphedema illustrating distribution of fibrous elements responsible for stiffness and recoil of the compressed calf tissues.
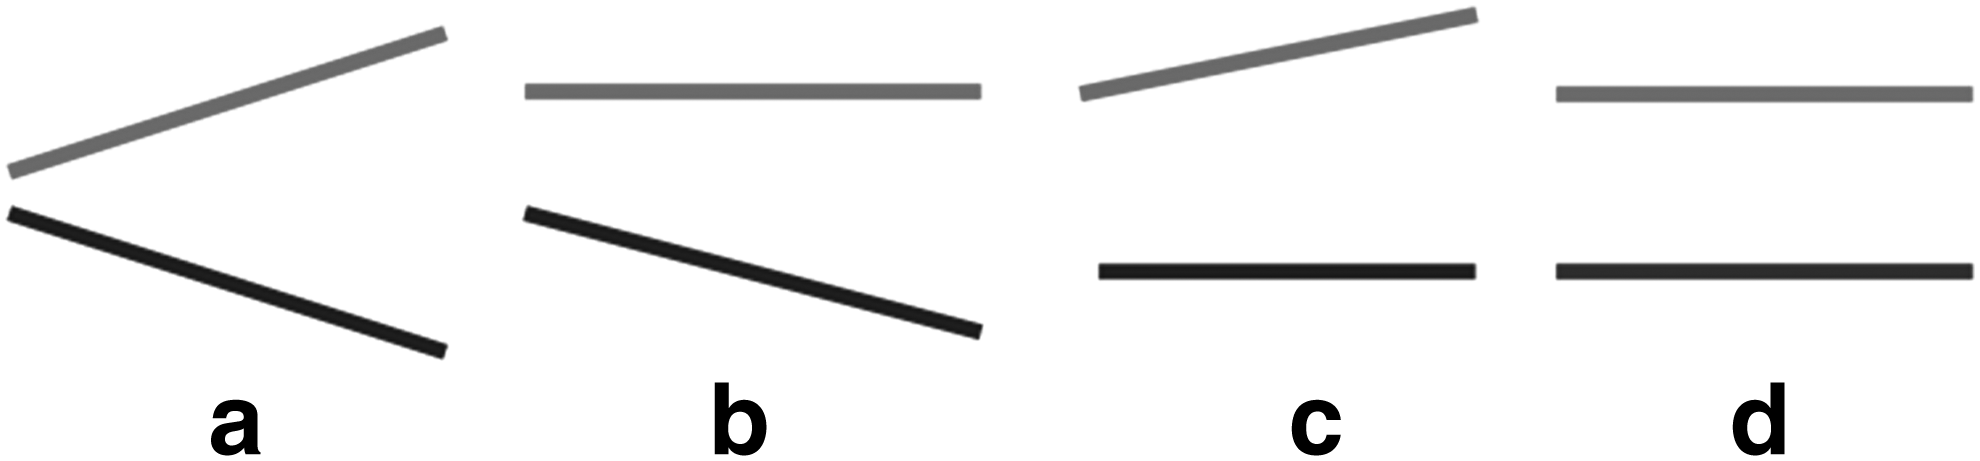
Four types of recorded circumference curves during plethysmography of lymphedema legs.
In a normal leg, the test chamber was inflated consecutively to 50, 80,100 and 120 mmHg. The lower curve under the test chamber shows only minor decrease due to lack of edema fluid. The upper curve above the inflated test chamber shows soft skin and subcutaneous tissue displacement returning to normal position during the deflation phase. Flat upper curve indicates no fluid translocation, as there was no edema.
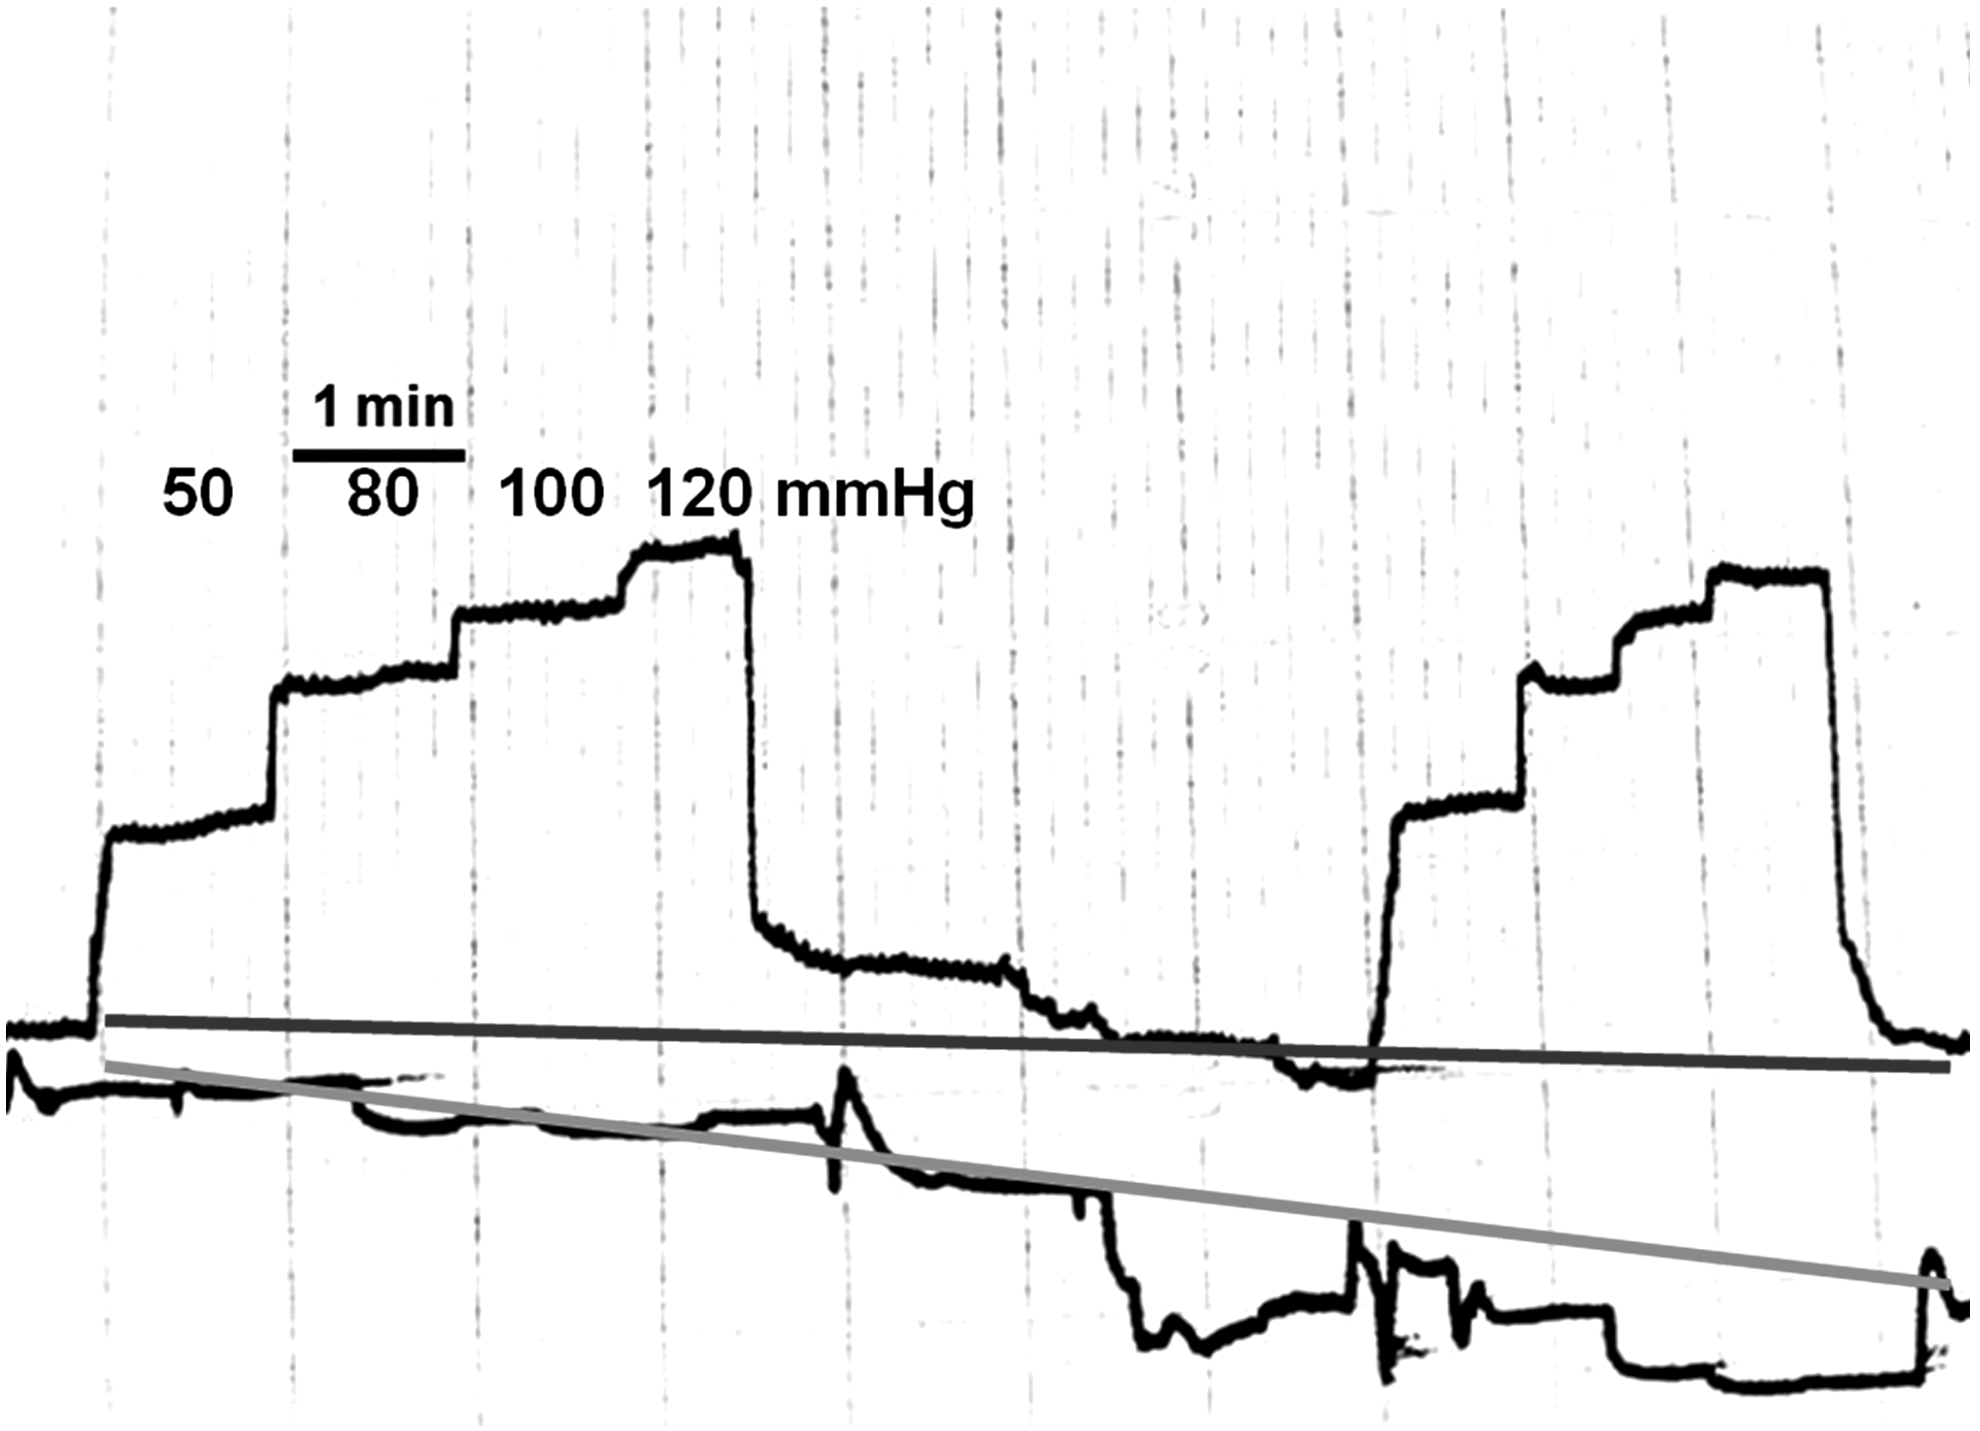
Plethysmography in lymphedema stage II showed evident decrease in circumference under chamber pressure of 50 mmHg (lower straight line) and increase above it (upper straight line). This means there was flow from the compressed to the upward tissue region.
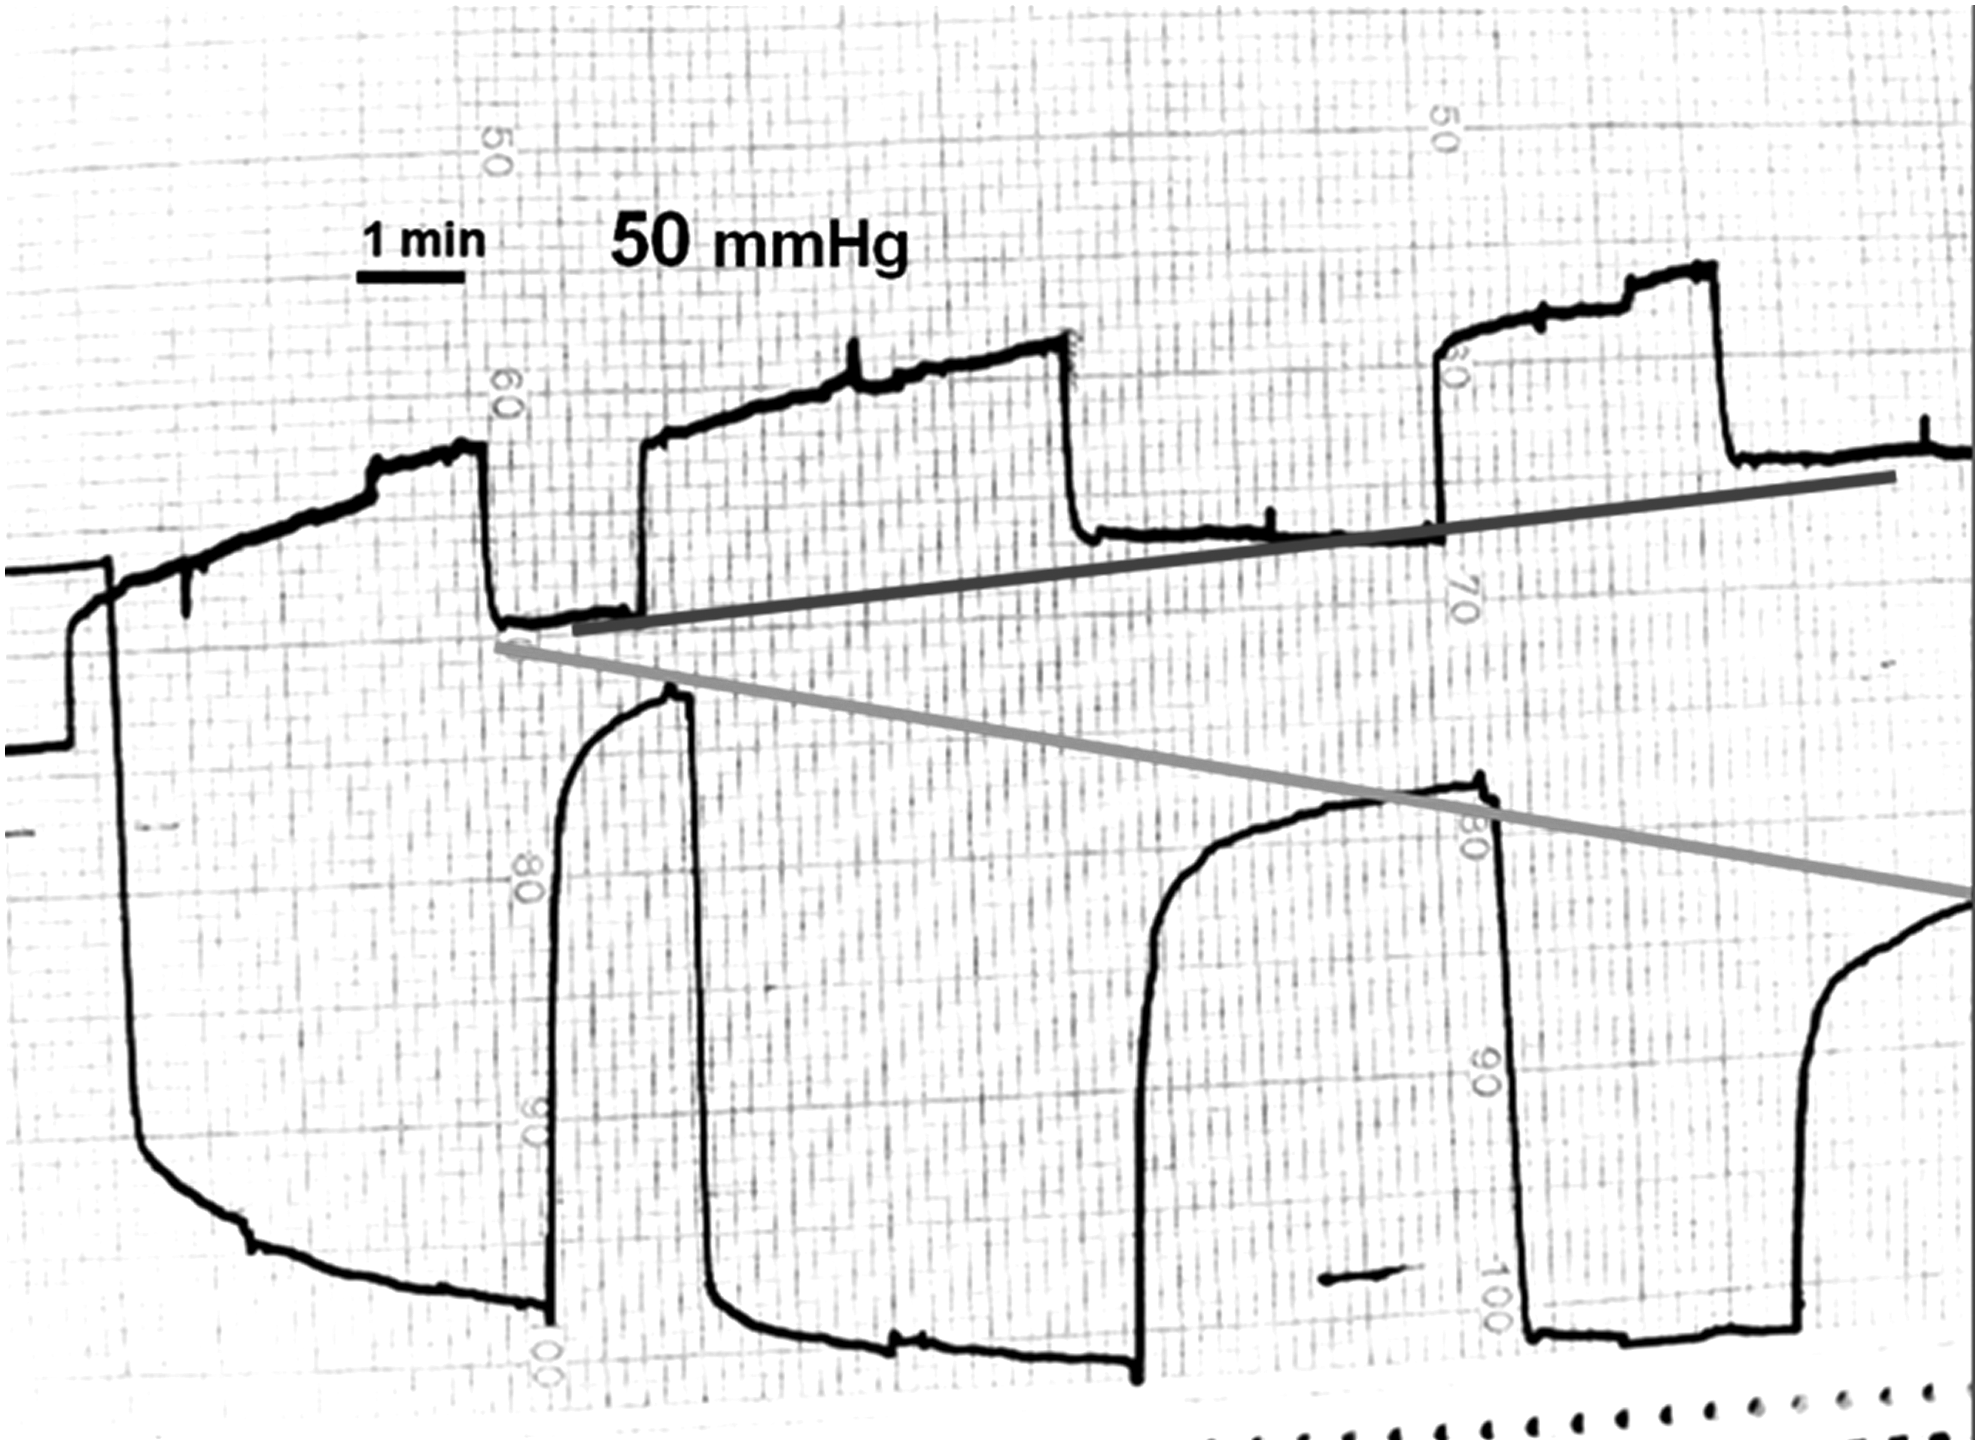
Plethysmography in lymphedema stage II. Three consecutive inflations of test chamber to 50 mmHg 3–4 minutes each. Decrease of leg circumference under the inflated chamber (lower straight line) and rise in the upward region (upper straight line). Evident evacuation of edema fluid from under the test chamber and its proximal translocation.
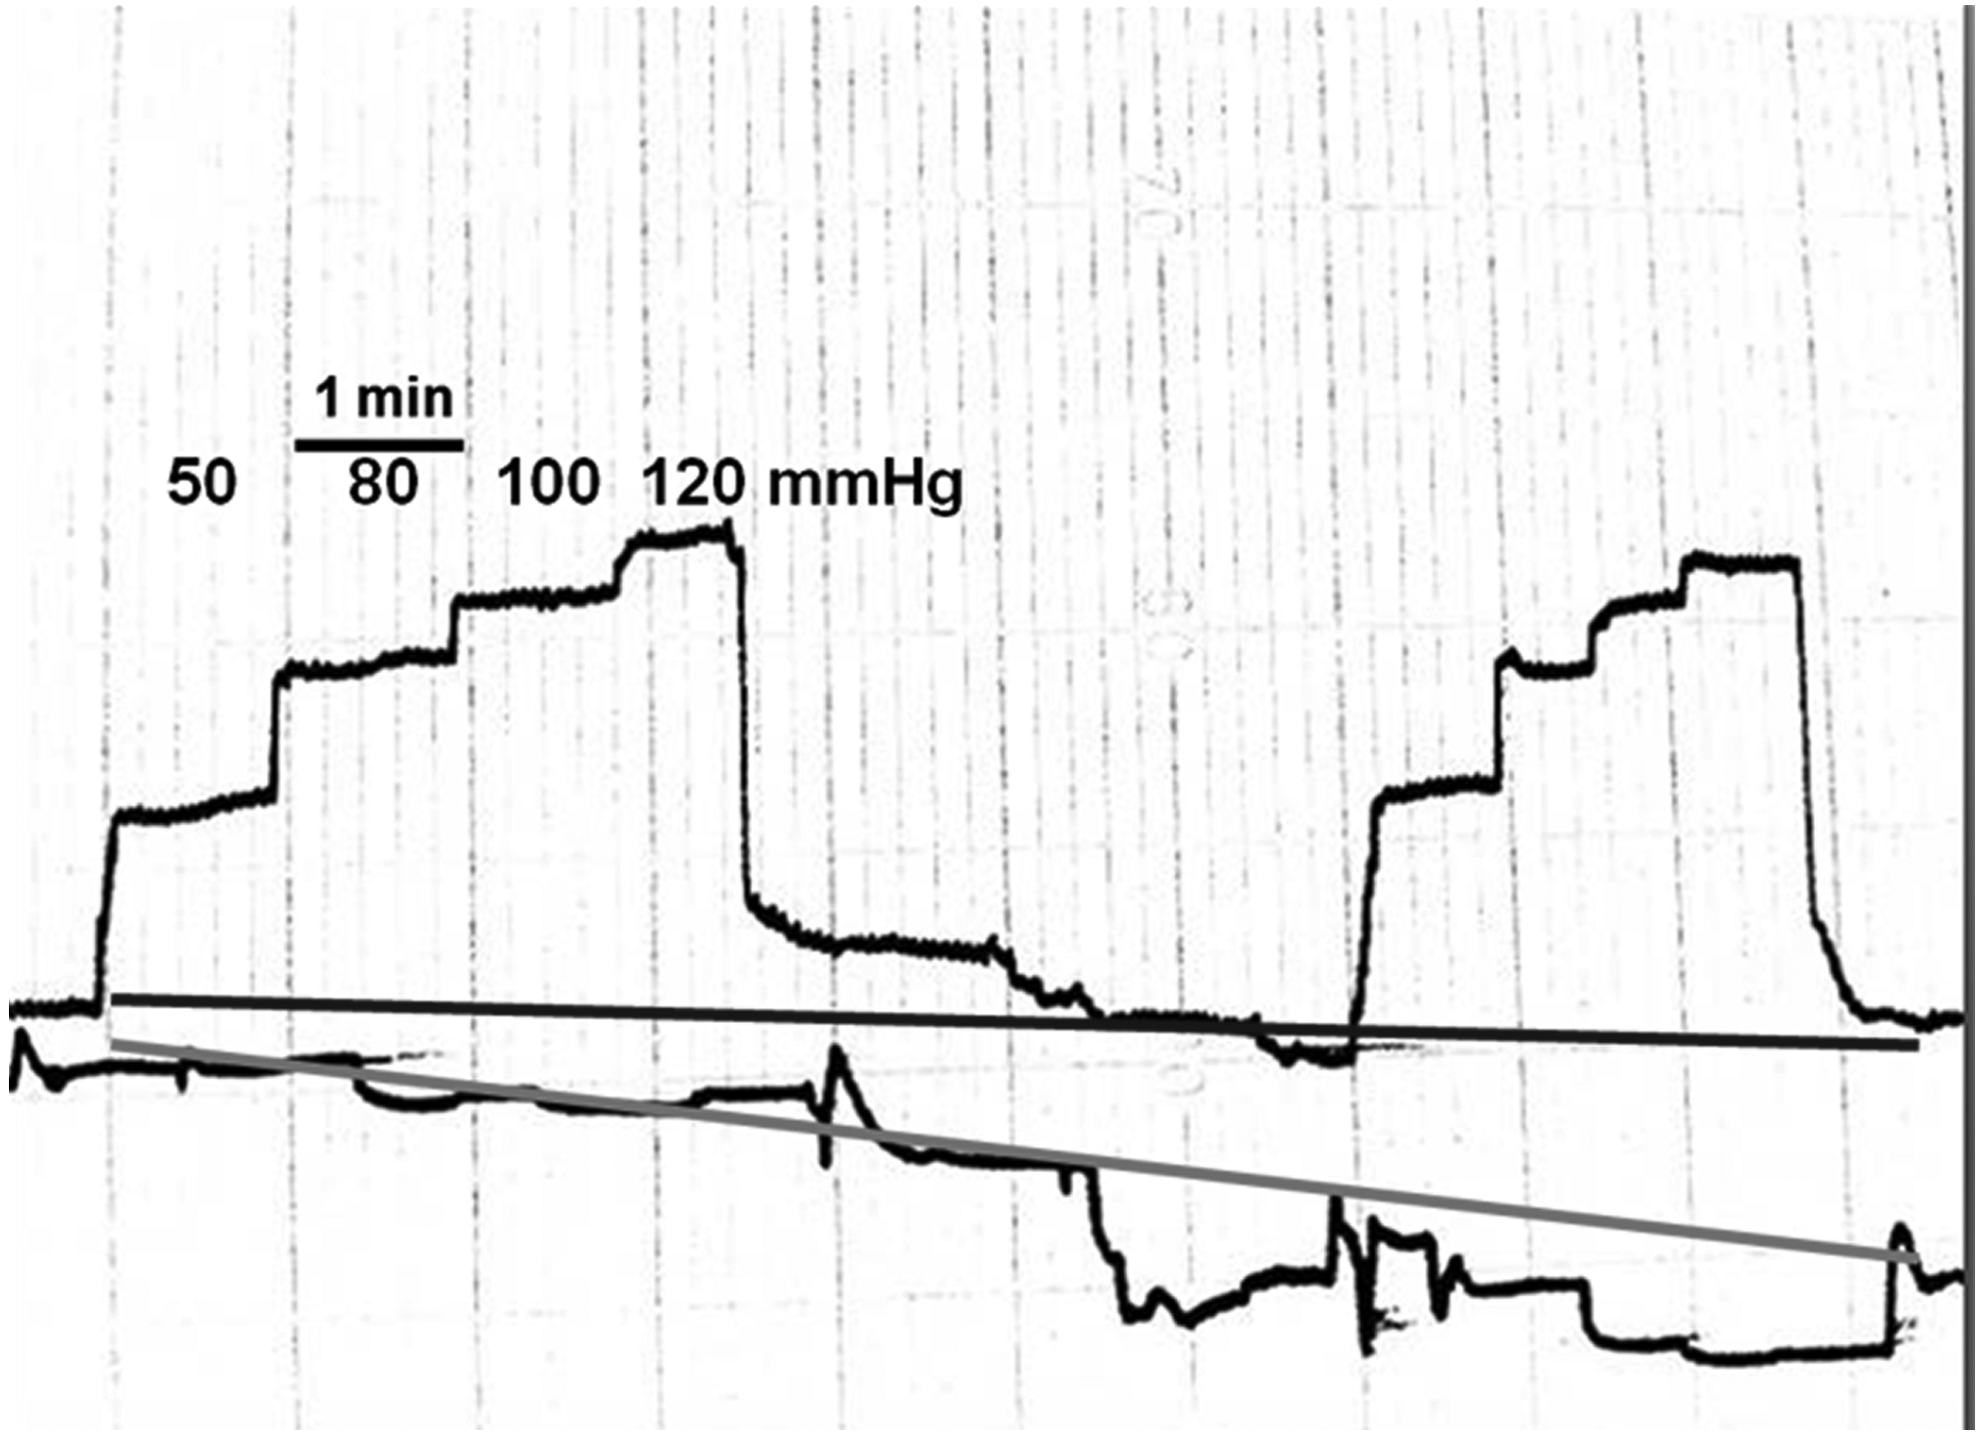
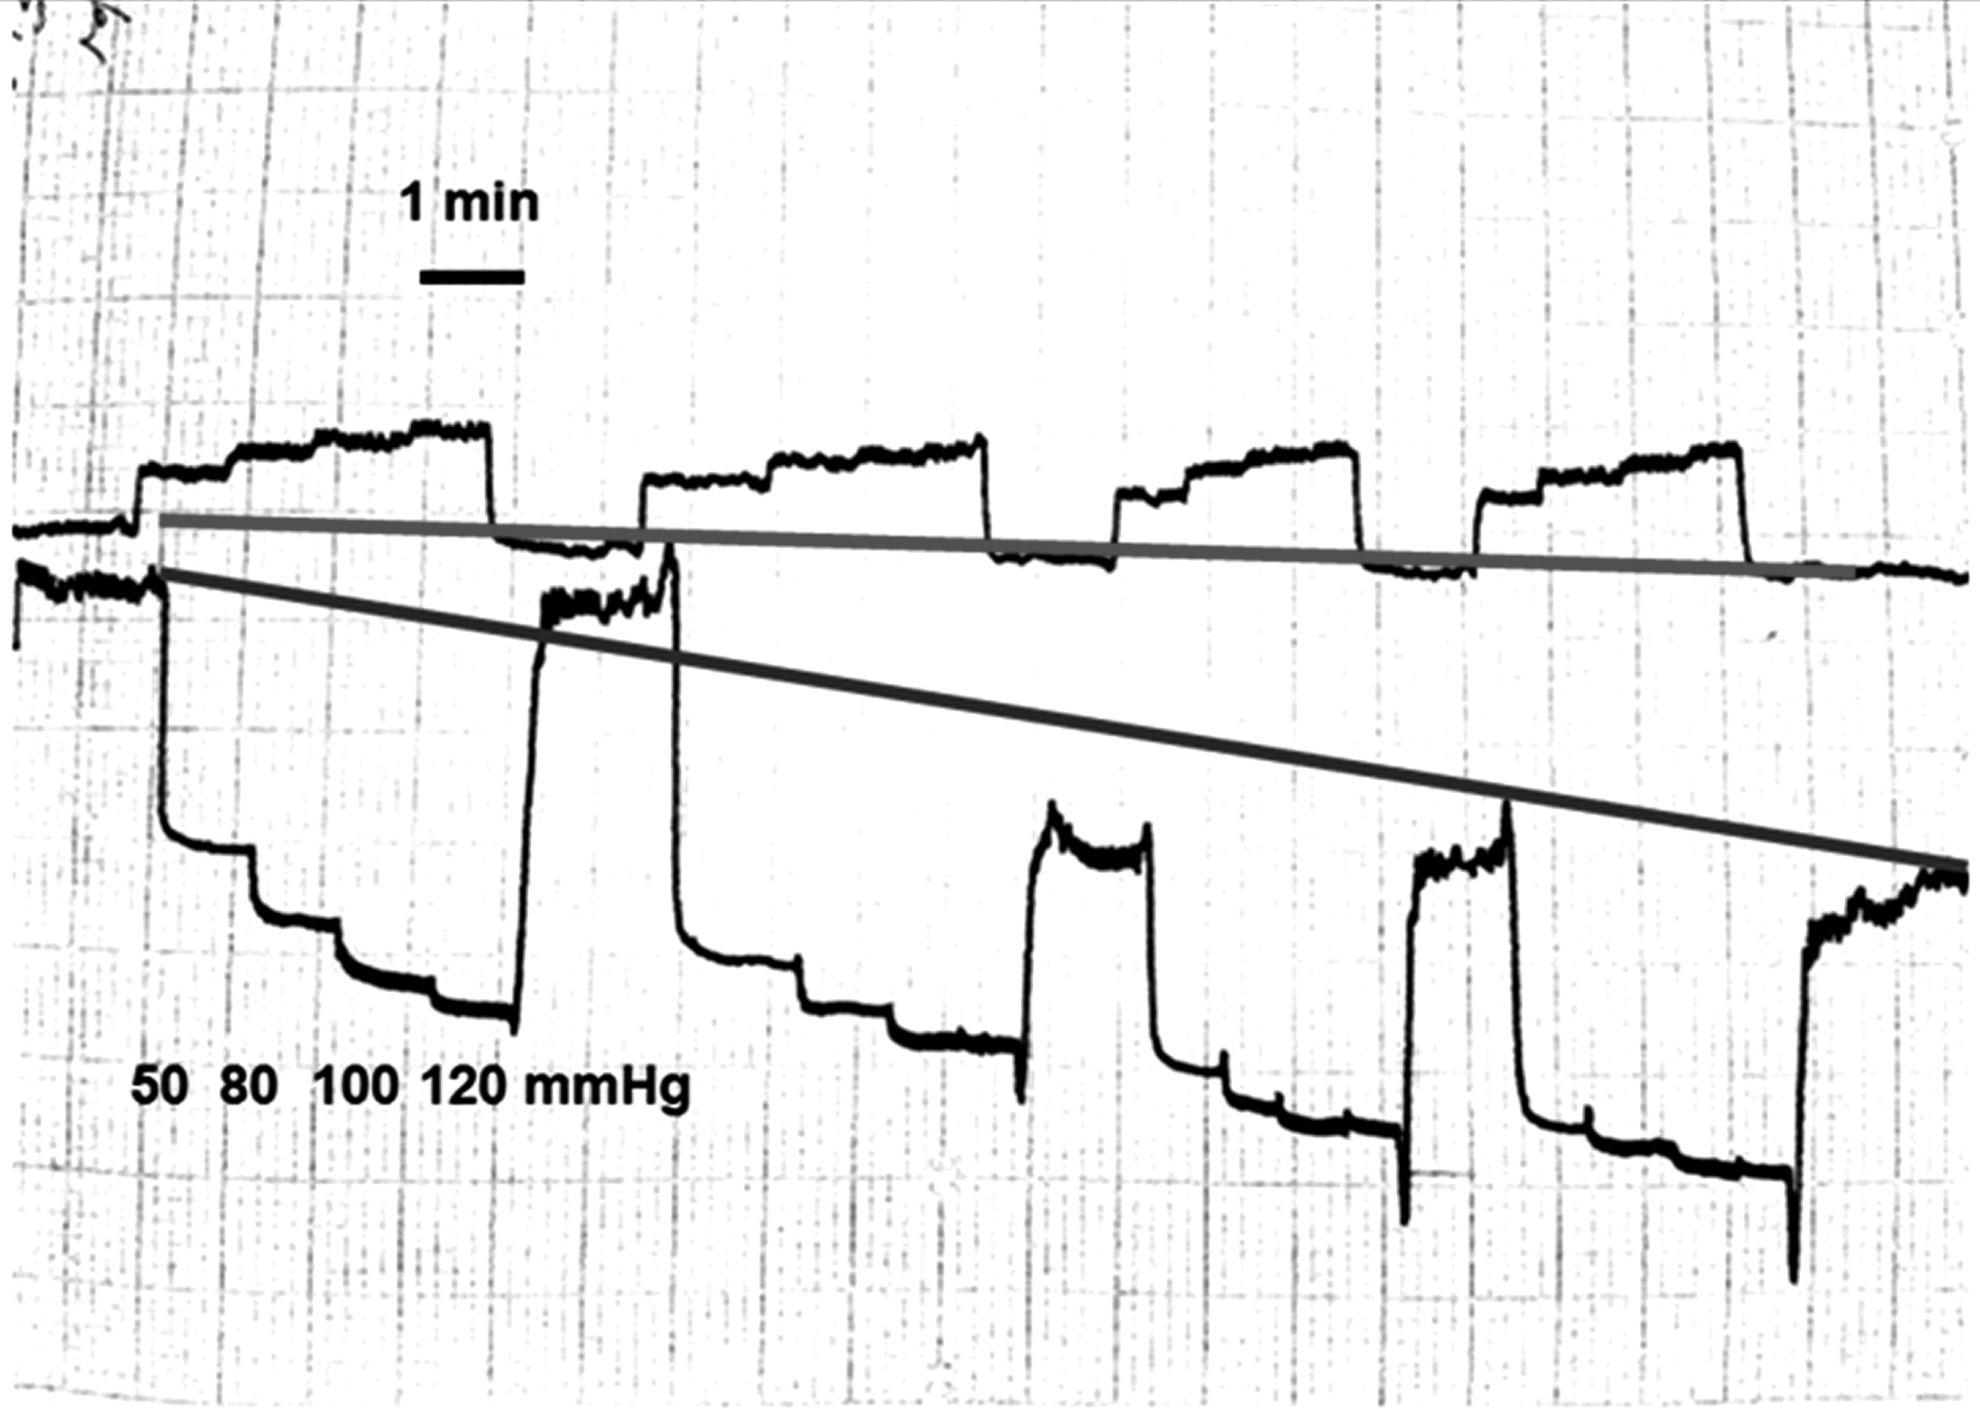
Plethysmography in lymphedema stage II. Four consecutive inflations of test chamber to 50, 80, 100, and 120 mmHg 3 minutes each. Decrease of leg circumference under the inflated chambers (lower straight line) and rise in the upward leg region (upper straight line). Evident evacuation of edema fluid from under the test chamber and its proximal translocation. Higher inflation pressures produced more decrease of circumference.
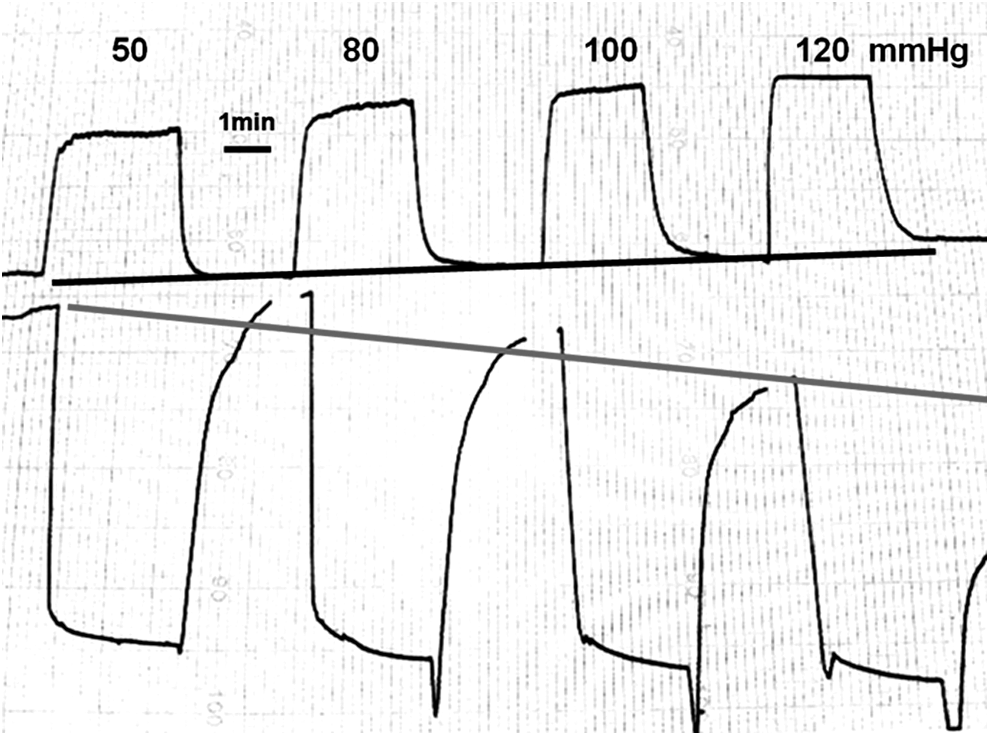
Plethysmography in lymphedema stage IV. Four cycles with chamber inflated consecutively to 50, 80, 10,0 and 120 mmHg each. Evident decrease of circumference (lower straight line) more expressed with higher pressures. This could be accounted for by evacuation of edema fluid. Lack of increase of circumference above the inflated chamber (upper straight line), most likely due to hard fibrotic skin preventing tissue expansion.
Plethysmography in lymphedema stage IV. Two cycles with chamber inflated to 80 mmHg. No decrease of circumference (lower straight line) that could be accounted for by hard fibrotic skin. Nevertheless there was increase of circumference above the inflated chamber (upper straight line), most likely due to expansion by fluid and tissue moved from under the test chamber.

Plethysmography in lipo-lymphedema stage II. Although there was decrease in circumference under the test chamber, during deflation the curve returned to the pre-inflation level (lower straight line). There was increase in circumference proximal to the test chamber; however, during deflation it returned to the pre-inflation level. Increasing inflation pressures from 50 to 120 mmHg had no effect on circumference. Soft tissues were displaced proximally during inflation to return back upon deflation. Since there was no edema fluid, the calf circumference remained unchanged.
Lymphedema staging and circumference recordings
Generally, patients in stages III and IV displayed low-angle inflation or deflation curves. However, there were also cases with hard skin in stage II and in stage III with relatively elastic skin, as shown on compression and recoil curves.
Discussion
We showed that calf plethysmography, with use of an inflated mid-calf embracing cuff and circumference recording device, provides information on the hydraulic effects of compression. The obtained data can serve proper setting of pneumatic compression devices as the applied pressure and timing.
The following information was obtained: inflation of a chamber embracing edematous mid-calf to 50–120 mmHg for 1–3 minutes brought about a) decrease in circumference under the chamber and increase proximal to it, b) subsequent change in circumference due to fluid movement, and c) change in circumference due to tissue elasticity. All three give an insight into hydromechanic events in the massaged tissues.
The technical parameters of pneumatic compression devices are usually based on blood rheological data derived from textbooks. These are the capillary and venous blood pressure, tissue venous blood flow and vein capacitance, capillary filtration rate, and laser-measured capillary flow. These data are tenable for physiological conditions. However, the hydraulic parameters in the edematous limbs at rest and external compression are different. The effect of compression on edematous leg depends on: a. compliance of skin (rigid in lymphedema), and b. volume of edema tissue fluid (increased), and c. compliance of subcutaneous tissue, mainly collagen and adipocytes (decreased).
None of these factors are known to the therapist before and during the applied compression. Subsequently, the compression force is arbitrarily set based on common recommendations of 40–50 mmHg and timing of 5–20 seconds.
Recent data on edema fluid hydromechanics show that IPC pressures should be higher and timing extended. 4 The minimum tissue fluid pressure necessary for initiating flow was found to be above 30 mmHg. 5 Moreover, the tissue fluid pressures had the tendency to be lower during compression than in the inflated chamber.6,7 The crucial factor in applying compression is knowledge of skin compliance. Hard skin creates resistance to the applied force and its dissipation on the chamber–skin interface. Force does not reach deep tissues containing bulk of edema fluid. The other factor responsible for the effects of compression is the structure of the subcutaneous tissue. It contains the bulk of edema fluid located between stiff mature collagen bundles and fat globules. In the early stages, there may be more fat tissue than fibrosis of septa between skin and fascia and of perimuscular fascia itself. In course of time, fat is more and more replaced by fibrous tissue. Moreover, inflammatory infiltrates form regions of firm tissue, especially at the internal aspect of the calf. The thickness of fibrotic dermis may reach 2–3 cm and that of fascia over 2 cm.
The question arises as to whether evaluation of the structure of skin, subcutaneous tissue, and fascia, and their hydraulic conductivity, could not be done with ultrasonography, computer tomography, and MRI. We could not elaborate any practical useful relationship data between imaging, tissue elasticity, and hydraulic conductivity. Moreover, imaging was not helpful in making the decision whether to do liposuction or debulking (LIT). Data from the pertinent literature confirm our views.
Measuring skin and subcutaneous tissue thicknesses with ultrasound was not feasible in 29%–71% of scanning points in stage III legs because of poor delineation of boundaries at the dermo-hypodermal junction and the upper boundary of the muscular fascia. 8 Computer tomography showed thickening of skin thickening and subcutaneous edema accumulation in 95% of cases with lymphedema. A honeycombed pattern was present in 41% of lymphedema, however, detailed structure of subcutis could not be evaluated. 9 Similar findings were described by Liu et al.10,11 Dermis was significantly thickened in 90% of patients. In the subcutis, MRI characteristically displayed diffuse edema or a honeycombed pattern and “lakes” with a marked increase in signal intensity with T2-weighted imaging. The hyper-echogenic areas were surrounded by hypo-echogenic streaks as adipose tissue surrounded by fluid embedded in fibrous tissue. These observations were not helpful in the pre-treatment setting of mechanical parameters of compression as pressure and timing.
The method most predictive of the consistency of tissues was deep tonometry (manuscript in preparation). This prompted us to design the new test described in the present article, based on measuring elasticity and recoil properties of the swollen tissue. The results of edema fluid hydromechanics originate from academic studies and serve general knowledge. However, daily practice in compression therapy requires the therapist to know how high compression pressures and timing should be applied to an individual patient. This can be obtained with our method using two pneumatic cuffs and a plethysmograph recording changes in circumference during compression. The analysis of angle of descending and ascending recording curves, their dependence on compression pressure, and data on compressibility and recoil of compressed tissues provide enough information for setting of IPC parameters at optimum levels.
There are significant variations of hydromechanic response among patients. Four types of the most common curves were selected and presented on figures as standards for comparison with those obtained by therapists. The decreasing curves under the inflated chamber and increasing proximal to it at a given pressure and time of compression indicate that there is edema fluid flow. A flat curve under the inflated chamber but rising proximally to it shows that skin under the chamber is hard; however, fluid flows in the subcutaneous tissue. Pressure and timing should be increased. Decreasing curve under the inflated chamber but flat above it indicates that there might be flow; however, higher pressures should be tried. Horizontal curves under the inflated chamber and proximal to it point to lack of flow. Higher pressures and time of compression should be tried. If there is no change in curve angle, compression is not effective and should not be applied. Besides, difference in circumference between inflation and deflation should be measured as it gives an insight into the volume of moved fluid. High compressibility of tissues indicates that high compression pressures can be used to obtain better results.
We did not observe a direct correlation between stages of lymphedema and less steep inflation or deflation curves. There were cases with hard skin in stage II and in stage III with relatively elastic skin.
Taken together, this two-chamber inflation–deflation test with plethysmographic recordings provides data on the circumference changes during tissue compression, time necessary to obtain optimum decrease of circumference, and insight into tissue elasticity. These data are useful for setting the compression devices at levels producing decrease in limb swelling as well as prognostic value with respect to the efficacy of long-term use of IPC.
Footnotes
Author Disclosure Statement
No competing financial interests exist for all authors.
This study was supported by a grant from the National Center for Research and Development, Poland, N R13 0026 06 and National Science Center UMO02013/11/B/ST8/o3589