
Abstract
Abstract
Background:
Lymph nodes (LNs) are positioned strategically throughout the body as critical mediators of lymph filtration and immune response. Lymph carries cytokines, antigens, and cells to the downstream LNs, and their effective delivery to the correct location within the LN directly impacts the quality and quantity of immune response. Despite the importance of this system, the flow patterns in LN have never been quantified, in part because experimental characterization is so difficult.
Methods and Results:
To achieve a more quantitative knowledge of LN flow, a computational flow model has been developed based on the mouse popliteal LN, allowing for a parameter sensitivity analysis to identify the important system characteristics. This model suggests that about 90% of the lymph takes a peripheral path via the subcapsular and medullary sinuses, while fluid perfusing deeper into the paracortex is sequestered by parenchymal blood vessels. Fluid absorption by these blood vessels under baseline conditions was driven mainly by oncotic pressure differences between lymph and blood, although the magnitude of fluid transfer is highly dependent on blood vessel surface area. We also predict that the hydraulic conductivity of the medulla, a parameter that has never been experimentally measured, should be at least three orders of magnitude larger than that of the paracortex to ensure physiologic pressures across the node.
Conclusions:
These results suggest that structural changes in the LN microenvironment, as well as changes in inflow/outflow conditions, dramatically alter the distribution of lymph, cytokines, antigens, and cells within the LN, with great potential for modulating immune response.
Introduction
L
As lymph flows from the periphery towards the nodes, it carries with it cellular debris, metabolic intermediates, immune cells, and many other substances found in the interstitium. Additionally, the lymph flow itself is a modulator of the lymphatic vessel contraction frequency and amplitude,4–6 acting via lymphatic endothelial cell signaling, 7 and hence determines the rate by which lymph is transported to the LNs. As filters of the lymphatic system, the LN environment is directly exposed to these lymph-borne factors, and so provides as a ‘snapshot’ of the status of the upstream tissue.
In the case of a peripheral infectious challenge, pathogens and their products can be swept up in the lymph and carried to the “draining LN”, making these sites ideal as centralized points of immune surveillance. 8 As lymphocyte activation is dependent on antigen exposure, lymph flow is required for the delivery of pathogenic material to the draining lymph node where it can stimulate immune responses.
In the B cell follicle, lymph-transported antigen can be scavenged from the lymph by subcapsular sinus macrophages and handed off to waiting B lymphocytes,9–11 or directly scavenged from the lymph via the dense conduit network. 12 In the case of T lymphocyte activation, activated antigen-presenting cells (APC), most importantly dendritic cells (DCs), from the periphery capture, process, and transport antigen along a carefully groomed CCL19/21 gradient to the lymphatics.13–15 Additionally, we have shown that there is a population of antigen-presenting cells within the walls of the muscularized prenodal lymphatics that can also capture, process, and transport antigen but do it very quickly. 16 When in the collecting lymphatic vessels, APC can detach from the lymphatic endothelial cells and join others suspended in the lymph to be carried by the flow to the draining LN where they facilitate T cell response.17,18
Additionally, cytokines and chemokines released at the site of infection can also be carried via the lymph to the draining lymph node, and have been shown to contribute to the quality and quantity of immune response.19,20 In all three of these systems—passive antigen drainage, active antigen transport via cells, and cytokine ‘remote signaling’—the dynamics of lymph flow within the LN have significant impact on the ability of the immune system to appropriately and rapidly respond to peripheral challenge.
In the absence of lymph flow, antigen, cytokine and chemokine transport would have been limited to effective diffusion length scales of a few hundred microns. 21 Moreover, DCs are bound with the crawling speed of ∼6.4 μm/min in the initial lymphatics, whereas when they are transported via lymph flow in the collecting vessels, they have velocities around 1200 μm/min (∼200-fold faster). 17 Despite the essential role of lymph flow in transport and distribution of molecules and cells towards and inside the node, the patterns and flow of lymph within the LNs have not yet been fully characterized.
While DCs and emigrating lymphocytes often make use of the lymphatic vasculature for migration to and from LNs, naïve lymphocytes and other hematopoietic lineages make use of a second, circulatory-based pathway into the LN through high endothelial venules (HEVs). Through the well-established mechanism known as ‘rolling adhesion’, immigrating cells from the blood make use of specialized blood endothelial cells (BECs) to roll along vessel walls, arrest in the lumen, and ultimately cross the blood endothelial barrier into the LN parenchyma.22,23
In addition to HEVs, the LN contains a network of traditional vasculature responsible for the homeostatic maintenance of the lymphoid organ (Fig. 1). While this network of vessels maintains a tight barrier against cellular egress from the blood into the LN (unless through HEVs), the transfer of fluid between the lymphatic vasculature and blood (in either direction) has been previously documented. 24 Indeed, the tight association of lymphatic vasculature and blood vasculature within the LN raises interesting questions about the variables that influence fluid transfer between these systems, and how physiological changes in those variables affect change in lymph flow, and thus, immune responsiveness.

Geometry of the lymph node.
Structurally, the lymph node is comprised of several distinct lymphatic compartments, each of which provides different resistance to lymph flow. When lymph enters the node through afferent vessels, it arrives first in the subcapsular sinus (SCS) lumen.25,26 This sinusoidal space, often characterized by the presence of SCS macrophages, overlays the LN cortical regions (B cell follicles) in a ∼10 μm sheet spanned by periodic collagen spacers that connect the outer LN capsule with the SCS floor. 27 As lymph flows through the SCS lumen, it can be laterally diverted into the conduit system—a network of fine reticular collagen fibrils, which penetrate the B cell follicle and reach deep into the paracortex (Fig. 2A).
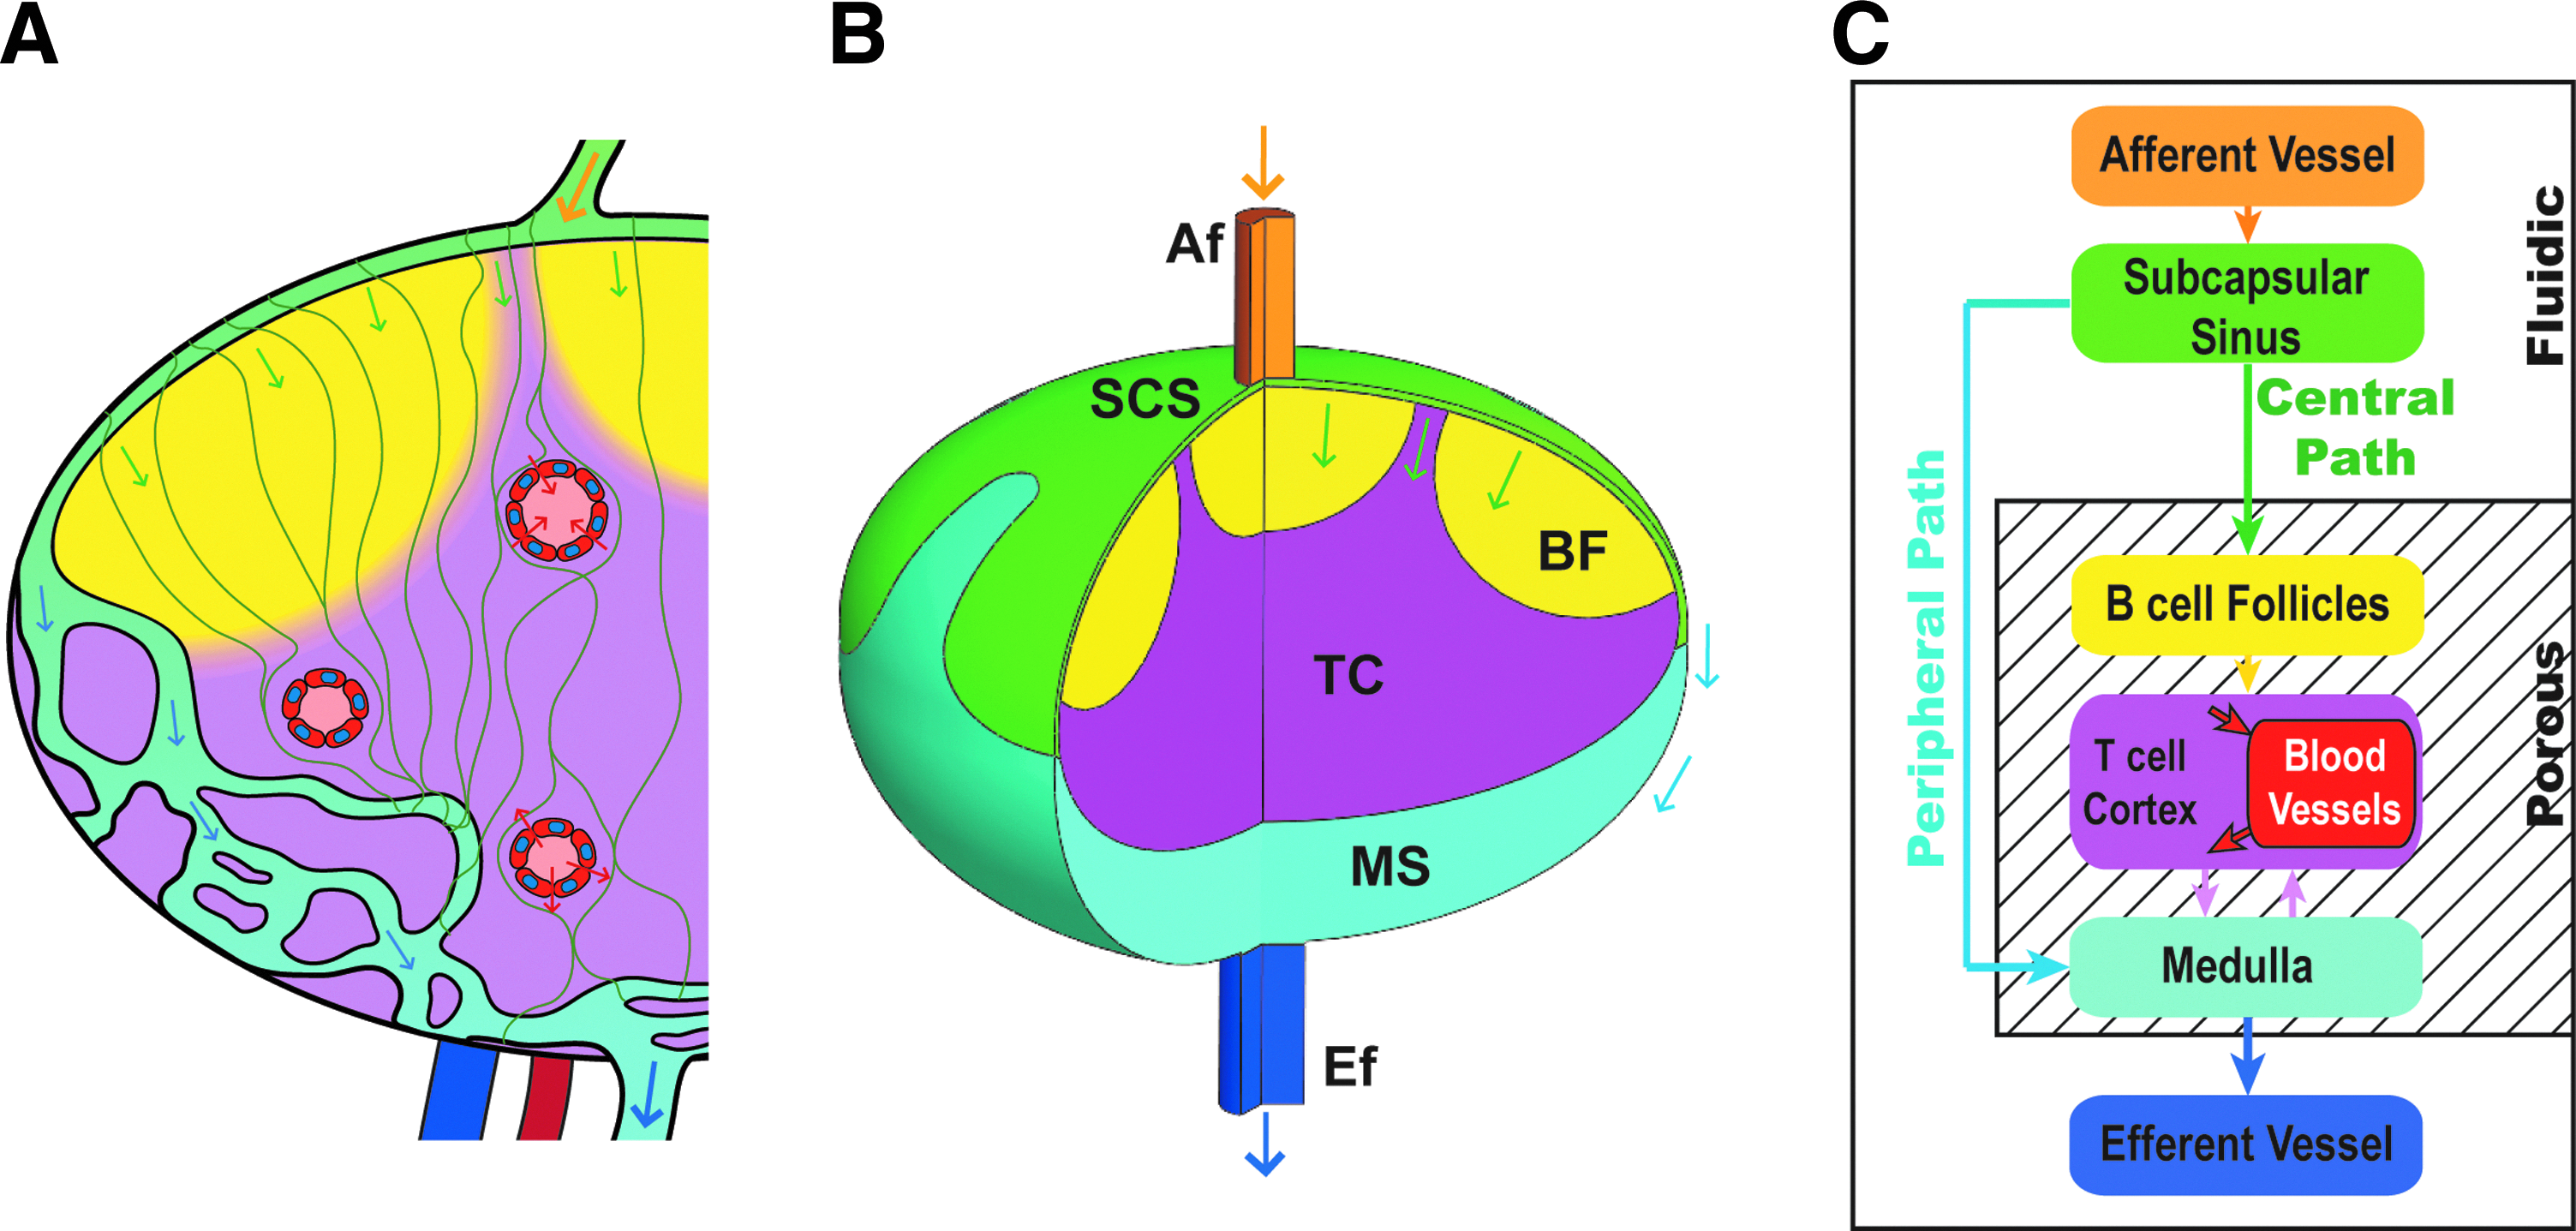
Idealized geometry and the flow paths in the lymph node.
The conduit network is important in the delivery of soluble antigen to B cell follicles, resulting in deposition on the resident follicular dendritic cells. 28 Interestingly, this system has been shown to exhibit a molecular weight cutoff at roughly 70 kD, with larger antigens being excluded, 29 and therefore retained in the SCS. Lymph and soluble molecules not directed into the conduit system are presumably transported into the LN medulla via lymph paths that are not well described and characterized prior to collection and egress in the efferent lymphatics.26,30,31
The medulla is comprised of a complex network of lymphatic vasculature densely packed by medullary macrophages as well as trafficking leukocytes. 27 While each of these structures has been individually evaluated in contribution to potential immune response, their individual impact on fluid flow, and thus chemokine and antigen distribution throughout the LN, has not been evaluated.
To characterize the structure of the LNs, Woodruff et al. developed whole organ imaging of cleared nodes as well as 3D reconstruction of serially sectioned nodes. 32 Although the whole organ imaging technique provides valuable insight into the location and size of the each of the nodal compartments and cellular interactions, it provides no information on physical properties such as hydraulic conductivity and permeability that govern lymph and antigen transport in the node.
Although most of the current immunology and drug discovery experiments are carried out on mice, no experimental data are available on the fluid exchange in the LNs of mice, presumably because of the scale of the mice nodes as well as the complexity of the numerous inlets and outlets for lymph and blood in the nodes.
Other researchers have taken the approach of analyzing LNs in larger animals such as dog and sheep. Adair and Guyton cannulated afferent and efferent vessels of canine popliteal LN and left the blood vessels intact while measuring pressure in a downstream venule.24 33 By perfusing the node with a constant flow rate, they were able to show that about 10% of the afferent lymph is absorbed by blood vessels under physiologic pressures, whereas during imposed venous hypertension the direction of the lympho-venous fluid flow can reverse. 24 They also showed that elevation in efferent lymph pressure will increase the amount of fluid transported to blood vessels. 33 Thus, the balance of fluid flows and pressures across the nodal vasculature plays a critical role in determining the movement of lymph fluid through different parts of the node and thus overall immune function.
Mathematical and computational modeling has been widely used to improve understanding of the physiology and immunology of biological tissues.34–37 These methods can be utilized to identify key parameters of a system, suggest new hypotheses, and estimate parameters that cannot be measured.35,38 The design of the model should take into account the important characteristics of the system being modeled, as well as the nature of the questions to be answered. 36
Bocharov et al. used reaction-diffusion models to simulate the distribution of interferon-α in the 3D geometry of the node, but lacked advective transport in the node. 39 Several other models of LNs have been developed using agent-based modeling, and cellular Potts model techniques, and have been able to simulate cellular motions, cell–cell interactions, and cell influx and efflux.40–42 All the techniques described so far are useful in studying cellular interactions, but they all fail to account for the transport of lymph and the fluid exchange in the node. A computational fluid dynamics model based on the experimental data can investigate the lymph flow in the mouse LNs, and further expand our knowledge of antigen and chemokine transport in the node.
Despite the critical role of lymph as the carrier for molecules and cells to the LNs, little is known about its transport patterns and modification while passing through the node. This study aims to construct the first ever three-dimensional computational model of the lymph flow in the LNs and to use parameter sensitivity analysis techniques to determine the important parameters in the lymph transport and exchange in the node.
Materials and Methods
Geometry model
An idealized geometry of the lymph node was constructed in Solidworks 2012 (SP4.0, Dassault Systèmes, France), which is qualitatively based on the images captured in this study, as well as available images in the literature (Fig. 1A and B). The node shape was based on an oblate ellipsoid of the size of a typical mouse popliteal node (large diameter of 1 mm and small diameter of 0.7 mm). The final geometry was comprised of a combination of fluidic and porous regions. The height of the SCS was taken to be 10 μm.18,27,43,44
The geometry shown in Figure 2B is fed by only one afferent vessel at the center (which more closely corresponds to the situation of a mouse popliteal node). The diameters of the afferent vessel and efferent vessel are 70 μm and 100 μm, respectively. The afferent vessel, efferent vessel, and subcapsular sinus are modeled as fluidic regions (bounded spaces of only fluid), while the B cell follicles, T cell cortex, and medulla are modeled as porous regions (Fig. 2B). Flow through the subcapsular sinus, the space between the outer capsule of the node and the inner cellular regions, reportedly is not significantly restricted by the collagen spacers, justifying its approximation as a fluidic region. 45
Computational fluid dynamics
Star-CCM+ (CD-adapco, London), a commercially available finite volume based solver, was used to model fluid flow inside the LNs. The idealized geometry was imported to Star-CCM+ and meshed using polyhedral elements with prism layer in the wall or porous boundaries of the fluidic regions. Computational Fluid Dynamics (CFD) can be a highly accurate means of simulating a variety of flow situations, and works on the principle of solving algebraic representations of the governing fluid flow equations (conservation of mass and momentum) across the small elements that make up the overall geometry. 46
The lymph is modeled as an incompressible (constant density), Newtonian (constant viscosity), homogenous and single component fluid. The bulk properties of lymph such as density and dynamic viscosity are estimated from the literature, which includes the effect of protein concentration. Note that direct representation of proteins is not necessary because of the continuum assumption inherent to the model and the length scales of the flow phenomena of interest here (microns and upward). For the porous regions of B cell follicles, T cell cortex, and medulla, the conservation of mass equation and Darcy's law with Brinkman's term in the form of
(where K is the hydraulic conductivity matrix,
A grid independency study showed that the results with ∼420,000 elements had 2.6% normalized root mean squared error for wall shear stress along the SCS, compared to the finer mesh with ∼680,000 elements. Other parameters of the study had less than 0.5% error between the two mesh sizes. The mesh with ∼420,000 elements was used for the remainder of the study.
To model the exchange of fluid between lymphatic system and blood vessels in the lymph node, we used a source/sink term in the conservation of mass equation
where qBV follows Starling's equation (Equation 3), L is the average hydraulic conductivity of the blood vessels in the node, A is the surface area density of the blood vessels available for exchange of fluid, PBV is the average blood vessel pressure, σ is reflection coefficient of the blood vessels, πBV is the average oncotic pressure of the blood vessels, and πlymph is the average oncotic pressure of the lymphatic channels of the lymph node. In this model, we assumed that the majority of the blood vessels are located in the T cell cortex, and thus the sink term (Equation 2) is applied only in this region.
The flow of lymph through SCS results in a frictional wall shear stress on both the “ceiling” of the SCS (capsule of the node) as well as the “floor” (bordering the B cell follicles and T cell cortex). Following calculation of the velocity vector field, shear stress is calculated using
where
Reynolds number, the ratio of the inertial forces to viscous forces at the afferent vessels was 0.027 (Reynolds number <1), which means that the flow regime was viscous flow and the length required for the flow to fully develop was less than a micron. Efferent pressure is assumed to be 3 mmHg for the baseline case, which is in the physiologic pressure range of lymphatic system,48,49 although parameter sensitivity analysis was performed to investigate the effect of changes in efferent pressure.
Animals
In order to provide more quantitative information on blood vessel structure of mouse popliteal LNs, C57BL/6 mice were used in this study. Mice were housed and bred in standard conditions and used between 6 and 8 weeks of age. Experimental protocols were approved through Harvard University's Institutional Animal Care and Use Committee and conducted in accordance with the National Institutes of Health's Guide for the Care and Use of Laboratory Animals.
In vivo labeling
In vivo labeling of the popliteal LN was achieved through pre-harvest injection of monoclonal antibodies targeting antibody targeting LN stromal populations. Anti-CD35/21 (Alexa 488), and anti-CD31 (A568) were injected i.v. 24, and 1 h prior to LN harvest, respectively. Anti-Lyve1 (Pac Blue) was injected s.c. in the footpad 4 h prior to harvest (Fig. 1A).
LN clearing and whole organ imaging
LNs were dissected and fixed overnight in 4% paraformaldehyde at 4°C. The sample was then incubated in Scale-A2 buffer as previously described 50 for at least 3 weeks at room temperature. Following clearing, intact LNs were imaged by standard confocal microscopy (Fig. 1B). Images were representative of at least two independent trials.
Blood vessel segmentation
Red channel of the acquired popliteal LN z-stack was imported to ScanIP, Simpleware Ltd., UK. After smoothing the data with a Gaussian filter, a combination of threshold and paint was used to carefully segment out all bigger vessels that could be recognized by the user (Fig. 1C). It was not possible with the available technique to segment any smaller blood vessels and capillaries that shrunk as a result of depressurization and fixation. The blood vessels were then reconstructed from the produced mask and the surface area of the blood vessels were calculated to be 1.5 mm2.
Because the capillaries and small vessels that can exchange fluid are not segmented in this image-processing algorithm, we doubled the surface area estimate to 3.0 mm2 for baseline conditions (and varied this further as part of the parameter sensitivity study, below). Using all three channels, the volume of the whole node was reconstructed and calculated to be 0.18 mm3, which results in the blood vessel area density (A) to be 16.6 mm−1.
Parameter estimation
The density and viscosity of the lymph flowing in the node were assumed to be 1000 kg/m3 and 0.0015 Pa.s, respectively. 51 The hydraulic conductivity for the B-cell follicles and T-cell cortex was assumed to be isotropic, at a value of 2.5e-7 cm2/s. mmHg, similar to those measured in LS174T tumors.52,53 Because of the structural complexity and lack of information on the hydraulic conductivity of medullary sinus (MS), its baseline value was assumed to be three orders of magnitude higher than the other porous regions. Parameter sensitivity analysis was done to better investigate the effect of this parameter.
For the blood vessel walls in the node, 7.3e-8 cm/s. mmHg was assumed as the average hydraulic conductivity, in part based on the measured hydraulic conductivity of rat mesenteric venular microvessels in situ of 7.3e-8 cm/s. mmHg. 54 Cultured endothelial cell monolayers are shown to have higher hydraulic conductivity in the range of 1.2-3.6e-7 cm/s. mmHg, which increased 2.16-fold when shear stress of 10 dyn/cm2 was applied for the duration of 1 h. 55 It is noteworthy that the hydraulic conductivity of the medulla is the conductivity of the 3D porous tissue, whereas the hydraulic conductivity of the blood vessels is the conductivity of the vessels wall as a membrane.
Oncotic pressures in the blood (11.5 mmHg) and lymph (3.8 mmHg) were based on the assumption that the protein content of lymph is 40% of that of the plasma51,56 and the previously measured mouse plasma protein content of 4 g/dL. 57 σ was measured to be 0.88 by Adair et al. 58 for canine popliteal LNs and is assumed to be the same for the mouse popliteal LNs. Baseline average blood vessel pressure (PBV) is taken to be 5 mmHg in the baseline case that is similar to the values used by Adair et al. in the experiments on canine LNs. 24
Parameter sensitivity analysis
A high-throughput parameter sensitivity analysis was done with the Optimate+ plugin in the STAR-CCM+. Four parameters were varied over a range of values to investigate the effect of each parameter on the outputs of the system. Because blood vessel wall hydraulic conductivity and surface area of the blood vessels always appear together in the Starling's equation (Equation 3), the parameter sensitivity analysis was done for the product LA. Hydraulic conductivity of medulla was varied over four orders of magnitude because of its complex structure and lack of experimental characterization. The effects of pressure boundary conditions at the efferent vessel (PEf) and the blood vessels (PBV) were studied in the range of 0–30 mmHg and 0–20 mmHg, respectively.
Results
Flow patterns under baseline conditions
Pressures and velocities
Most (93%) of the 133 nL/min of afferent flow moved peripherally (Fig. 2C) around the SCS to the MS, because this pathway presents less resistance to the incoming flow (Fig. 3A). There was a total of 9.7 nL/min (7% of afferent flow) that moved centrally (Fig. 2C) into the paracortex and eventually exited through the blood vessels. The direction of fluid movement is dictated not only by the resistance to flow (porosity, in the case of the B cell follicles and T cell zone), but also the pressure distribution. The pressure near the center of the paracortex was 2.9 mmHg, compared to 3.9 mmHg in the afferent vessels and 3.0 mmHg in the efferent (Fig. 4). The efferent pressure is imposed as a boundary condition, while the afferent pressure is determined by the driving pressure necessary for the specified inlet flow rate at the afferent vessel.
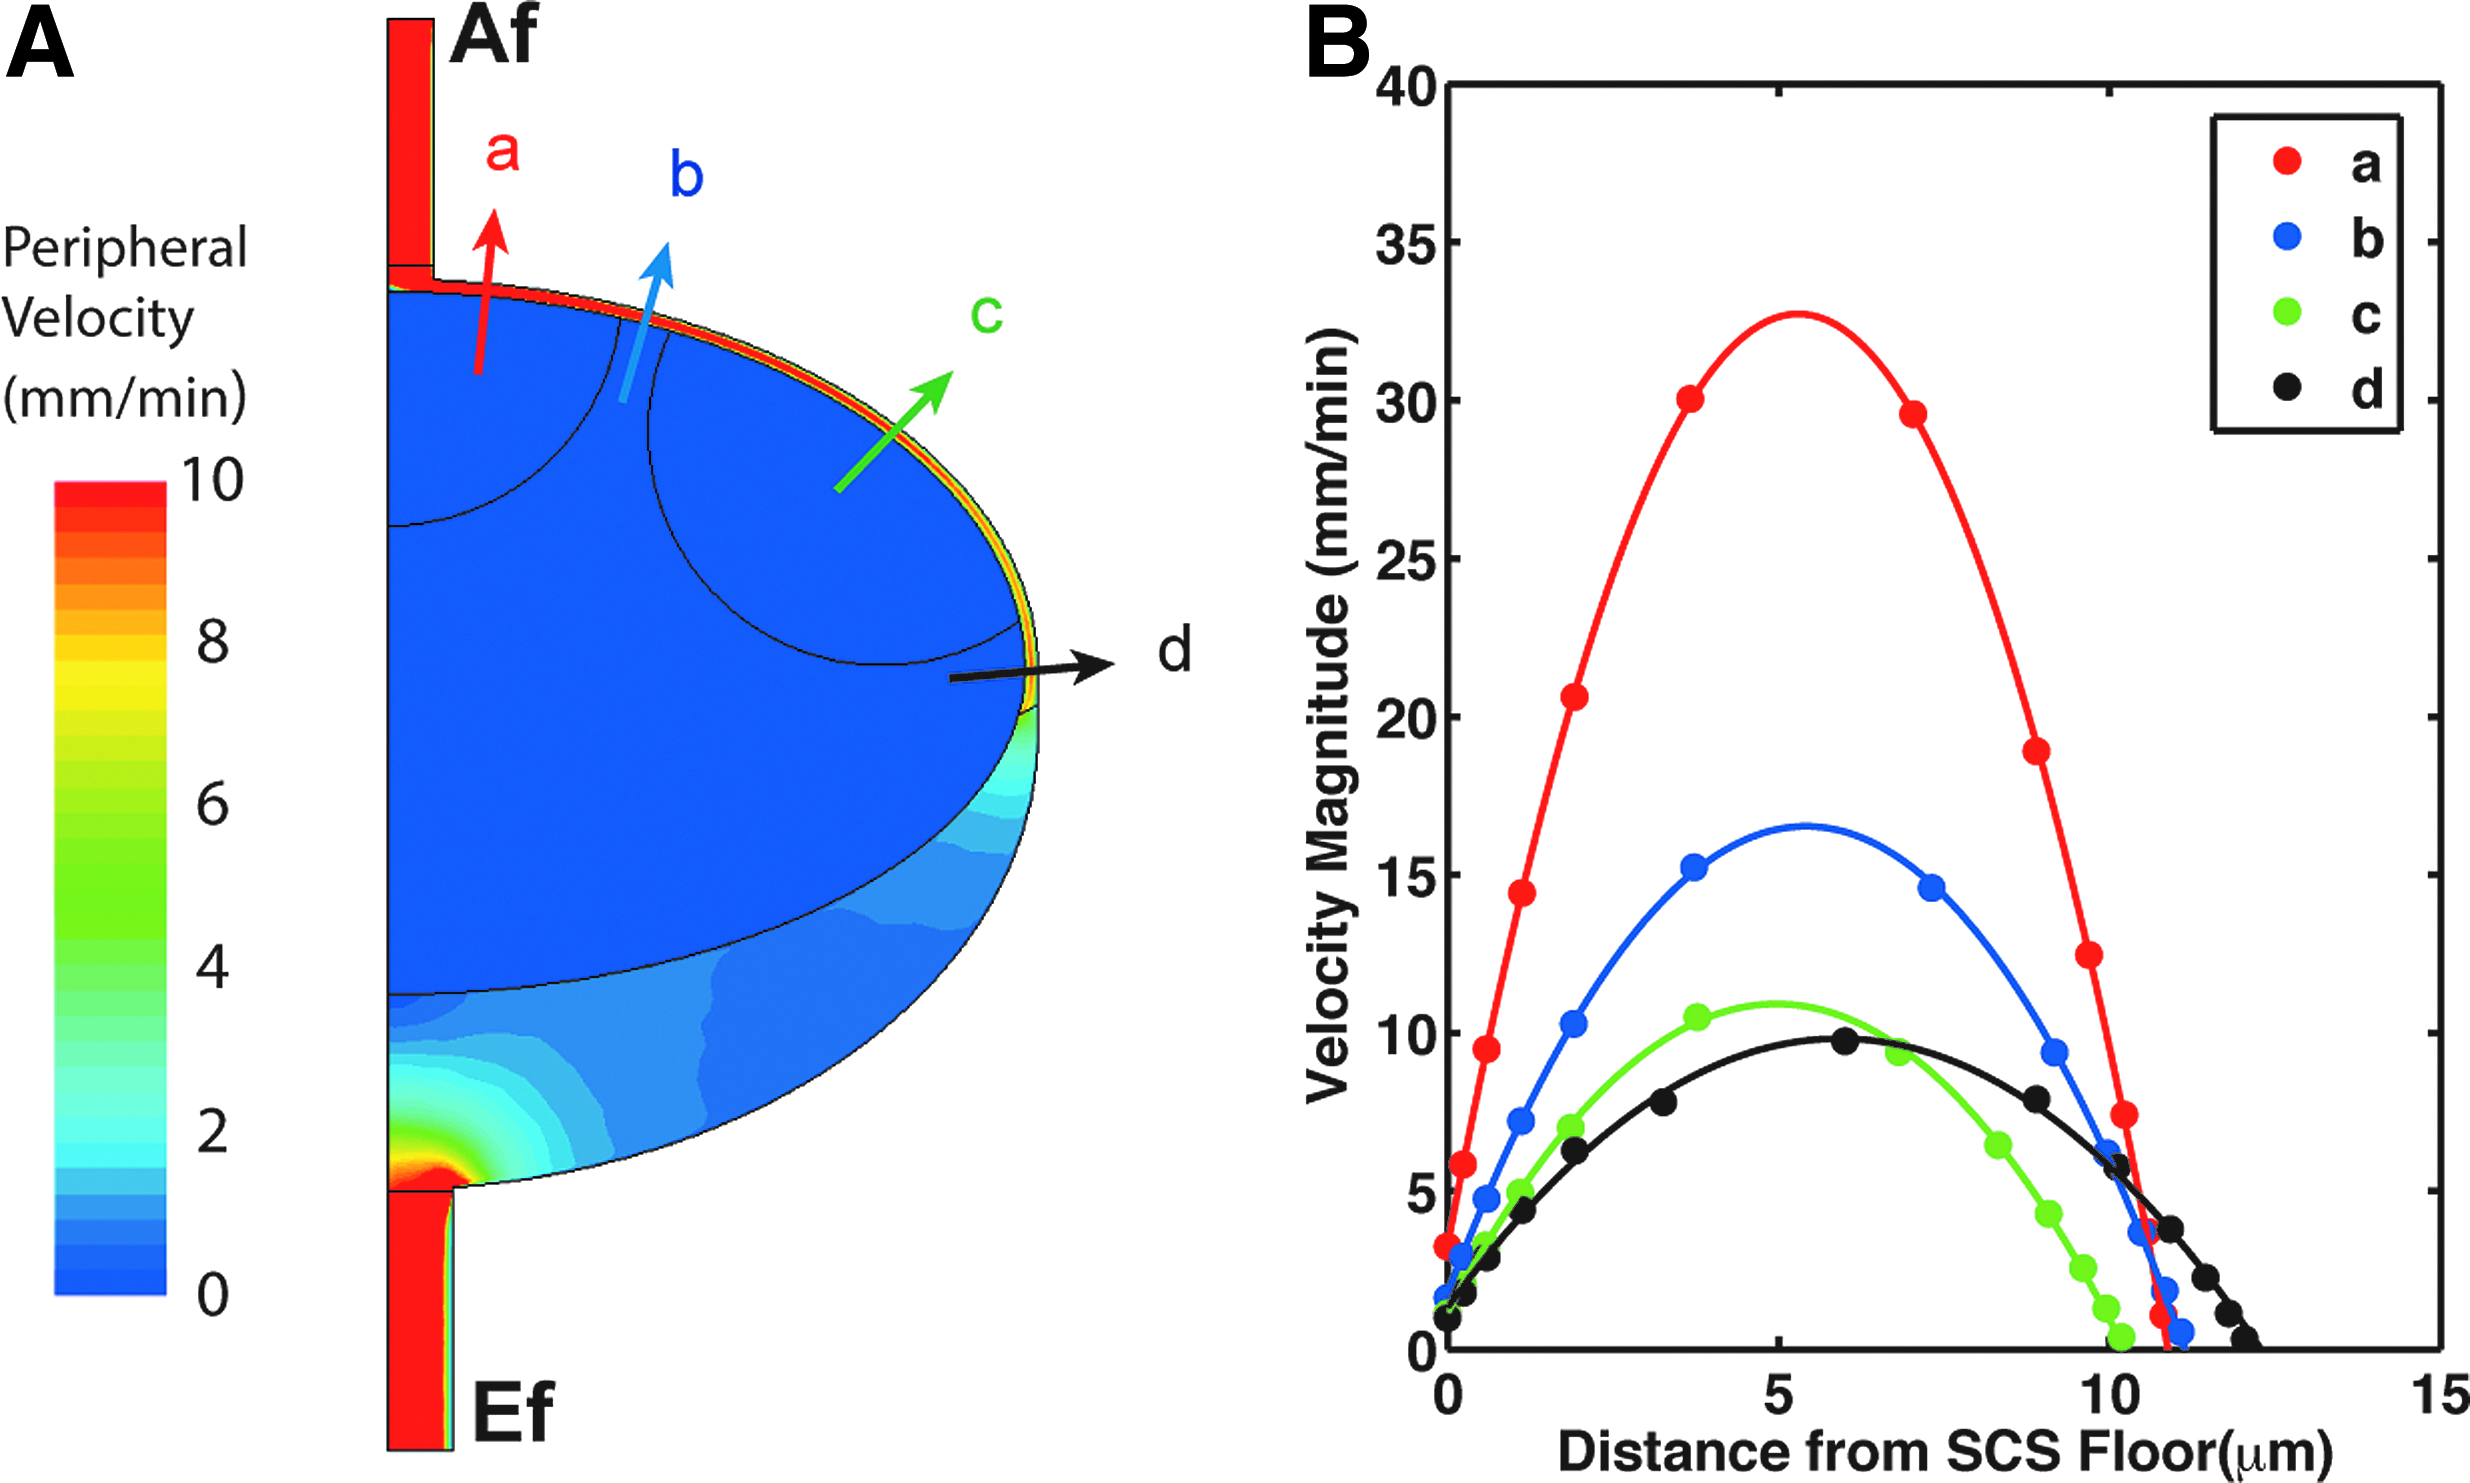
Peripheral velocity contours and velocity profiles along the SCS.
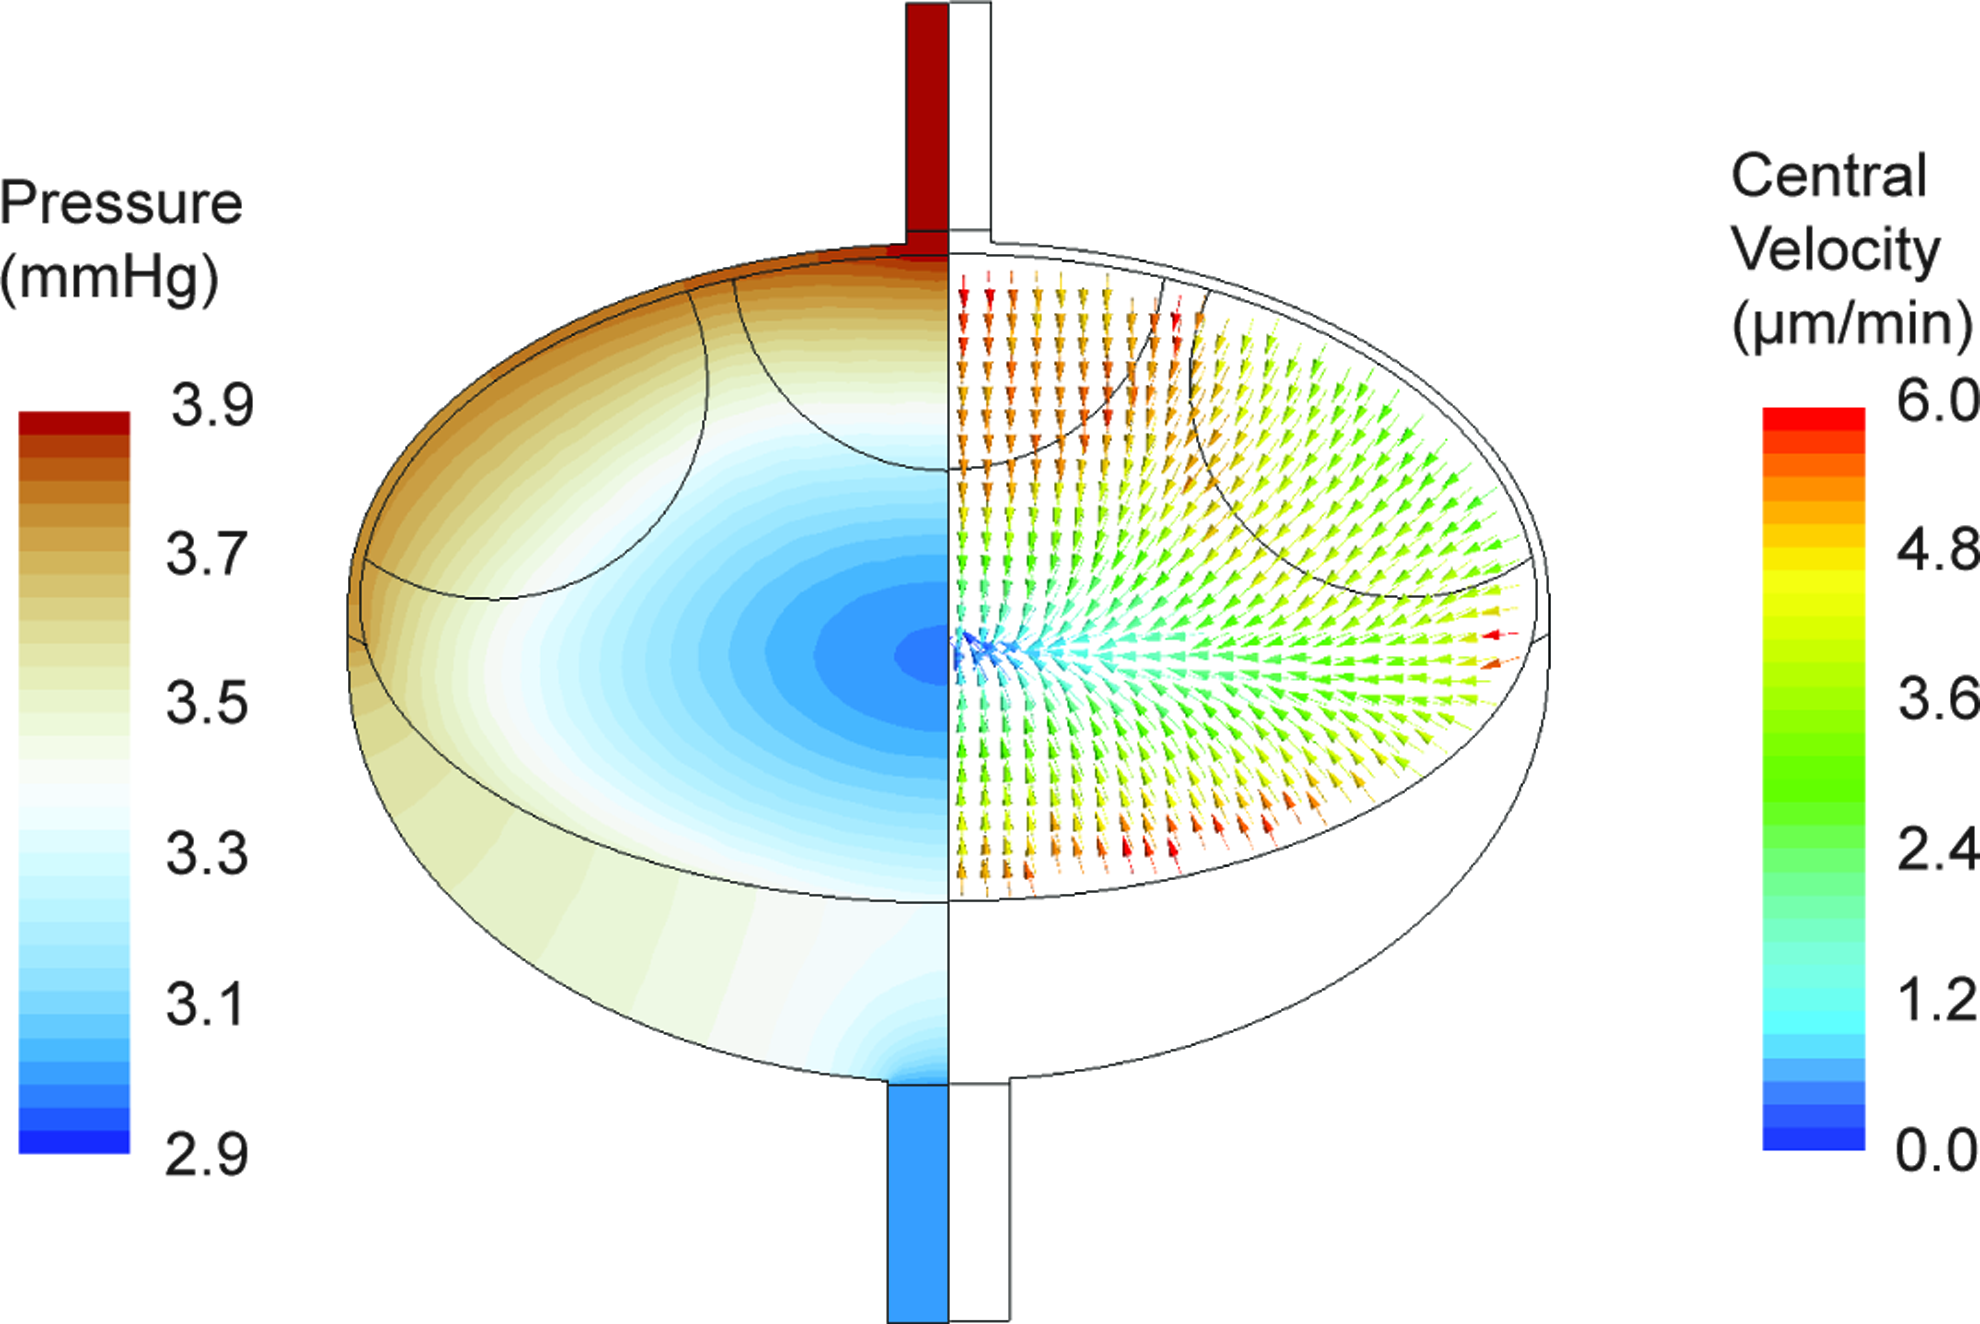
Pressure contours and lymph velocities. The left half of the lymph node is color coded for lymph pressure and indicates low pressures at the center of the node. The right half shows the velocity vectors in the central region that are color coded with the magnitude of the velocity. Fluid moves towards the low pressure region at the center with velocities that are three orders of magnitude smaller than the peripheral region. A color version of this figure is available in the online article at www.liebertpub.com/lrb.
Of the 9.7 nL/min absorbed by blood vessels, 4.0 nL/min flowed to the parenchyma directly from the SCS, and the rest was supplied by peripheral flow entering from the T cell cortex/medulla interface. While velocity vectors in the central regions (B cell follicles and T cell zone) of the LN illustrates that the lymph moves towards the low pressure region at the center (Fig. 4), the velocity magnitudes are approximately three orders of magnitude lower than those in the peripheral regions (SCS and MS, Fig. 3).
Shear stress in SCS
Velocity profiles across the SCS showed higher maximum velocities near the afferent vessel, where lymph enters the node, but although the profile stayed parabolic (expected in low Reynolds number regime), the maximum velocity decreased as the distance from the afferent vessel increased. The no-slip boundary condition imposes zero velocity on the impermeable ceiling of the SCS, but the boundary between the SCS and porous central zone results in non-zero velocities.
The wall shear stress contours demonstrate that the shear stress at the subcapsular sinus ceiling decreases with distance from the afferent vessel (Fig. 5A). In the baseline case, the shear stress gradually decreases from ∼6 dyn/cm2 close to the afferent vessel to ∼0.5 dyn/cm2 at the medulla. The shear stress at the ceiling was approximately 10% higher than that on the floor, due to the porous boundary there (Fig. 5B). Increasing the afferent flow rate resulted in proportionally higher overall shear stresses (Fig. 5B).

Shear stress contours in SCS and differences between shears on the SCS ceiling and floor.
Parameter sensitivity analysis
Surface area and blood vessel wall hydraulic conductivity
The amount of lymph transported from the lymph passages to the blood (QBV) is very sensitive to LA, and monotonically increases with this parameter (Fig. 6A). A sixteen-fold increase in LA resulted in elevation of fluid exchange from 7.4% to more than 70% of the afferent flow. In this case, the proportion of the flow coming from the SCS interface (“central” flow in Fig. 6A) versus that coming from the MS interface slightly decreased from 40% to 30%. The average pressure in the T cell cortex decreased to 30% of the baseline value when LA increased by sixteen-fold, whereas the afferent pressure showed a subtle decrease with the increase in LA (Fig. 6B). Decreasing LA below baseline had very little effect on flows and pressures.
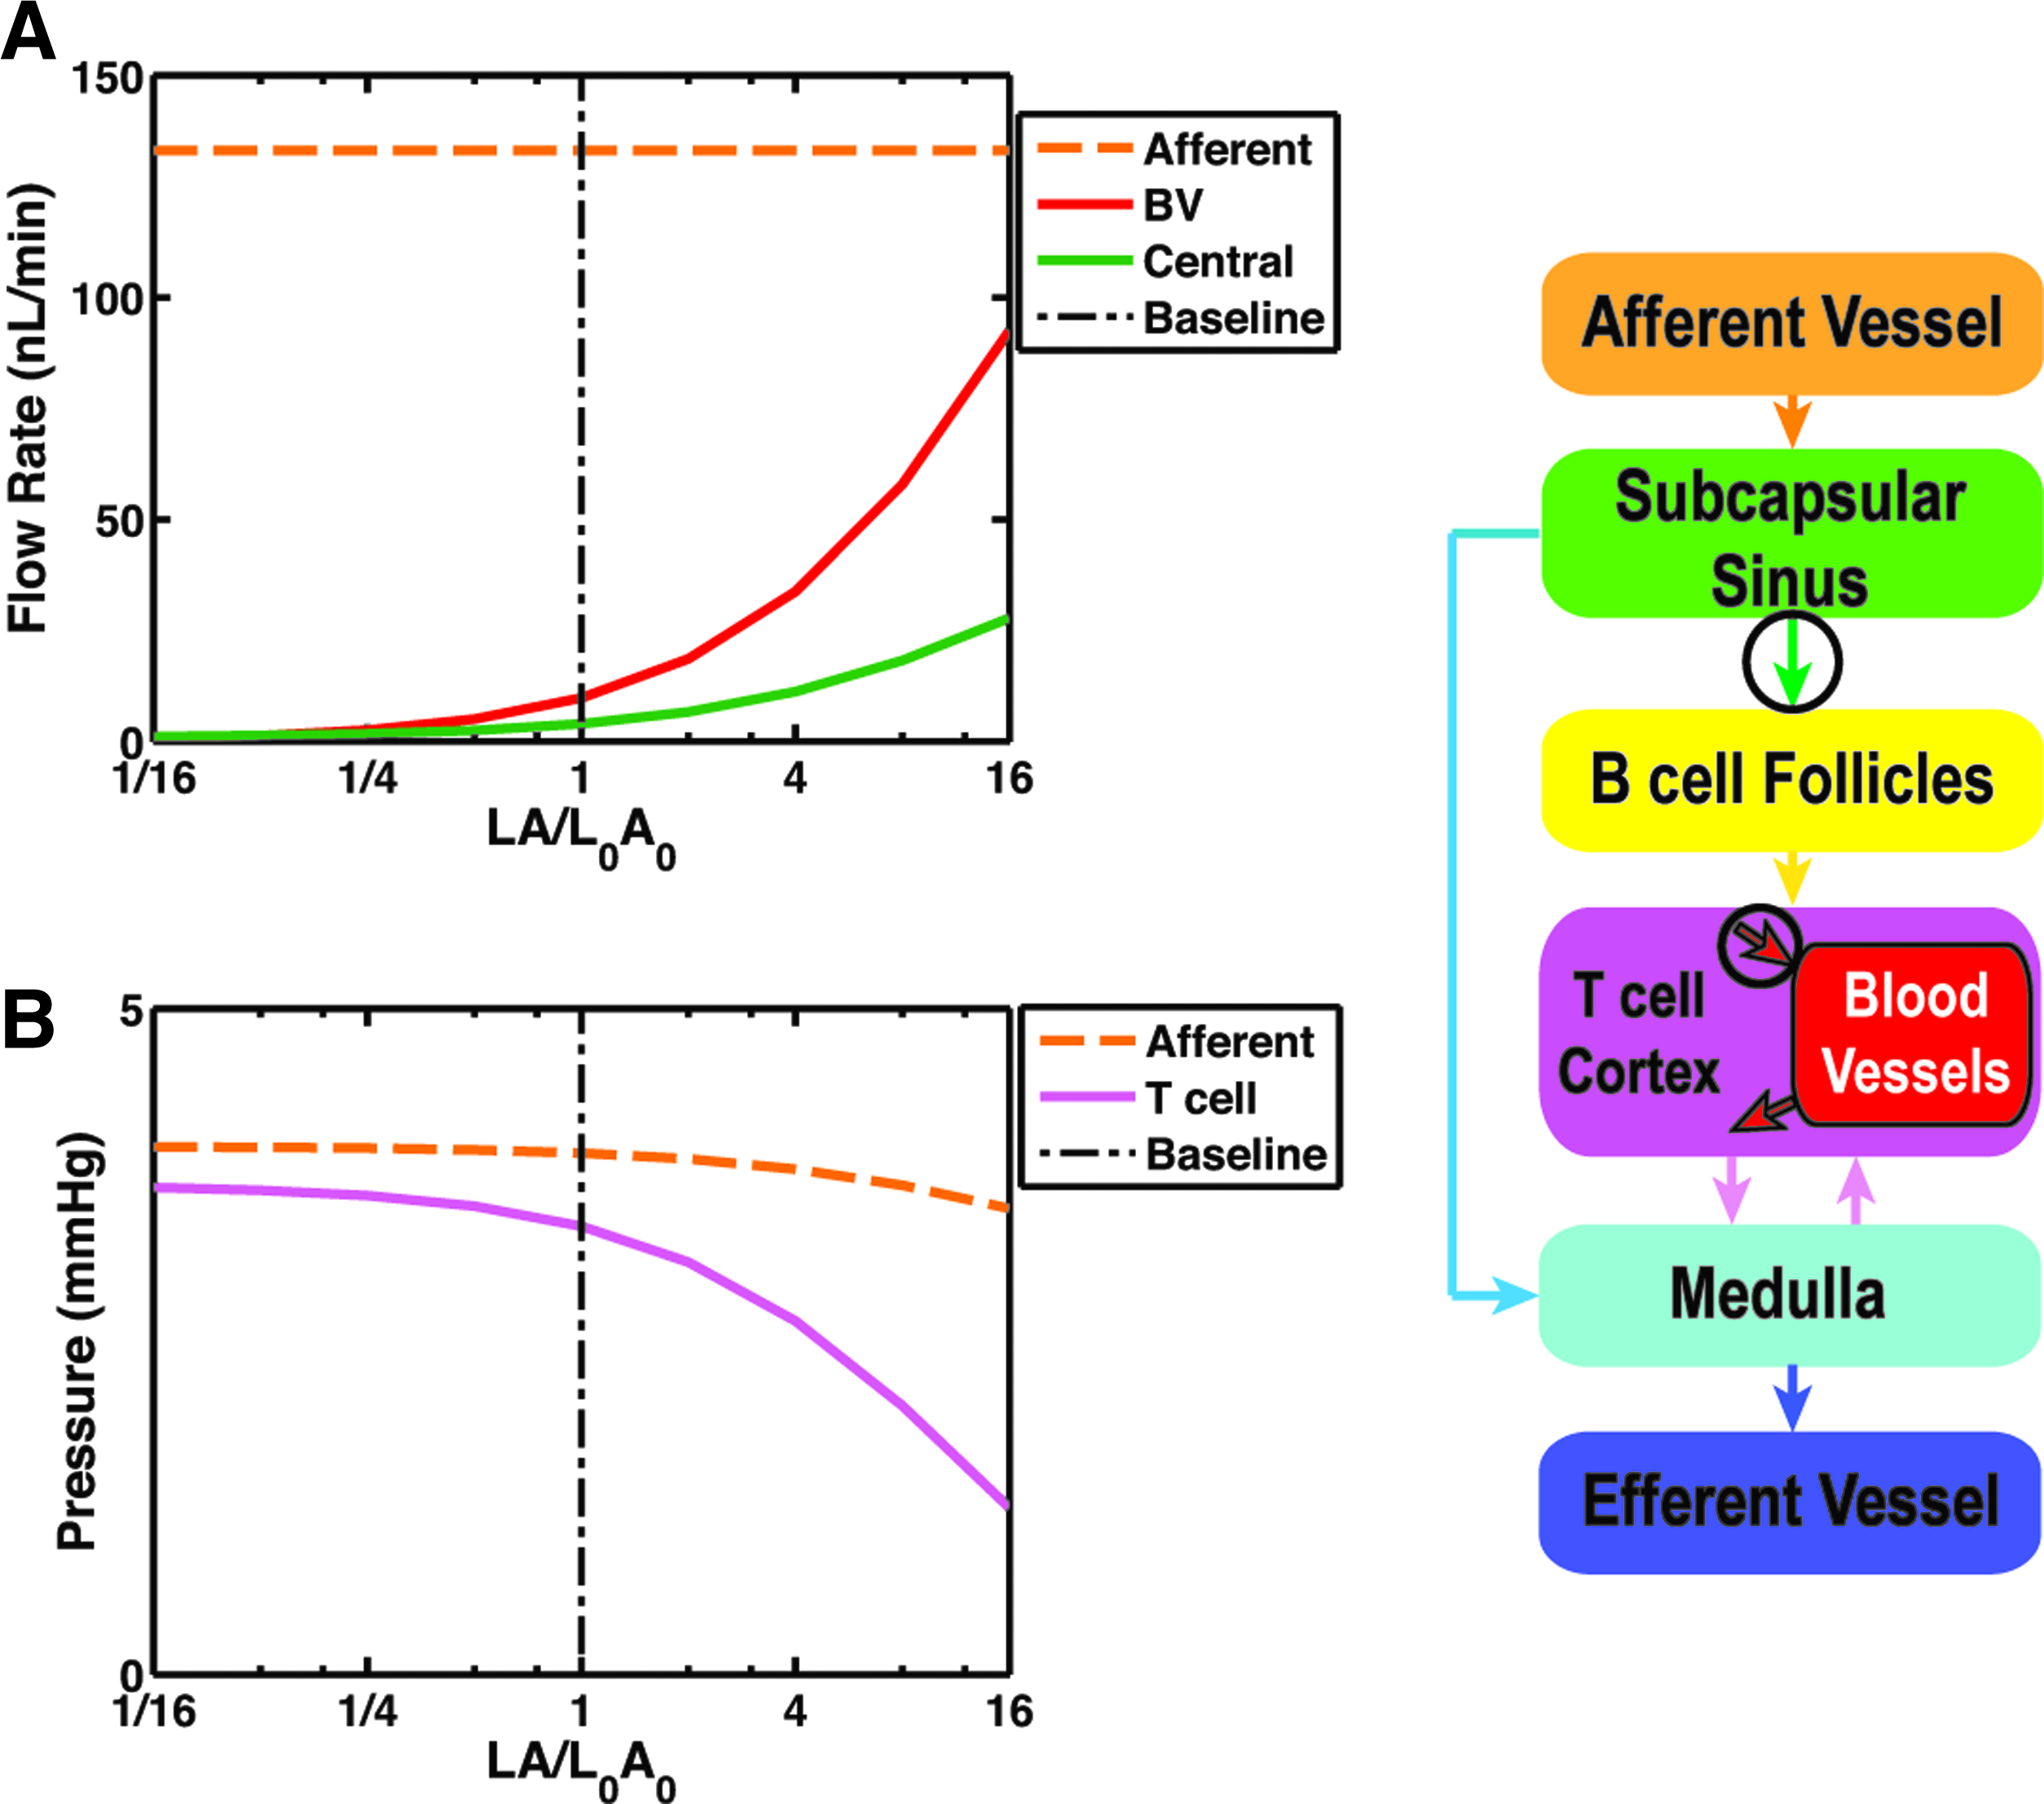
Parameter sensitivity analysis for surface area density and hydraulic conductivity of the blood vessels.
Hydraulic conductivity of the medulla
K medulla was a major determinant of the apparent resistance of the whole node (Fig. 7A). Due to the complex porous structure of the medulla (and lack of experimental data), we investigated the effects of varying K medulla over four orders of magnitude. Lower values of K medulla resulted in much higher apparent node flow resistance, and subsequently much higher inlet pressures were required to drive the specified flow rate. As an example, a decrease in K medulla two orders of magnitude from the baseline value increased the apparent resistance of the node from 6.8 to 285 mmHg/(μL/min), resulting in a predicted afferent pressure of 41 mmHg to just maintain the baseline lymph flow.
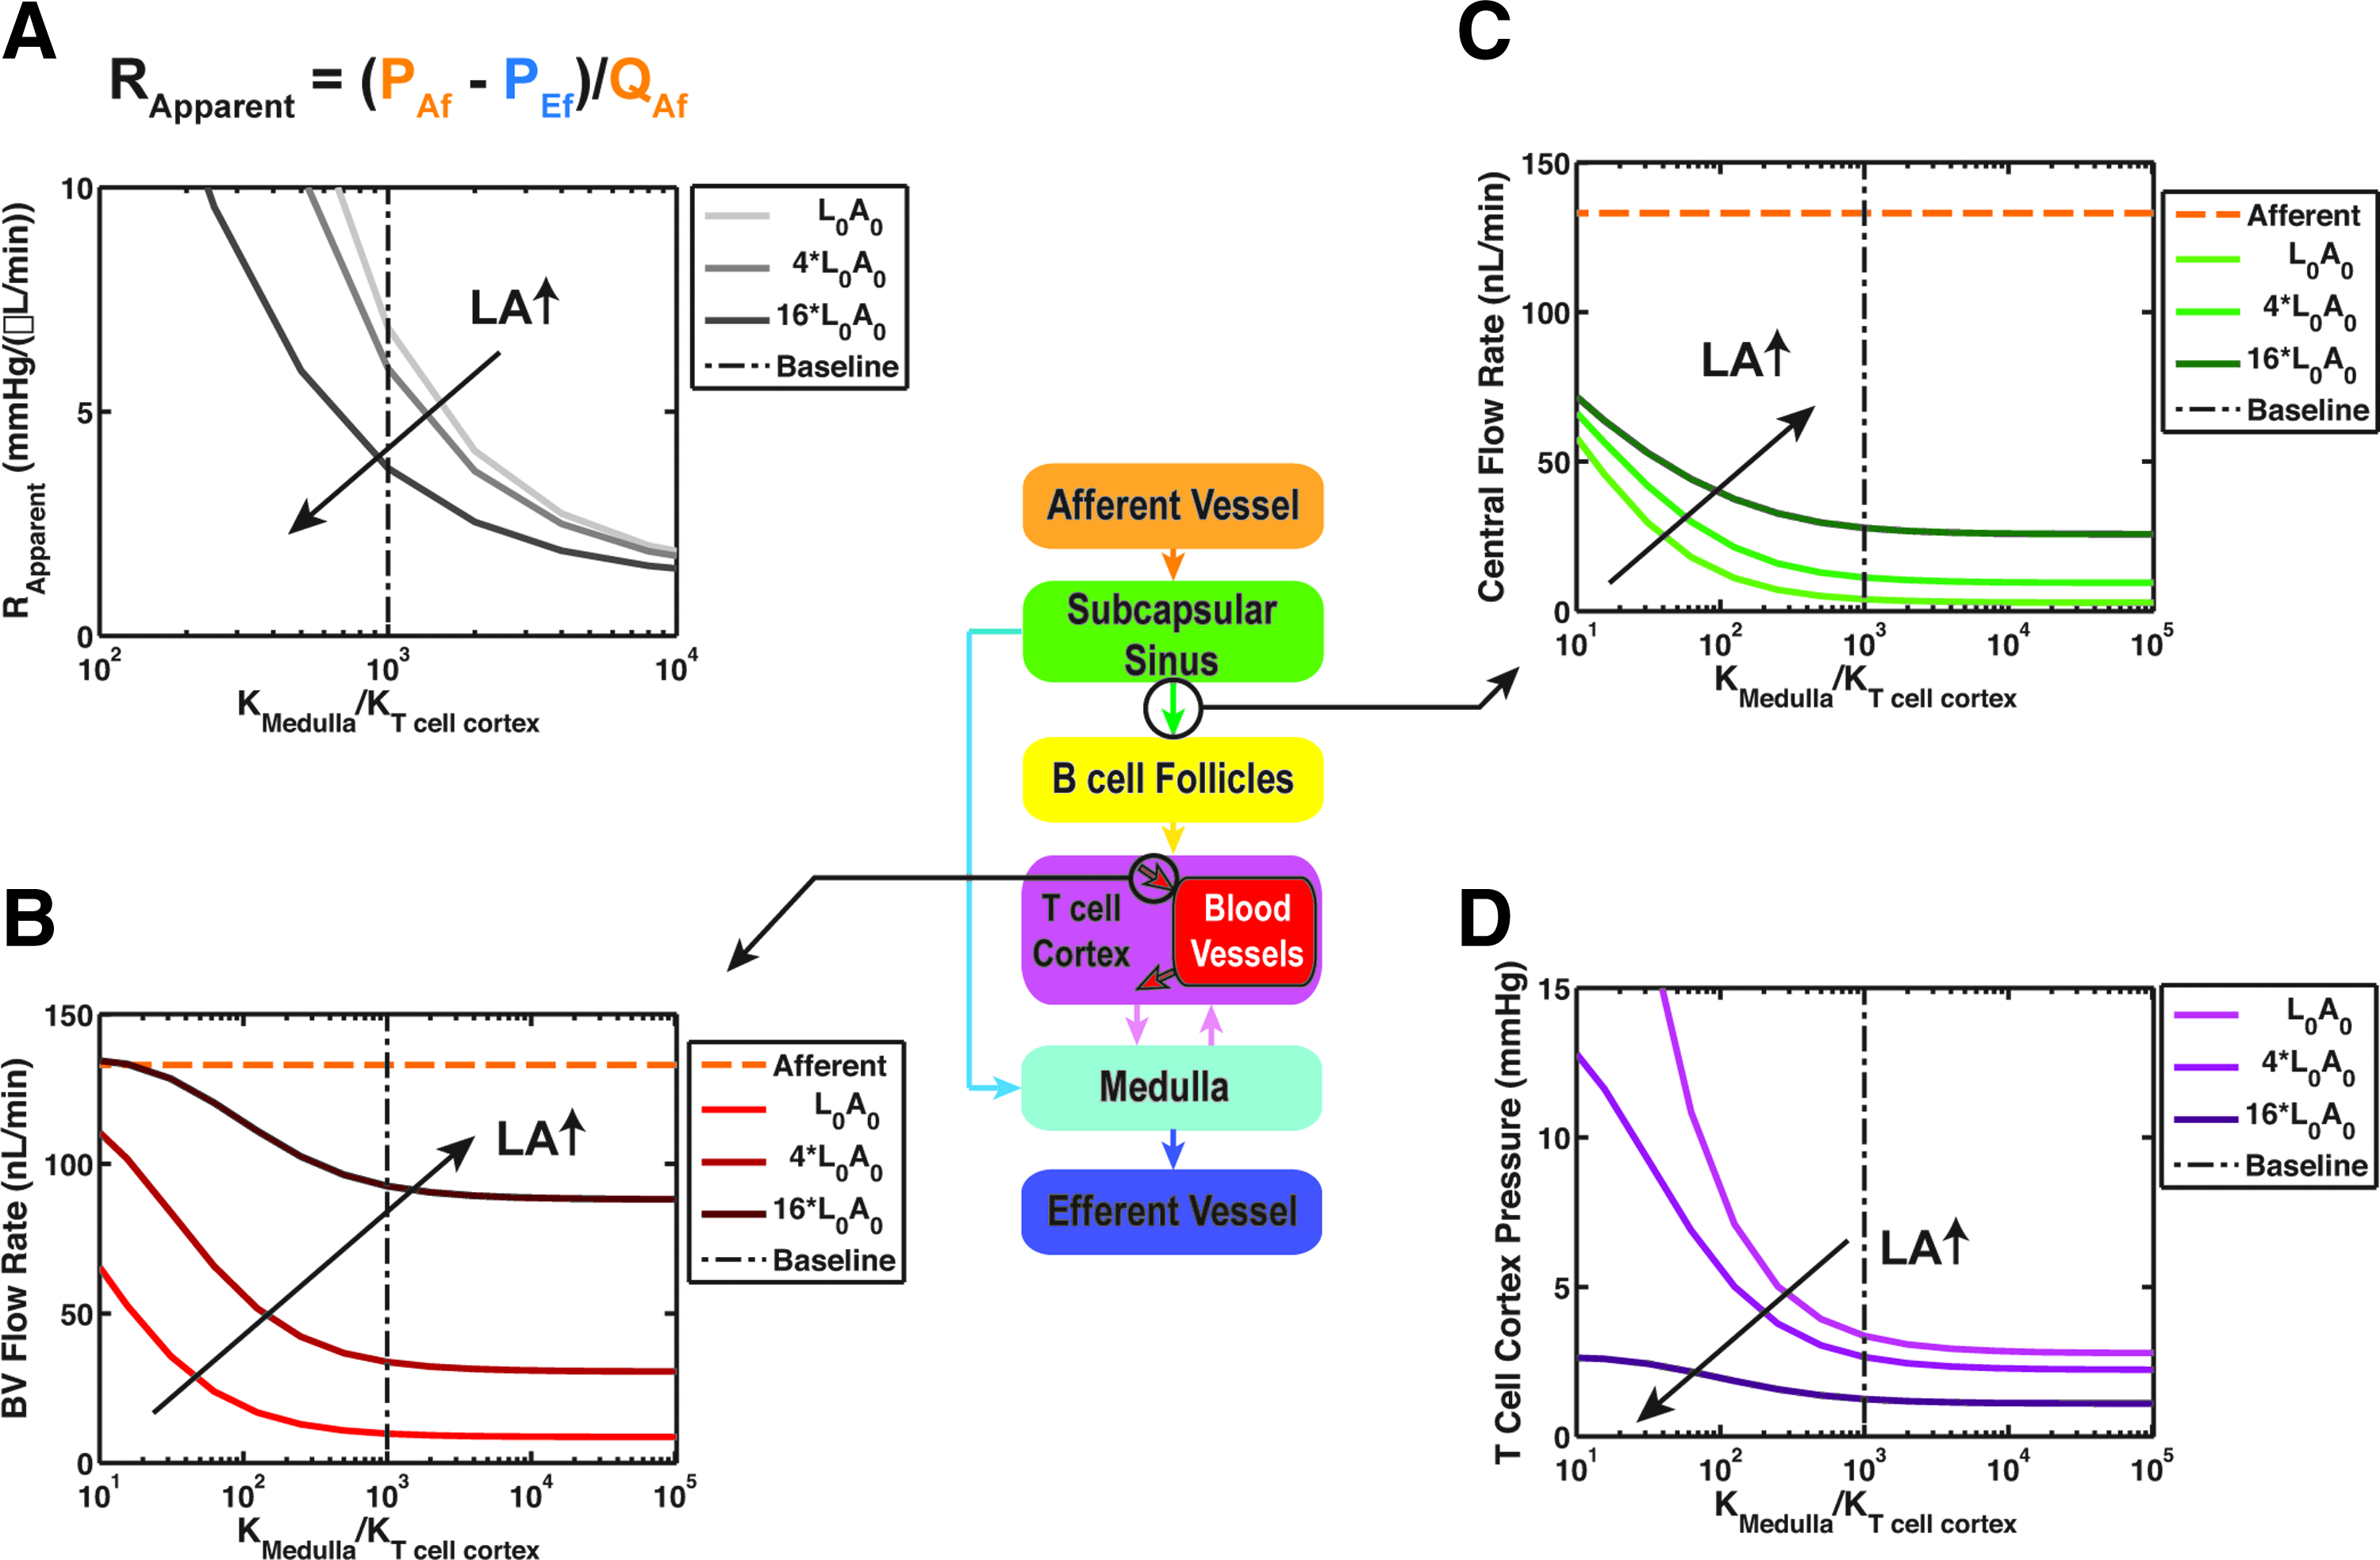
Parameter sensitivity analysis for hydraulic conductivity of medulla.
At high K medulla , most of the lymph passed through the peripheral lymph flow path with little to no dependence on K medulla (Fig. 7B). The effect changed at lower values of K medulla where the central flow increased (Fig. 7B); for instance, two orders of magnitude reduction in K medulla increased the central flow from 4 nL/min to more than 50 nL/min. At lower values of K medulla , QBV increased to as high as 44% of the afferent flow rate for Kmedulla/KT cell cortex of 0.1 for the baseline LA value (Fig. 7C). To understand this behavior better, we plotted the average lymph pressure in the T cell cortex, and showed that overall the pressure increases in the node when K medulla decreases (Fig. 7D). Changes in central flow and exchange flow were similar at higher LA values but with higher flow rates.
Blood pressure
The exchange flow between the lymphatic and blood vessels decreased quite linearly with the increase of PBV (Fig. 8A). At low PBV, QBV was positive, meaning that fluid was being transported from lymphatic channels to blood vessels. Increasing PBV lowered QBV, and eventually reversed the flow direction at PBV = 10.5 mmHg. A similar behavior with higher flows was observed with higher values for LA, but the pressure that QBV changed direction remained the same. Average pressure in the T cell cortex increased linearly with PBV; a pattern that remained the same for higher LA values, but with steeper pressure changes (Fig. 8B).
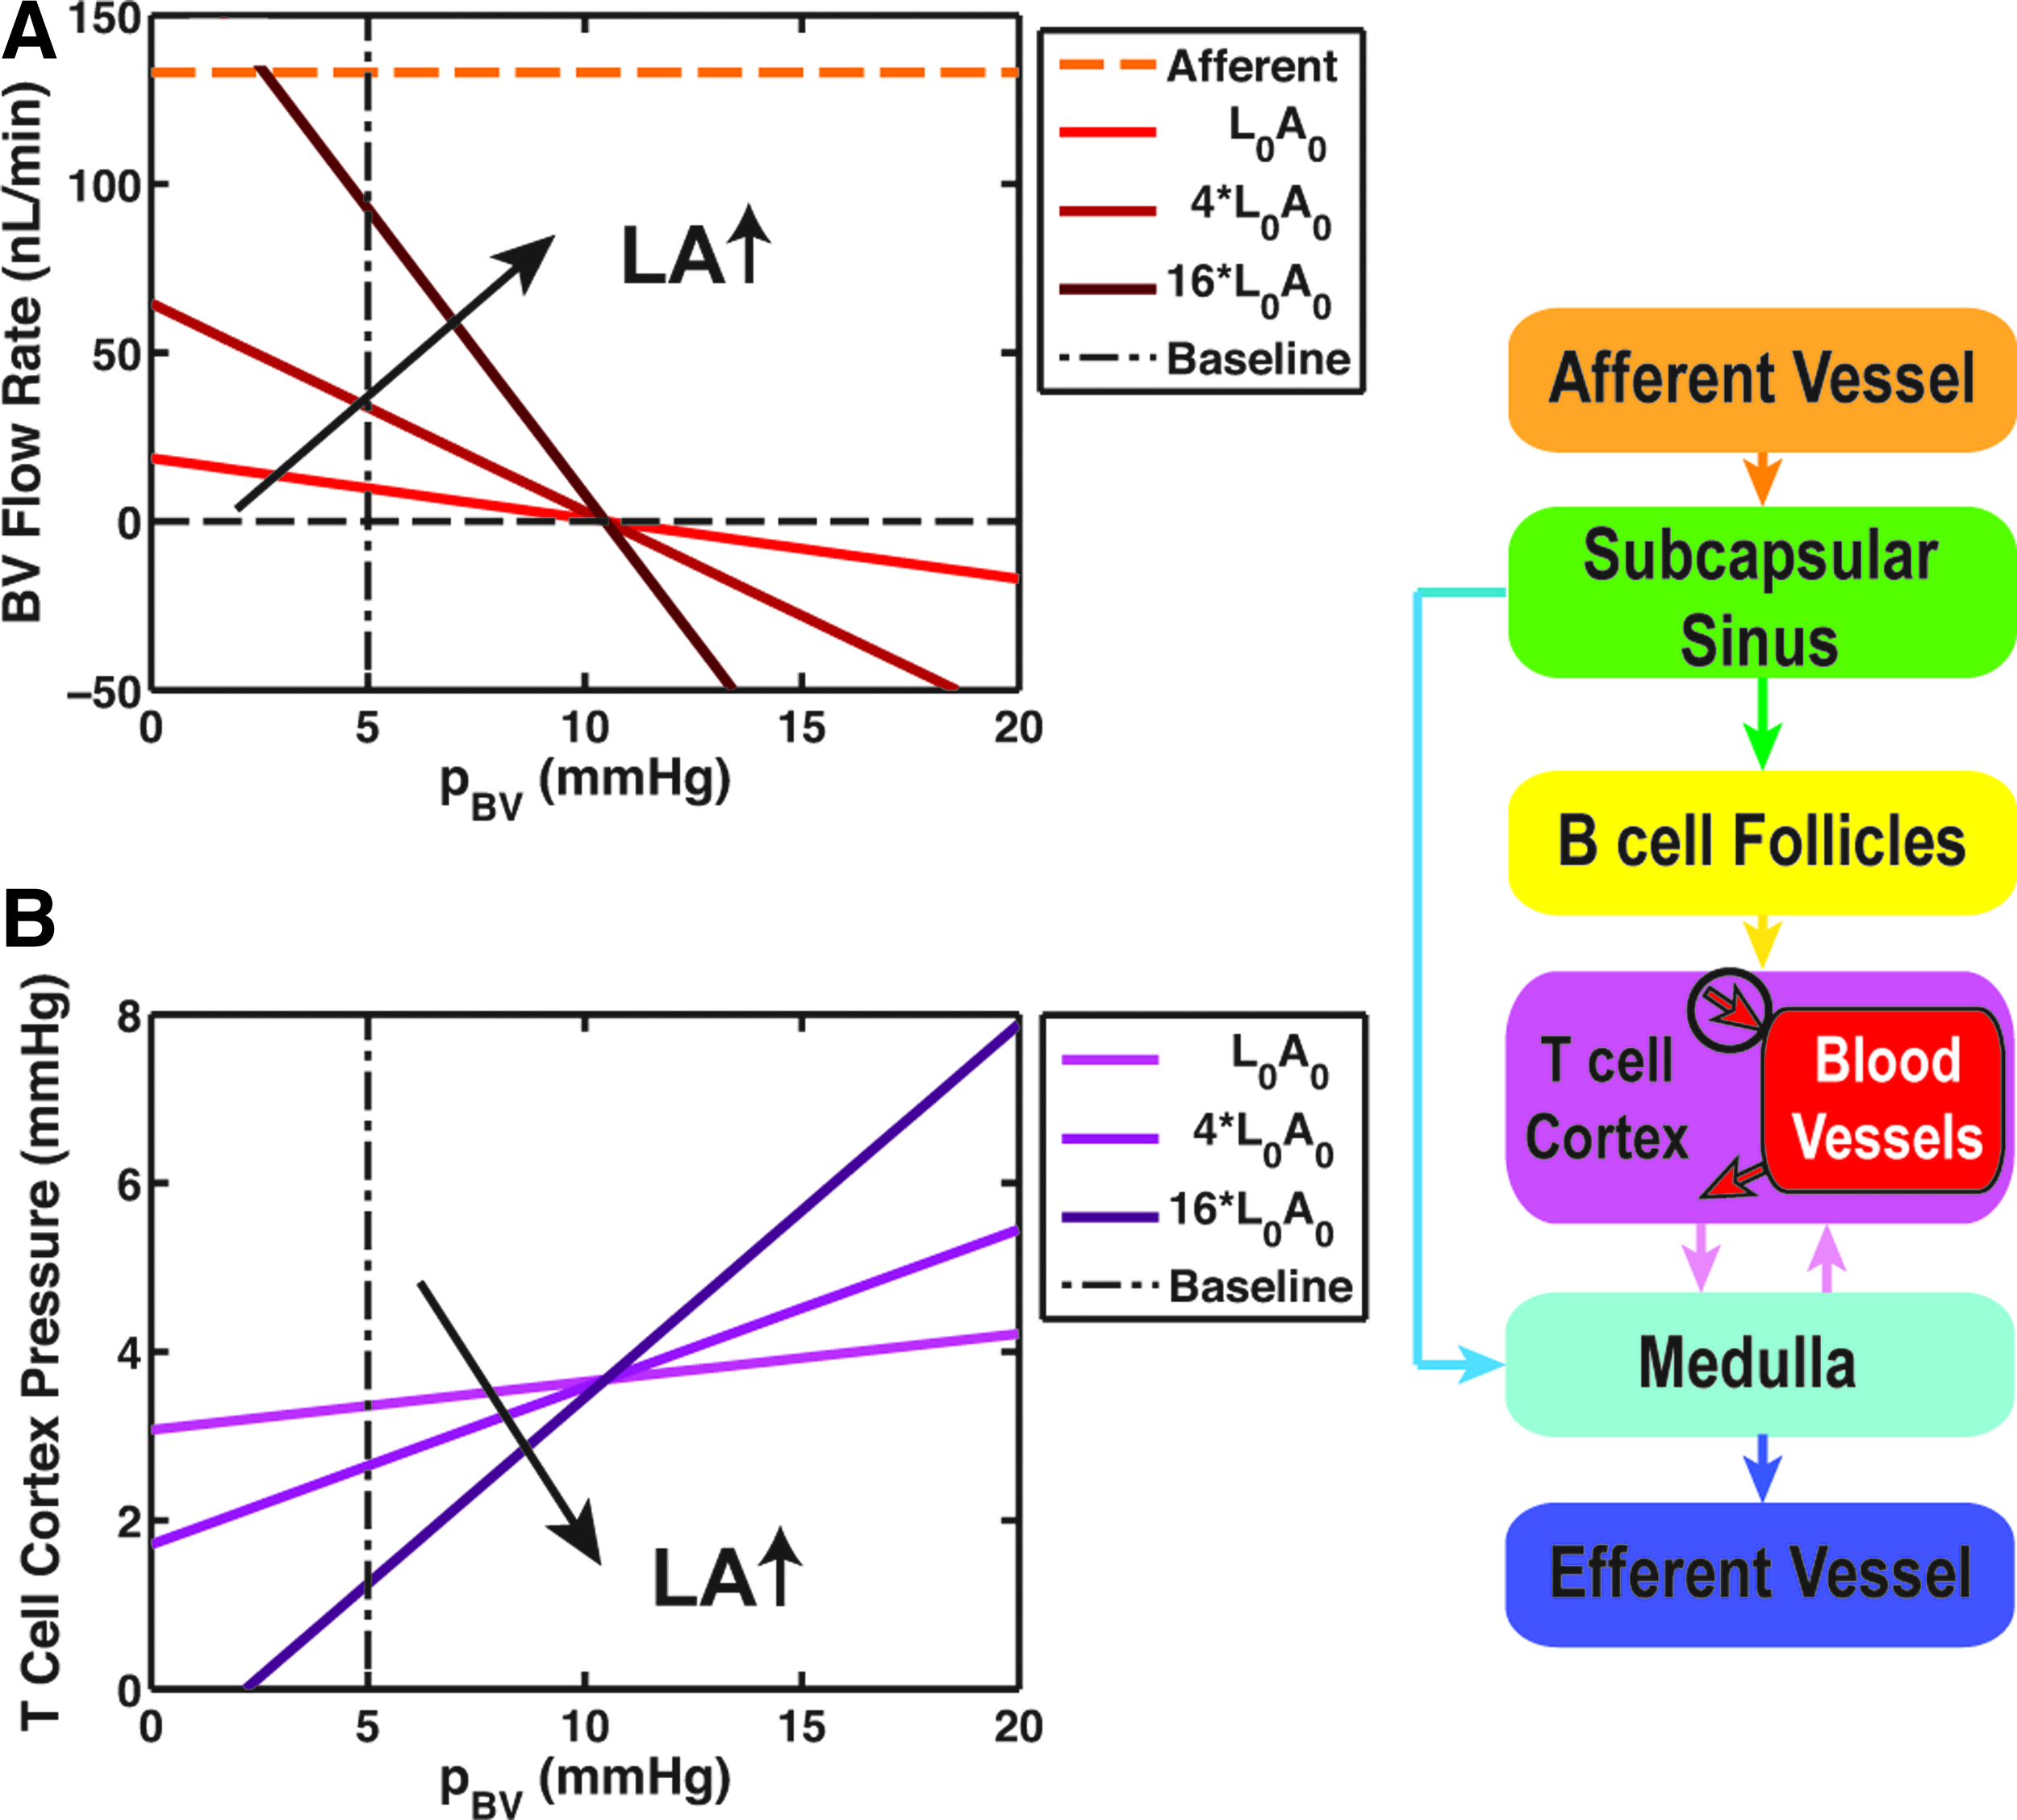
Parameter sensitivity analysis for average blood vessel pressure (PBV).
Efferent lymph pressure
QBV also showed a linear dependency on PEf over a wide range of pressures from 0 to 30 mmHg (Fig. 9A). QBV increased with PEf at a slope that was dependent on LA. For the baseline LA, QBV increased from 9.7 to 58.1 nL/min as PEf went from 3 to 30 mmHg. Steeper changes were observed for higher LA values. Moreover, pressure in T cell area increased with PEf, but higher LA values countered that effect (Fig. 9B).

Paramter sensitivity analysis for efferent pressure (PEf).
Conclusions
The aim of this study was to provide quantitative insight into lymph flow and pressure distributions in nodes. Because it is practically impossible to measure these quantities in vivo, we have constructed a model based on the available experimental data. Models of this nature provide the advantage of being able to vary parameters over wide ranges to investigate their effects on important physiological outcomes such as fluid exchange with the blood vessels, lymph pressures, and the overall resistance of the LNs. This not only helps to confirm the realistic nature of the model, but can also provide “brackets” around parameters that defy experimental investigation. Because of the relatively good availability of the morphometric data from our laboratories and others, we constructed our model with dimensions and main features of a mouse popliteal lymph node. This model is the first of its kind to the knowledge of the authors to investigate fluid transport in a whole lymph node.
A major finding is that typically about 90% of the afferent lymph flow is directed around the periphery through the SCS and MS, because this is the path of least resistance. Flow through the T cell region, therefore, depends on the gradual entry of lymph from both the SCS (either directly or via the B cell follicles) and the MS. In the SCS itself, the reduction in velocity with distance from the afferent vessel was due mostly to the increase in cross-sectional area moving down from the “pole” of the approximately spherical surface, and partly due to the inward fluid percolation through the SCS floor. The velocity profile maintains a parabolic shape along the SCS from the Af toward MS, which is because of the highly viscous nature of the flow (Reynolds number <1). The wall shear stresses we predict along the walls of the SCS are, interestingly, within an order of magnitude of those in prenodal collecting lymphatics that lead to the afferent lymphatics of the rat mesenteric node, 47 as well as those in larger blood vessels such as the aorta. 59
The predominance of flow around the periphery of the node raises the question of how the system is able to transport lymph-borne immune cells, antigens, etc. into the parenchymal zone where much of the immune processing takes place. While some advective transport is expected because of the relatively small amount of inward fluid movement, it is possible that other mechanisms, such as chemokine concentration gradients in the SCS, help in active migration of incoming cells toward the parenchyma.
The wall shear stress on the ceiling of the SCS (which decreases along with velocity moving toward the MS) likely modulates the production of not only chemokines by the LECs that line this surface, but also the expression of atypical chemokine receptors such as D6 and CCRL1 (LECs along the SCS floor do not express CCRL1).18,60 Ulvmar et al. demonstrated that CCRL1 is essential in maintenance of CCL19 and CCL21 gradients in the node, which are shown to be crucial for DC migration to LN parenchyma. 18 The link between shear stress and chemokine release and chemokine receptor expression on LECs in the nodes has not yet been addressed in any experimental work, nor in our model.
Our model demonstrated that under baseline conditions, some of the fluid flows from lymphatic passageways to blood vessels in LNs. Based on Starling's equation (Equation 3) and knowing that the protein concentration in the lymph is usually lower than blood, 51 oncotic pressures favor the movement of fluid from lymphatic to blood vessels. Experiments by Adair and Guyton on canine popliteal LNs showed that protein concentration of the lymph increases as it passes through LNs, mainly due to fluid transfer to the blood vessels. 24 Knox and Pflug had reported the same phenomena of fluid transport from lymph to blood and reported up to 50% of afferent fluid being absorbed in canine popliteal LNs, resulting in the protein rich-efferent flow. 61 This transport of fluid from lymph to blood has had little attention, however it is important in directing the fluid to the central regions of the nodes via conduits, and can potentially modulate the way LN respond to inflammation.
It is noteworthy that our model showed that blood vessel pressure is the only parameter that can change the direction of the exchange flow, with the other parameters affecting only the amount of flow. This change in the direction of flow with increasing blood pressure has been previously observed experimentally by Adair and Guyton in canine popliteal LNs 24 (Fig. 10A). They observed consistently that with the increase in the venous pressure, the efferent lymph protein concentration decreased while the mass flow rate of the proteins stayed constant. 24

Comparison to experimental data from Adair and Guyton.24,33
Our model demonstrated that the magnitude of the exchange flow is determined by surface area and hydraulic conductivity of blood vessel wall (LA), and predicted that a moderate level of increase in this combined parameter has a profound effect on fluid balance. Increases in LA could come from an increase in blood vessel wall hydraulic conductivity or increased blood vessel surface area (from either vasodilation or blood vessel network expansion), any of which could occur as part of immune response. In these cases, such actions would increase the amount of fluid bathing the follicles and cortex through the central path to the blood vessels and the HEV.
Experiments by Kumar et al. showed that blood vessel surface area increases after immunization and induced viral infection.62,63 Furthermore, changes in lymph oncotic pressure or σ would have a similar effect as variations in blood vessel pressure, as the oncotic pressure driving term is linearly added in Starling's equation. In other words, if the protein concentration of the lymph increases during inflammation as it commonly does because of the increase in blood microvessel permeability seen with inflammations (i.e., such as seen with histamine), it would have a similar effect as an increase in blood pressure, and hence will decrease the lymph/blood exchange flow and encourage the change in the direction of this flow (Fig. 8A).
A limitation to constructing our model was the lack of information on the porosity of the MS. However, we have demonstrated that hydraulic conductivity (inverse of resistance) of the medulla should be at least three orders of magnitude higher than that in the T cell region to avoid unphysiologically high fluid pressures in the node. Decreasing K medulla increases the central flow in the LNs. The effect of local hydraulic conductivity changes on nodal flow distributions has not yet been experimentally estimated, to the knowledge of the authors.
Enhanced immune cell trafficking through the node during inflammation might result in restricted passageways for the lymph flow through the medulla, further modulating the flow distribution. This would favor the fluid movement through central path and would result in higher pressures in the afferent vessel and parenchyma. Based on Starling's equation, higher overall pressures in the node would increase the pressure difference and hence boost fluid exchange to blood vessels. There is experimental evidence that inflammation can increase LN resistance. Nagai et al. measured the resistance of rabbit popliteal LNs to be 0.38 mmHg/(μL/min) and it was increased to 1.01 mmHg/(μL/min) after induced acute inflammation by formyl-Met-Leu-Phe-OH known to activate polymorphonuclear leukocytes. 64 Because resistance is dependent on the size of the system and our model is based on mouse popliteal LN, no direct comparisons can be made about the resistances.
Lymph velocities were lower in the central regions of the node compared to the peripheral path. The velocities were in the order of 1–10 μm/min in the T cell cortex, for the baseline case (Fig. 3), and scales with the amount of QBV for different cases of parameter sensitivity analysis. This velocity range is close to the estimated velocities used in the literature; for instance Tomei et al. used similar fluid velocities of 1, 10, and 23 μm/min in 3D cultures of FRCs to investigate the effect of shear stress on these essential stromal cells of LNs. 65 They have demonstrated that the resulting shear stresses induce upregulation of CCL21 in cultured FRCs in 3D matrix. Furthermore, the velocity vectors in this study revealed that under the assumed baseline condition, fluid should move from the medulla towards T cell cortex (Fig. 4).
This suggests that the direction of lymph flow in the deep blunt-ended cortical sinuses in the node is towards the cortex. S1P1 signaling is shown to regulate T cell egress through cortical sinuses, some of which are blunt-ended. 66 Therefore, the intuitive concept that lymph should always move towards the efferent lymphatic is not necessarily correct everywhere in the node. In the cortical sinuses that connect SCS to MS, the lymph flows from the higher pressure SCS to lower pressure MS. However, for the blunt-ended sinuses, the closed end is connected to lower pressure parenchyma resulted from oncotic pressure differences, which can deliver the fluid towards the T cell cortex and blood vessels in this region.
The lymph pressures in the node are directly modulated by the afferent and efferent pressures as the boundary conditions. In the basal condition, our model showed the pressure in the node to be in the range of 2.9–3.9 mmHg. Bouta et al. made in situ measurement of pressure in mouse popliteal LNs and found it to be 6.86 ± 0.56 cmH2O (5.04 ± 0.41 mmHg) for WT mouse. 67 The efferent lymph pressure was not measured in those experiments, so direct comparison with this study is not possible.
Increasing efferent lymph pressure increased the fluid exchange from lymph to blood vessels due to increased overall pressures in the LN (Fig. 9B). This behavior is similar to that observed experimentally by Adair and Guyton in canine popliteal LNs 33 (Fig. 10B). They observed an increase in the fluid exchange from lymph to blood up to pressures of about 8 mmHg. Further increase in the efferent pressure resulted in the leakage of the dye from the node capsule.
Additionally, in serially connected nodes, changes in a downstream node resistance provoked by infection and/or inflammation could result in a dramatic increase in the efferent pressure of the upstream LNs. Basal levels of fluid exchange do seem to be dependent on the anatomical location of the node and its resulting position in the resistance network. Popliteal and renal LNs are shown to have higher fluid exchange rates compared to hepatic LNs in sheep and greyhounds.58,68
Due to the complexity of the structure and lack of experimentally measured properties of LNs, computational modeling of the lymph flow is challenging. Parameter sensitivity analysis helps to reveal the relative importance of parameters that have yet to be measured accurately, or cannot be measured. Our analysis showed that the surface area of the blood vessels in the node is a crucial parameter determining the amount of fluid exchanged by blood vessels. Although there are quantitative measurements of the total length and average diameter of the HEVs (only a portion of the total surface area available for fluid transport) in the healthy and infected nodes, 62 the total surface area of the blood vessels including capillaries has not been measured.
The present model assumes a uniform pressure in the blood vessels throughout the LN. In fact the blood pressure in the vessels drops by typically >10 mmHg moving from the arterioles to the capillaries and then venules. Inclusion of the variable blood pressure distribution requires better characterization of diameter, length, and location of all blood vessels in LNs. Hydraulic conductivity and permeability of the porous regions of the node (e.g., B cell follicles, T cell cortex, and medulla) are other parameters of the system that need experimental measurements.
Most LNs in the body have multiple afferent vessels. Comparison with models including several afferent vessels (not shown here) confirms that the major flow features are not greatly affected. The main parameter that is affected by the multiple afferent vessels is the local wall shear stress patterns in the SCS. In addition to the limitations discussed so far, the present model assumes that the B cell follicles and T cell cortex are homogenous and isotropic materials meaning there is no directionality in the uniform structures. Addition of the conduit system of the lymph node to the model is crucial as the next step to investigate the antigen and chemokine transport in LNs.12,29 Moreover, Ushiki et al. had shown that the conduit structure near the capsule is generally directed towards the center of the node. 69
In a very recent study by Rantakari et al., the main mechanism for size exclusion in the conduits of the LN was shown to be the formation of a diaphragm on the fenestrae and caveolae of lymphatic endothelial cells by the PLVAP molecule. Addition of the conduit system is essential for modeling of the antigen and protein transport in the LN. 70 However, quantitative experimental data are necessary to be able to include the anisotropic and heterogeneous effects of conduit system of the node.
Overall, this work aims to establish a model of fluid flow in healthy LN. Further progression of this model is needed to investigate pathologic conditions such as inflammation and infections in which the size of the LN changes dramatically. 62 In addition to the size change, Tan et al. demonstrated that initially subcapsular sinuses and later medullary sinuses expand as a result of prolonged inflammation by VEGF-A mediated lymphangiogenesis. 71 Based on the results on this study, any change in the hydraulic conductivity of the sinuses (which can be caused by lymphangiogenesis) could modulate the amount of lymph going through central versus peripheral paths in the LN. Furthermore, comprehensive experimental data on the structure of human LNs would be essential to translate the results of this study to human nodes.
In summary, we have constructed the first computational fluid dynamics model of lymph flow in nodes, using a geometry based on mouse popliteal LNs. Our model showed that most of the afferent lymph flows through peripheral paths of the LNs in high velocities (mm/min), while smaller portion of the fluid slowly (μm/min) percolates through follicles and cortex. We performed parameter sensitivity analysis and identified that surface area of the blood vessels in the node is an important parameter of the system that needs to be accurately measured.
Our model supports the concept that the direction of the exchange flow with blood vessels can be changed depending on the hydrodynamic conditions in the node, notably blood pressure and oncotic pressures, which can play a role in the function of the LNs during infection and chronic inflammation. Furthermore, changes in the resistance of MS can result in the diversion of the lymph to cortical regions of the node. It is crucial to know how immune response, vaccination, and remodeling of the lymph node will change the lymph flow and hence antigen, cytokine, chemokine, and immune cell transport to different parts of the LNs.
Footnotes
Acknowledgments
The authors would like to acknowledge NIH Grant Nos. R01 HL094269, HL096552, HL070308, AI039246-19 and U01 HL123420-01 for funding this project. Moore wishes to acknowledge the support of The Royal Society, The Royal Academy of Engineering, and The Sir Leon Bagrit Trust.
Author Disclosure Statement
No competing financial interests exist.