
Abstract
Abstract
Background:
Breast cancer treatment-related lymphedema (BCRL) arises from a mechanical insufficiency following cancer therapies. Early BCRL detection and personalized intervention require an improved understanding of the physiological processes that initiate lymphatic impairment. Here, internal magnetic resonance imaging (MRI) measures of the tissue microenvironment were paired with clinical measures of tissue structure to test fundamental hypotheses regarding structural tissue and muscle changes after the commonly used therapeutic intervention of manual lymphatic drainage (MLD).
Methods and Results:
Measurements to identify lymphatic dysfunction in healthy volunteers (n = 29) and patients with BCRL (n = 16) consisted of (1) limb volume, tissue dielectric constant, and bioelectrical impedance (i.e., non-MRI measures); (2) qualitative 3 Tesla diffusion-weighted, T1-weighted and T2-weighted MRI; and (3) quantitative multi-echo T2 MRI of the axilla. Measurements were repeated in patients immediately following MLD. Normative control and BCRL T2 values were quantified and a signed Wilcoxon Rank-Sum test was applied (significance: two-sided p < 0.05). Non-MRI measures yielded significant capacity for discriminating between arms with versus without clinical signs of BCRL, yet yielded no change in response to MLD. Alternatively, a significant increase in deep tissue T2 on the involved (pre T2 = 0.0371 ± 0.003 seconds; post T2 = 0.0389 ± 0.003; p = 0.029) and contralateral (pre T2 = 0.0365 ± 0.002; post T2 = 0.0395 ± 0.002; p < 0.01) arms was observed. Trends for larger T2 increases on the involved side after MLD in patients with stage 2 BCRL relative to earlier stages 0 and 1 BCRL were observed, consistent with tissue composition changes in later stages of BCRL manifesting as breakdown of fibrotic tissue after MLD in the involved arm. Contrast consistent with relocation of fluid to the contralateral quadrant was observed in all stages.
Conclusion:
Quantitative deep tissue T2 MRI values yielded significant changes following MLD treatment, whereas non-MRI measurements did not vary. These findings highlight that internal imaging measures of tissue composition may be useful for evaluating how current and emerging therapies impact tissue function.
Introduction
B
Complete decongestive therapy (CDT) is the clinical standard of care for lymphedema management and is comprised of four main components: (1) compression, (2) manual lymphatic drainage (MLD), (3) skin care, and (4) lymphatic flow exercises. Primarily quantified using limb volumetric assessment, MLD has been reported to have variable impact on outcomes. 2 For this reason, MLD effectiveness remains controversial as a component of CDT, resulting in uncertainty of best clinical practice for lymphedema management.
MLD has been hypothesized to temporarily (1) stimulate lymphatic fluid movement, (2) manually enhance absorption of larger interstitial proteins, and (3) redirect the lymphatic load to an uninvolved adjacent quadrant, thereby reversing or slowing condition progression and minimizing infection risk by improving tissue health. The critical barrier to evaluating MLD efficacy, along with the value of emerging lymphedema therapies and risk prevention strategies generally, is that there is a lack of internal biomarkers of lymphatic function that may serve as study end points in clinical trials of therapy impact.
Quantitative magnetic resonance imaging (MRI) measures are routinely used for evaluating treatment responses to a range of disorders, however, MRI methods capable of quantitatively evaluating tissue changes in response to lymphatic dysfunction have not yet been incorporated into condition management. Recently, efforts have focused on translating MRI approaches used for measuring circulatory dynamics in brain, breast, and liver to the lymphatic system to characterize lymph node structure3,4 and also to generate sensitive internal markers of functional tissue changes in response to lymphatic therapy.5,6
We extend this work to evaluate hypothesized changes in tissue water relaxation time (T2), a well-known MRI biomarker of tissue composition, edema, and fibrosis, 7 in healthy controls and patients with BCRL. The overreaching hypothesis is that in early stage BCRL (e.g., stages 0 and 1) before fibrosis is evident, tissue T2 in the affected arm reduces immediately following MLD due primarily to relocation of lymphatic fluid from the affected arm to the contralateral arm. In a more advanced stage (e.g., stage 2), T2 increases immediately after MLD in tissue of the involved arm due to a breakdown in fibrotic tissue and this effect outweighs the smaller reduction in T2 due to lymphatic fluid relocation. In all stages, T2 increases in the contralateral arm due to relocation of lymphatic fluid.
Quantitative T2 measurements are paired with conventional measures of limb volume (perometry) and MRI structural fat and water imaging, and emerging measurements of bioelectrical impedance spectroscopy (BIS), and tissue dielectric constant (TDC) with the immediate goal of understanding whether quantitative MRI provides added discriminatory capacity relative to structural MRI and these non-MRI measures for determining MLD therapy efficacy and treatment optimization.
The long-term goal is to develop methodologies for accurately recording structural and functional observables of lymphatic compromise, which can serve as trial end points for future rigorous clinical trials of lymphatic dysfunction and more precise lymphedema prevention and management interventions. These methodologies would potentially extend beyond BCRL and have relevance for other conditions resulting in lymphatic dysfunction, including lipedema and adipose disorders. 8
Methods
Volunteer demographics and enrollment
All volunteers provided informed, written consent in accordance with the Vanderbilt University Institutional Review Board. Volunteers (n = 45; Table 1) were enrolled as part of the prospective Imaging Noninvasively with Functional-MRI for Onset, Response, and Management of Lymphatic Impairment (INFORMLI) trial (ClinicalTrials.gov Identifier: NCT02611557).
These non-MRI and quantitative T2 measurements in patients represent baseline values (i.e., before MLD intervention).
BMI, body mass index; MLD, manual lymphatic drainage; MRI, magnetic resonance imaging; NA, not applicable; SD, standard deviation; TDC, tissue dielectric constant.
Healthy, right-handed female volunteers with no history of BCRL or lymphatic impairment (n = 29; age = 41.2 ± 14.8 years; age range = 23–74 years) were first evaluated to understand the normal range of the MRI index across different age ranges. The age range of healthy controls was extended relative to the BCRL range to understand a possible age dependence of the MRI measures and provide a reference for future studies. A subset of these healthy volunteers (n = 18; age = 51.1 ± 10.5 years; range = 37–74 years) were age-matched to patients with BCRL (stages 0–2; n = 16; age = 53.5 ± 10.0 years; range = 33–77 years). An additional subset of healthy controls provided repeat measurements at a different time point for reproducibility assessment (n = 6; age = 40.2 ± 17.8 years; range = 23–73 years).
Non-MRI measurements
Non-MRI measurements included height, weight, blood pressure (Invivo, Gainesville, FL, USA), arm volume (mL; Perometer 400NT; Pero-System, Wuppertal, Germany), TDC (MoistureMeterD; Delfin, Kuopio, Finland) and BIS (L-Dex® U400; ImpediMed, Carlsbad, CA, USA). Bilateral arm volumes were acquired using the Perometer optoelectronic device.9,10 The total limb volume is estimated (mL) using optoelectronic infrared sensors inside a 47 × 47 cm frame every 4.7 mm.
Bilateral TDC measurements were incorporated to measure percent water content and its changes in the tissue at a depth of 1.5–2.5 mm. 11 The TDC measurement was repeated three times in four locations: (1) midline medial distal radioulnar joint, (2) elbow immediately anterior to medial epicondyle, (3) 4.5 cm centrally distal to axillary fold (inner upper arm), and (4) 4.5 cm centrally proximal to axillary fold (lateral upper quadrant). To compare more locally with the MRI measurements, the inner upper arm measurement was used in this study, which also colocalized with edema in all patients with BCRL stages 1 and 2.
BIS was administered to measure the impedance of each arm, which scales with the extracellular fluid content of the arm. 12 The L-Dex ratio is reported as a standardized measure of the ratio of the impedance of extracellular water in the affected limb compared to the unaffected limb. 13
Qualitative and quantitative MRI measures of tissue structure
MRI measurements were performed at 3 Tesla (Philips Medical Systems, Best, The Netherlands) using dual-channel body coil radiofrequency transmission and a 16-channel torso coil for reception. The qualitative structural MRI protocol was optimized in prior work 14 and consisted of custom diffusion-weighted-inversion-with-background-suppression imaging for large axillary node identification (spatial resolution =3 × 3 × 5 mm; b-value = 800 s/mm2; TR/TE/TI = 7528/54/260 ms), T1-weighted multipoint DIXON (mDIXON) for tissue and node structure (3D-gradient-echo; TR = 3.4 ms; spatial resolution = 1.0 × 0.74 × 2.5 mm), high-spatial resolution fat-suppressed T2-weighted MRI for node structure visualization (turbo-spin-echo; TR = 3500 ms; TE = 60 ms; spatial resolution = 0.4 × 0.5 × 5 mm).
For quantitative T2 measurements, a multi-echo turbo-spin-echo was applied (turbo-spin-echo; echoes = 16; range = 9–189 ms; increment = 12 ms; spatial resolution = 1.8 × 1.5 × 5 mm). Additionally, B1 field maps (3D-gradient-echo, TE/TR1/TR2 = 2.3/30/130 ms, spatial resolution = 1.8 × 1.5 × 5 mm) were obtained to ensure adequate transmit radiofrequency performance, defined as obtained B1 ≥ 75% of prescribed B1, in bilateral upper arm and axillary regions. The quantitative T2 images were planned bilaterally over the upper arm (49 mm foot-head field-of-view) as guided by the high-spatial resolution structural imaging (Fig. 1).

Anatomical imaging and tissue regions that were the focus of the quantitative superficial and deep T2 MRI measurements. Lymph nodes were identified on DWIBS images
MLD intervention
Following the non-MRI and MRI measurements, patients underwent a 50-minute session of MLD. The intervention was performed by a certified lymphedema physical therapist (experience = 11 years), with Lymphology Association of North America certification. MLD consisted of stimulating the bilateral supraclavicular fossae, cervical lymph nodes, shoulder collectors and axillary lymph nodes, along with stimulating anterior and posterior axillo-axillary pathways, ipsilateral inguinal lymph nodes and axillo-inguinal pathway, deep abdominals, involved quadrant and arm applying stretch to the tissues proximal to distal toward the direction of intended lymphatic flow with temporary redirection toward uninvolved orthogonal truncal quadrants and involved posterior shoulder. 15
MRI data analysis
The signal (S) in the multi-echo spin echo MRI data were plotted against echo time (TE) and a constrained minimization routine (fmincon; Matlab, Mathworks) was applied to simultaneously quantify the equilibrium signal intensity (S0) and voxel-wise T2 relaxation time according to,
Subsequently, regions of interest (ROI) encompassing (1) arm deep tissue, and (2) upper quadrant superficial tissue and subcutaneous fat were segmented from the T2 maps (Supplementary Fig. S1; Supplementary Data are available online at www.liebertpub.com/lrb). Quantified T2 values, separately in each region, were utilized for hypothesis testing.
Statistical considerations and hypothesis testing
The primary hypothesis is that quantitative, internal MRI measurements of tissue structure, sensitive to lymphatic fluid and fibrosis, change spatially after MLD and that these changes are more substantial than limb volume (perometry) or non-MRI measures of tissue properties including BIS and TDC. Supplementary aims were (1) to understand the discriminatory capacity of MRI measures for distinguishing edematous versus nonedematous limbs, (2) to ascertain any age-dependence of the MRI measures, and (3) to calculate reproducibility of the MRI measures in healthy controls compared with the non-MRI measures.
Descriptive statistics, including means, standard deviations (SDs), and ranges for continuous parameters were recorded. Investigations for outliers (2.5 SDs beyond mean) and assumptions for statistical analysis, for example, normality and homoscedasticity were made. To test the primary hypothesis, pre- and post-MLD measurements from each device were compared separately using a paired Wilcoxon Signed-Rank test with criteria for significance being two-sided p < 0.05. To test the secondary objectives, limb measurements before MLD were compared separately in involved arms of patients with BCRL to mean (e.g., right and left) arms of age-matched control participants using an unpaired Wilcoxon Rank-Sum test with criteria for significance being two-sided p < 0.05.
To account for absolute arm volume varying with participant body size, 16 we compared the ratio of arm volumes in controls (i.e., right:left) to the ratio of arm volumes in patients (i.e., involved:uninvolved). To understand an effect of age on the measures, Spearman's ρ was calculated separately for each measurement as a function of age in the entire control group. Bland–Altman plots were calculated to visualize the effect of MLD on two time points, relative to differences in patients pre- and post-MLD. Finally, for reproducibility assessment in control data, intraclass correlation coefficients (ICC) were calculated for data acquired at separate time points. Two-sided p-values were reported as a conservative estimate, despite the presence of directional hypotheses.
Results
Volunteer demographics
Table 1 summarizes the volunteer demographics and study parameters for each group, which included patients with BCRL (n = 16), age-matched controls to patients (n = 18), and the entire control group encompassing a wider age range (n = 29). No significant difference in age between the patients with BCRL and controls in the age-matched group was present (p = 0.50). BCRL participants had 1–29 axillary lymph nodes removed and spanned BCRL stages 0–2 (stage 0 [n = 4], stage 1 [n = 2], and stage 2 [n = 10]).
Case and control results
Figure 1 highlights the slice planning procedure and regions that were the target of imaging. Example cases of specific ROIs used are shown in Supplementary Figure S1.
Figure 2 summarizes the results of the non-MRI and quantitative deep tissue T2 MRI measures before MLD in the control volunteers and involved arms of patients with BCRL, separately for (A) TDC, (B), BIS, (C) limb volume ratio, and (D) deep tissue T2. TDC and BIS measurements were both significantly elevated (p < 0.05) in patients relative to controls. A trend for elevated ratio of limb volume (p = 0.06) was found when considering all patients (BCRL stages 0 and 2) relative to age-matched controls.
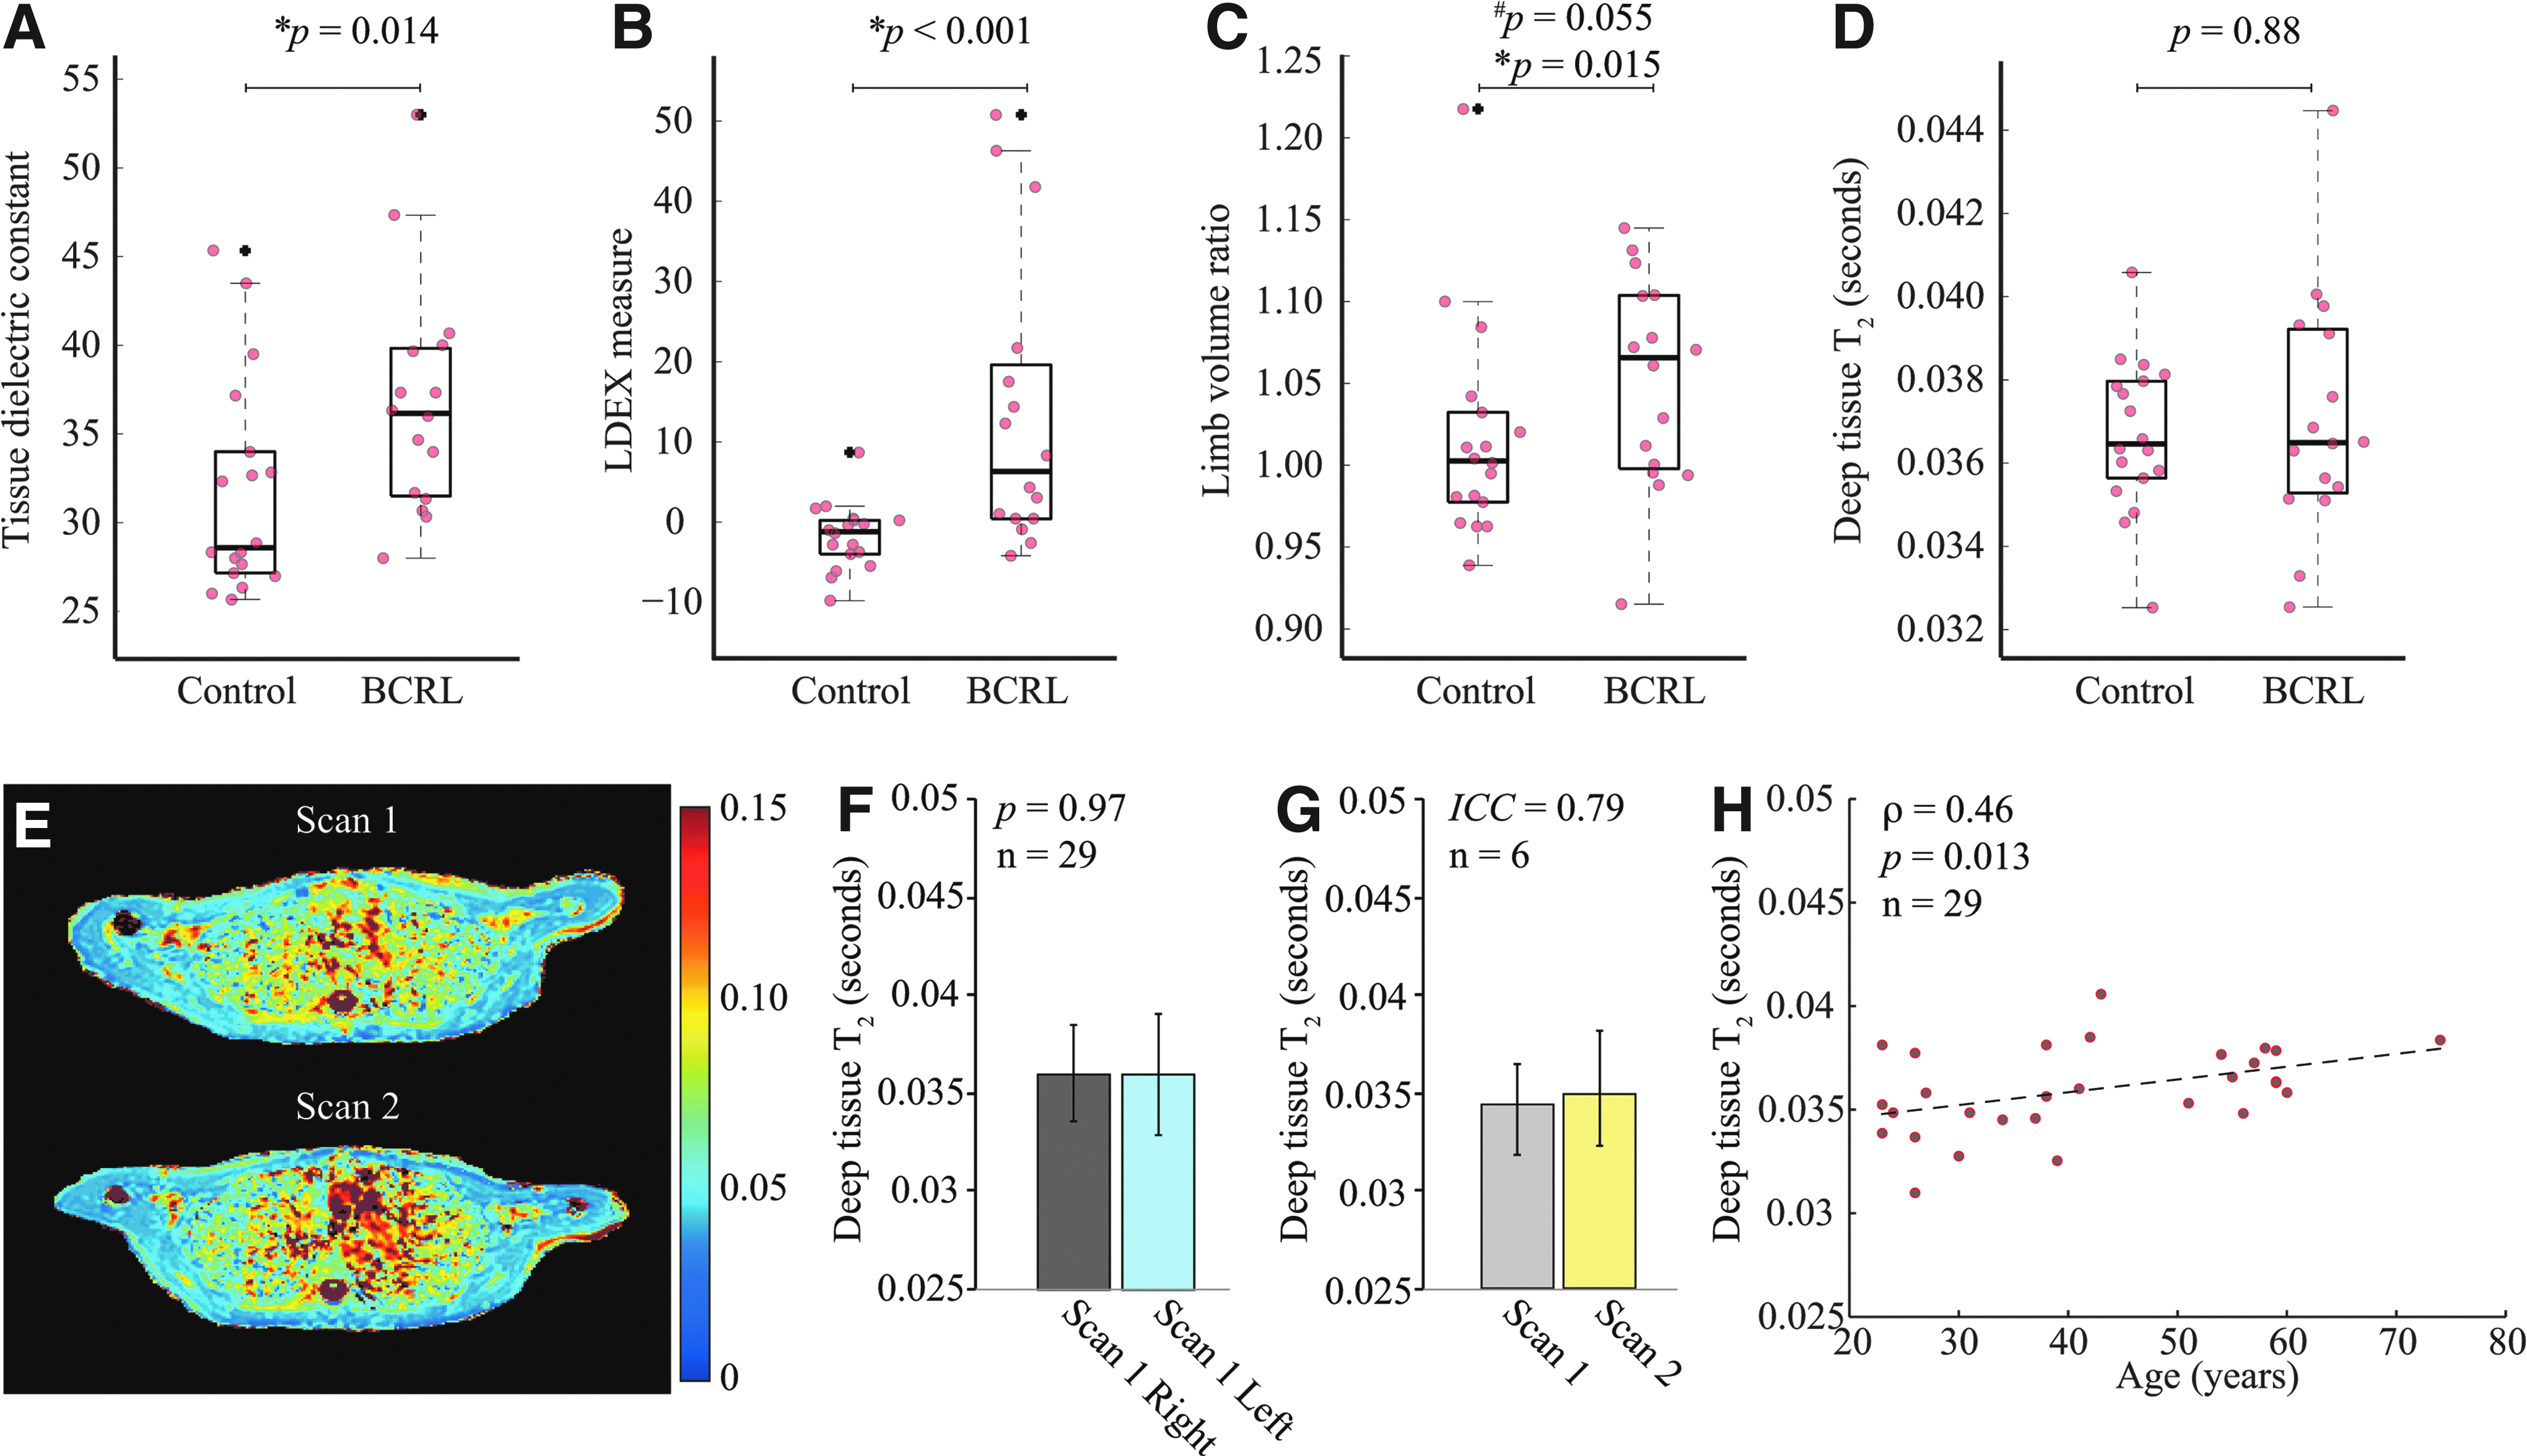
Control and BCRL values of TDC
When excluding patients with preclinical lymphedema (stage 0) and considering only patients with stages 1 and 2 (n = 12), as expected, the limb volume elevation in patients met criteria for significance as well (p < 0.01). In contrast to the non-MRI measures, neither the deep tissue T2 nor the superficial T2 values differed significantly between the involved and contralateral arms of patients or between the involved arms of patients and age-matched control volunteers, a finding that is consistent with the complexity of the tissue composition in BCRL and increased free water and edema (longer T2) counterbalancing the presence of scarring and/or fibrosis (shorter T2).
Figure 2E shows a representative quantitative T2 map for a control volunteer scanned at two time points demonstrating longitudinal stability of the T2 values. Figure 2F and Table 1 depict tissue T2 in healthy controls (deep tissue T2 = 0.036 ± 0.003 seconds; superficial tissue T2 = 0.141 ± 0.03 seconds), and deep tissue T2 between two time points in six healthy volunteers (Fig. 2G). The ICC was found to be 0.79, consistent with an acceptable range. 17 Figure 2H shows the effect of age on the measured T2 in healthy controls, in which a weak though significant T2 increase with age was observed (increase = 0.06 ms/year; Spearman's ρ = 0.46; p = 0.013). These results summarize the range and consistency of deep tissue T2 values in upper arms of healthy subjects, and demonstrate only a small although statistically significant increase in these measures with increasing age.
MLD therapy responses
Figure 3 summarizes the study measures before and after MLD in patients with BCRL, separately for the involved and contralateral arms. A significant increase in deep tissue water T2 was observed in the involved (pre T2 = 0.037 ± 0.003 seconds; post T2 = 0.039 ± 0.003; p = 0.029) and contralateral arms (pre T2 = 0.037 ± 0.002; post T2 = 0.040 ± 0.002; p < 0.01) after MLD.

Changes in study parameters pre- and post-MLD intervention in patient participants.
In the superficial ROIs, an increasing trend of T2 was noted in the contralateral side compared with a trend of reduction in the involved side. No significant difference was found in limb volume ratio, TDC, or BIS pre- versus post-MLD.
Figure 4 shows representative patient examples highlighting the spatial heterogeneity in changes in T2 after MLD relative to the reproducibility of the T2 measures in healthy controls scanned at two time points. Evidence of larger T2 increases on the involved side after MLD was observed in both deep and superficial T2 in the patients with a more advanced stage of BCRL (stage 2. Deep T2 increase = 5.8% ±2.9%; superficial T2 increase = 9.8% ± 3.5%) relative to earlier stages of BCRL (stages 0 and 1 only. Deep T2 change = 4.2% ± 3.1%; superficial T2 change = 6.1% ± 2.3%). The SD in the T2 measurements is quantified in Figure 4. Greater heterogeneity is observed in the involved arm of patients, which is exacerbated by the effect of MLD, compared to the contralateral arm and limbs of healthy controls.
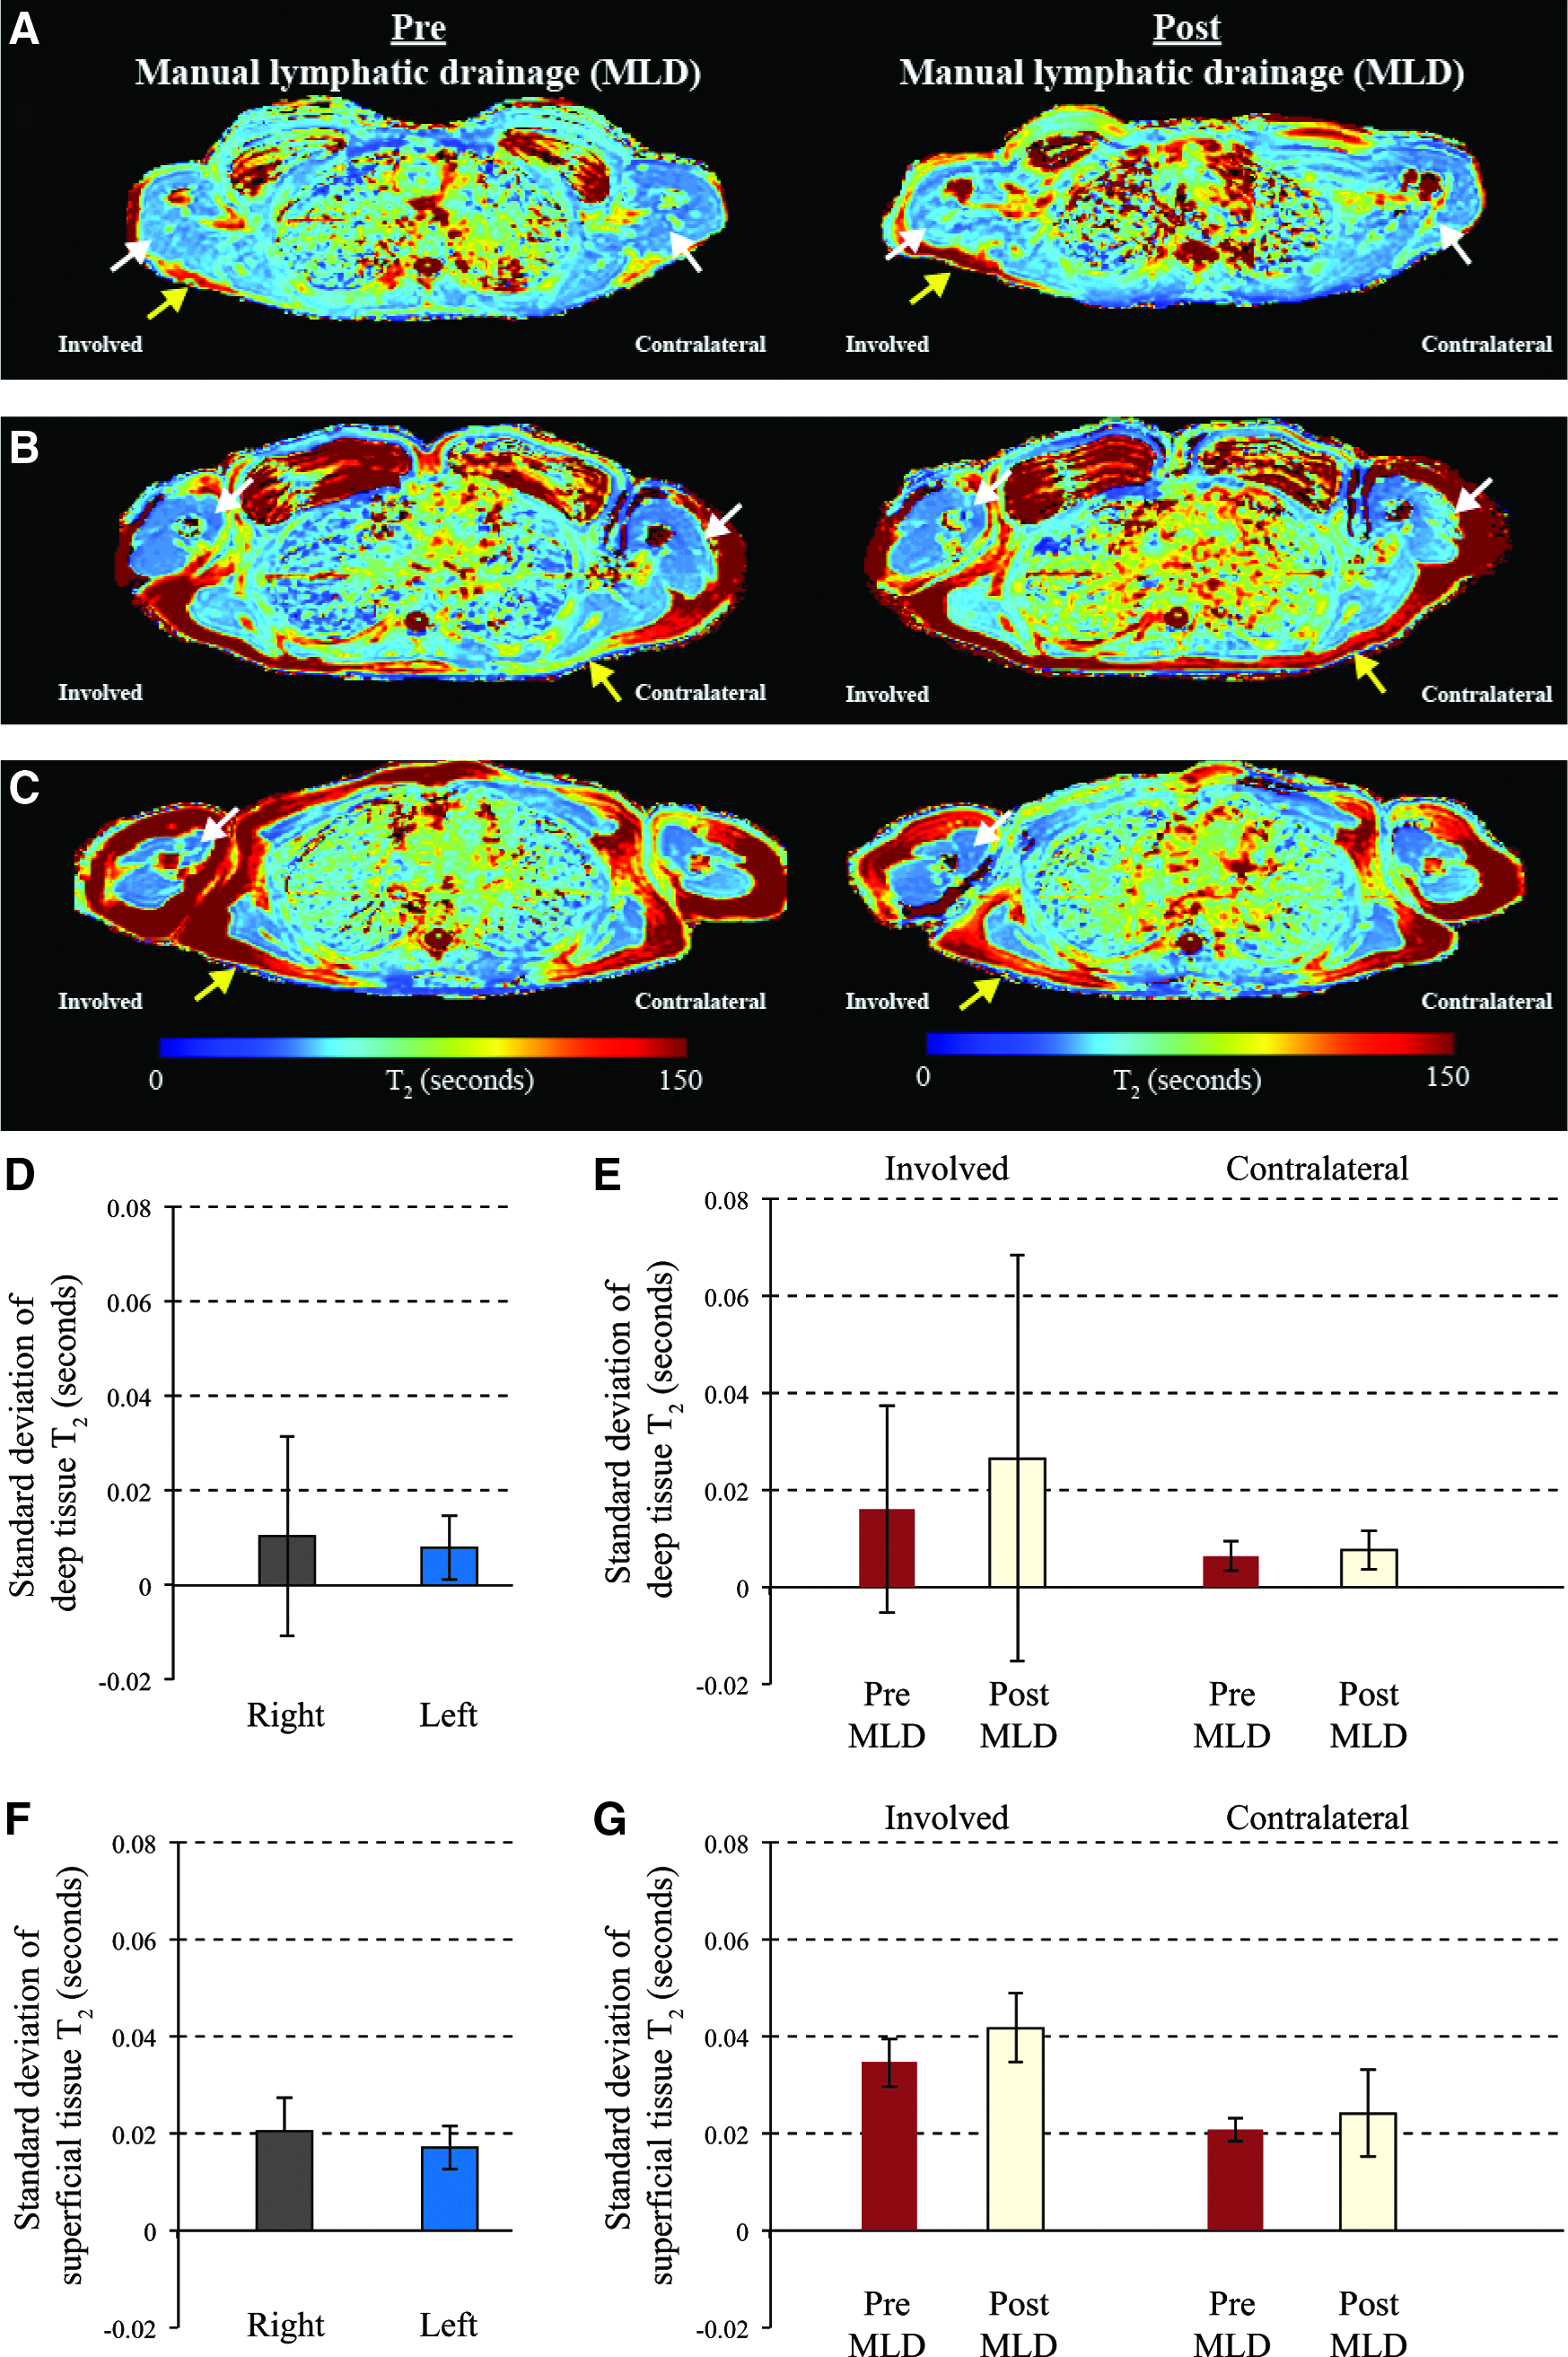
A single slice taken from three patients before and after MLD intervention. All images are in radiological orientation, with the involved side on radiological right. For control reproducibility (Figs. 2 and 5).
Figure 5 presents data from all volunteers with two time points: control volunteers scanned for reproducibility assessment, and patients with BCRL scanned before and after MLD therapy. This plot confirms only a small difference in control T2 values at the two time points, but larger T2 value differences on both the affected and contralateral sides in the patient participants before versus after MLD.

Discussion
MLD continues to be a common component of the traditional CDT to help patients manage BCRL onset and exacerbations; however, its effectiveness and optimal utilization in the clinic remains controversial. This is largely due to difficulty detecting the specific impact MLD may have on the lymphatic system and surrounding tissue using conventional metrics.2,18,19 Our findings revealed that non-MRI measurements (perometry, BIS, TDC) were largely confirmatory for discriminating between edematous and nonedematous limbs, yet these measures were insensitive to immediate tissue composition changes pre- versus post-MLD. However, quantitative deep tissue T2 MRI values revealed significant changes after MLD in both the involved and contralateral quadrant.
As depicted in Figure 4, results suggest consistency with the primary study hypothesis that in more advanced stages of BCRL, breakdown of fibrotic tissue (causing T2 lengthening) after MLD is present. These images also suggest, but do not confirm, that in early stages of BCRL, the response to MLD is largely consistent with relocation of fluid from the involved to contralateral quadrant (T2 lengthening). Further investigation of the intervention in the different stages of BCRL is warranted given the trends noted in this study. The heterogeneous response after MLD in T2 MRI of involved tissue indicates that a high spatial resolution internal measurement may be necessary for better understanding therapy response. These results are also consistent with previously published work suggesting MLD as a prevention intervention. 20
Quantitative changes after MLD
Several studies have reported changes immediately after MLD. Kurz et al. 21 found changes in excretion of urinary neurohormones, specifically significant increases in histamine and serotonin, immediately following MLD in patients with lymphedema whereas no changes were found in healthy controls post-MLD.21,22 In a pilot study, Tan et al.. 23 reported near-infrared fluorescence imaging visualized lymphatic contractility improvements with an increase in both lymph velocity and propulsive frequencies immediately post-MLD for the involved and contralateral limbs in patients with known lymphedema and in both limbs of healthy controls.
Mayrovitz et al. 24 utilized TDC and tape measurements and found a decrease in percent water content measured with TDC following MLD. These TDC measurements were obtained at the subjects' most edematous sites in their legs and repeated immediately after a single MLD intervention with reported TDC percentage reductions (mean ± SD) of −9.8% ±5.64% (p < 0.0001) and girth reduction of −1.5% ± 1.93% (p < 0.01). It is important to note that we performed TDC at predefined locations, specifically observing the upper inner arm (4.5 cm distal from axillary fold) location as the most sensitive to detecting change consistent with the quantitative T2 ROIs. While this upper arm TDC region generally colocalized with locations of swelling in BCRL volunteers in this study, using TDC locations of greatest edema in each subject may have provided different results.
It is well documented that when volumetric measurements are obtained using a standardized method,10,25–27 they discriminate involved from uninvolved limbs. Though volumetric measurements serve as the most commonly used clinical mechanism for quantifying treatment impact, there is question whether this indirect volumetric measurement is sensitive enough to discern the impact of the CDT components. Multiple studies have been designed in attempts to investigate volumetric changes as a response to MLD over time and some find MLD successful at reducing limb volume28,29 while others have found no effect.30,31
BIS has been used to investigate its potential to identify early signs of lymphedema before overt edema is detected and before the early symptoms of arm heaviness and generalized ache.32,33 As noted in the literature, our findings show that BIS can detect BCRL presence, yet is not sensitive as implemented to changes immediately following MLD.
Physiology of deep and superficial T2 changes
Three Tesla MRI skeletal muscle T2 values in rats have been reported to be 0.0327 ± 0.0013 seconds, 34 whereas human muscle has been reported to be 0.0322 ± 0.0019 seconds and 0.0357 ± 0.0023 seconds at 3 Tesla in soleus and vastus lateralis muscle, respectively. 35 Our mean values in upper arm muscle (Table 1) of 0.036 ± 0.003 seconds are largely consistent with these values and small variations may be attributable to differences in the muscle studied or species. To our knowledge, the age dependence of the deep tissue arm T2 has not previously been reported in the literature, though it is consistent with increasing edema and tissue atrophy with age.
At 3 Tesla, T2 relaxation is determined by spin–spin interactions, with more fluid-like environments such as free water (T2 = 4–5 seconds), cerebrospinal fluid (T2 = 0.75–2.0 seconds), lymphatic fluid (T2 = 0.5–0.7 seconds), and blood (T2 = 0.013–0.175 seconds depending on oxygenation level and hematocrit) yielding longer T2 relative to more rigid environments such as compact bone (T2 < 0.0005 seconds), muscle (T2 = 0.03–0.04 seconds), and mature fibrosis (T2 < 0.03 seconds).36–44 Additionally, concentration of other molecules relevant to lymphatic function will influence the water T2. It has been shown that in agarose phantoms water T2 increases with increasing levels of NaCl. 45 Therefore, increasing amounts of edema and to a lesser extent sodium in muscle may lengthen T2 whereas increasing amounts of fibrosis will reduce T2.
Our measurements demonstrate that water T2 increases following MLD in both the involved and contralateral arm, however, and also demonstrate that these changes are highly spatially dependent in patients and heterogeneous relative to control values in the same regions. The increase in water T2 on the contralateral side is not surprising, and is consistent with fluid being relocated to the healthy quadrant as a result of the MLD intervention.
This is one of the first studies to our knowledge that demonstrates these expected internal changes in the tissue microenvironment with this intervention and is consistent with results from Tan et al. 23 who found an increased lymphatic fluid velocity and frequency propulsion in both the symptomatic and asymptomatic limbs using fluorescence imaging. On average, we also observed a significant increase in T2 in the involved arm, although the statistical significance of this finding was lower. This finding may be consistent with the softening of fibrotic tissue noted in more advanced stages of BCRL and stimulation of the lymphatic and vascular circulatory systems in general as a result of the MLD intervention.
Indeed the variable effects on water T2 are reflective of variable stages of BCRL and can be observed in specific examples of patients at each stage of disease severity (Fig. 3). BCRL stage 0 (subclinical) yielded a decrease in water T2 on the involved side following MLD. Interestingly, in BCRL stage 0 there is no increase in T2 in the contralateral side post-MLD, suggesting the amount of fluid needed to be reabsorbed could be largely accomplished on the involved side.
Furthermore, the results in Figure 4 illustrate tissue composition changes from bilateral asymmetry pre-MLD to more symmetry post-MLD in stage 0 displaying improved tissue health on the at-risk side. For BCRL stage 1, water T2 decreases on the involved side and increases on the contralateral side consistent with potential rerouting of fluid to the uninvolved adjacent quadrants for reabsorption. For BCRL stage 2, water T2 post-MLD is increased on the involved side, though only slightly, likely due to the presence of fibrosis (shorter T2 relative to healthy tissue) that defines this staging category. The T2 trends observed in these specific examples are representative of all patients at these stages in this cohort.
Limitations
The sample size was designed to test the hypothesis that quantitative T2 changes are detectable in patients with BCRL relative to controls and pre- versus post-MLD, however, it is not sufficient to definitively determine how T2 varies with specific BCRL stage in different regions. Additionally, we only performed repeat MRI immediately after MLD for quantification of immediate MLD impact; however, surveillance imaging at future time points would be useful to understand the longevity of changes and the impact repeat MLD may have on the tissue microenvironment especially for later stages of BCRL.
Finally, while a quantitative and reproducible measure, water T2 may have multiple contributors (e.g., fibrosis and edema) and therefore provides only a surrogate marker of underlying function. In ongoing work, quantitative water T2 measurements are paired with MRI measures of lymphatic flow 5 and interstitial protein accumulation 14 to better understand the physiological sources of these changes.
Conclusions
We have investigated the use of quantitative T2 MRI to evaluate tissue composition in lymphadematous versus nonlymphadematous regions and to quantify microenvironment tissue changes in response to MLD intervention in patients with BCRL. Deep tissue T2 values uniquely changed after MLD intervention and therefore may provide an attractive noninvasive internal marker to evaluate lymphatic dysfunction, associated tissue composition, and best treatment approaches.
Footnotes
Acknowledgments
The authors thank the National Institute of Nursing Research (NINR) within the National Institute of Health (NIH) for funding our research (1R01NR015079) resulting in this article. We are grateful to our subjects for their time, as well as Kristen George-Durrett, Leslie McIntosh, Clair Jones, Christopher Thompson, and Charles Nockowski for experimental support.
Author Disclosure Statement
No competing financial interests exist.
References
Supplementary Material
Please find the following supplemental material available below.
For Open Access articles published under a Creative Commons License, all supplemental material carries the same license as the article it is associated with.
For non-Open Access articles published, all supplemental material carries a non-exclusive license, and permission requests for re-use of supplemental material or any part of supplemental material shall be sent directly to the copyright owner as specified in the copyright notice associated with the article.