
Abstract
Abstract
Background:
Both subcutaneous echo-free space (SEFS) observed by ultrasonography and the ratio of intracellular fluid resistance to extracellular fluid resistance (R i /R e ) calculated from bioelectrical impedance analysis (BIA) represent extracellular edema status in the extremities. We tried to correlate these parameters.
Methods and Results:
In 70 legs with venous edema (VE) and 68 legs with lymphedema (LE), subcutaneous tissue ultrasonography to determine SEFS severity (range, 0–2) and BIA to calculate R i /R e were performed. In the calf, SEFS severity showed good linear correlation with R i /R e , particularly in the lower lateral calf where the mean R i /R e for LE (SEFS grade 0: 3.2 ± 0.8; SEFS grade 1: 4.0 ± 0.9; SEFS grade 2: 6.3 ± 3.6) and VE (SEFS grade 0: 3.6 ± 0.6; SEFS grade 1: 4.4 ± 1.6; SEFS grade 2: 5.3 ± 2.0) was similar. In the thigh, a mild correlation was confirmed only in LE.
Conclusions:
It may be concluded that SEFS in the lower calf area well represents the local fluid status regardless of the type of edema, but not so in the thigh.
Introduction
E
Materials and Methods
This study was approved by the Institutional Review Board of Yamaguchi University Hospital (Center for Clinical Research, Ube, Yamaguchi, Japan). We studied 70 legs with VE (37 patients; age, 42–86 years; median age, 74 years) and 68 legs with LE (50 patients; age, 31–90 years; median age, 72 years). These patients attended our clinic between April and September 2015, and they agreed to participate in the study. All participants signed informed consent before enrolling. Patient characteristics are summarized in Table 1. In this study, leg edema with primary venous insufficiency, post-thrombotic syndrome, and functional venous insufficiency (FVI) were regarded as VE. FVI is defined as follows: no reflux or occlusion in the deep veins, saphenous veins, accessory saphenous veins, or perforators on duplex venous ultrasound; confirmed severe gait disturbance and/or prolonged sitting due to joint problems, general weakness, and obesity; and no other edemagenic conditions (e.g., cardiac, hepatic, or renal failure). The cases of LE complicated by venous disorders confirmed by duplex scan were excluded. An asymptomatic contralateral leg of unilateral VE/LE was used as a normal control (NC).
PVI, primary venous insufficiency; PTS, post-thrombotic syndrome; FVI, functional venous insufficiency; NC, normal counterpart; NS, not significant.
For BIA, a bioimpedance spectrometer (U-400; Impedimed Ltd., Brisbane, Australia) was used to determine the impedance. The measurement details were as described in our previous report. 5 In brief, with the patients in the supine position for 3 minutes, electrodes were attached to the anterior surface of three leg levels (ankle, upper edge of the patella, groin). The impedance in the thigh and in the calf without normalization was separately obtained, and then, the ratio of intracellular fluid (ICF) resistance (R i ) to ECF resistance (R e ) (i.e., R i /R e ) was calculated, 6 which is equivalent to the ratio of ECF to ICF volumes. 7 All the measurements were done within a few minutes. Because an interelectrode distance of more than 20 cm is required for proper measurement of impedance, which was recommended by the manufacturer, the thigh and calf could not be subdivided into upper and lower parts.
Immediately following BIA, a B-mode scan of the subcutaneous tissue was performed at the upper, lower, medial, and lateral positions of the thigh and calf using an ultrasound system (LOGIQ S6; GE Healthcare, Little Chalfont, Buckinghamshire, United Kingdom) with an 8–12-MHz linear transducer as previously described.2,8,9 Then, the SEFS was graded as follows (Fig. 1): grade 0, no echo-free space; grade 1, horizontally oriented echo-free space (at <45° to the skin) only; and grade 2, presence of vertically oriented echo-free space (at ≥45° to the skin) bridging the horizontally oriented spaces.
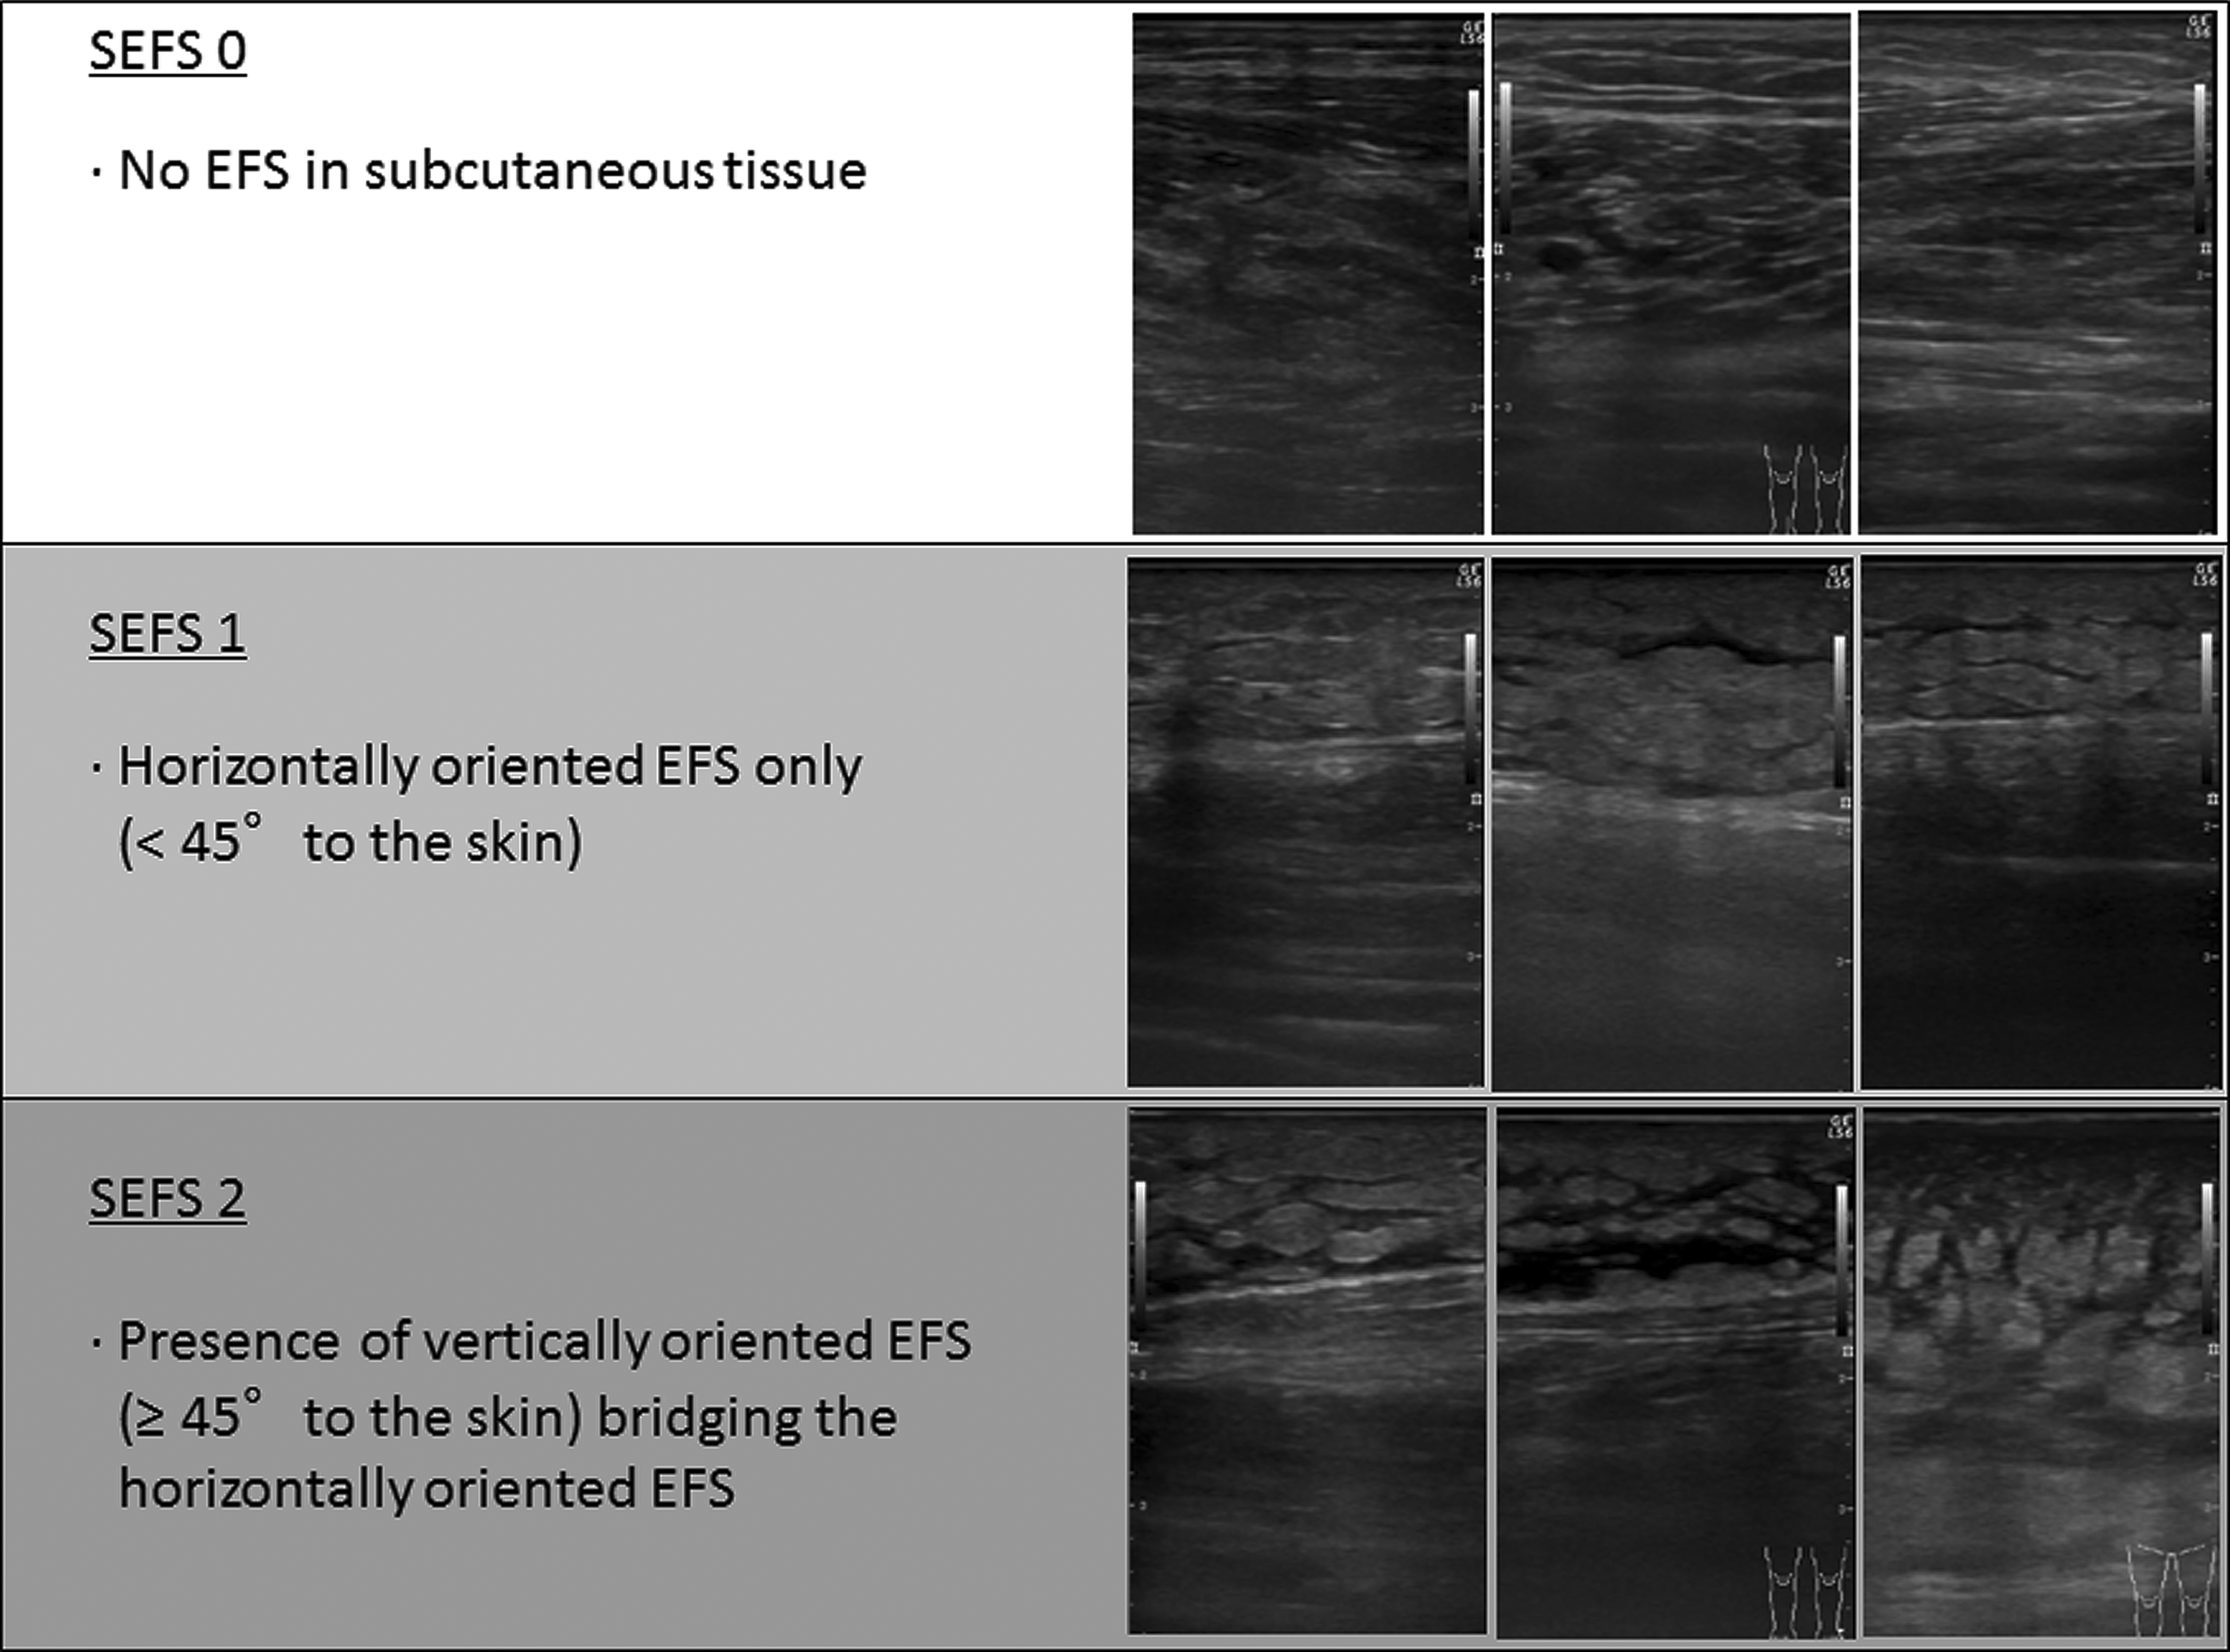
Definition of subcutaneous echo-free space (SEFS) grade.
Statistical analyses
Results are expressed as mean ± standard deviation or count, unless otherwise indicated. To test the differences in SEFS grades among different parts scanned using ultrasonography, the χ 2 test was used. To test the differences in subject characteristics and to test the differences in R i /R e s in the different body parts or different groups, the Kruskal–Wallis test was used; the Mann–Whitney U-test was used for multiple comparisons. The Spearman rank correlation was used to test the relationship between R i /R e s and SEFS grades in each leg part. The Mann–Whitney U-test was again used for multiple comparisons. Statistical analyses were performed using JMP 11.0 (SAS Institute, Cary, NC). A p-value <0.05 was considered significant.
Results
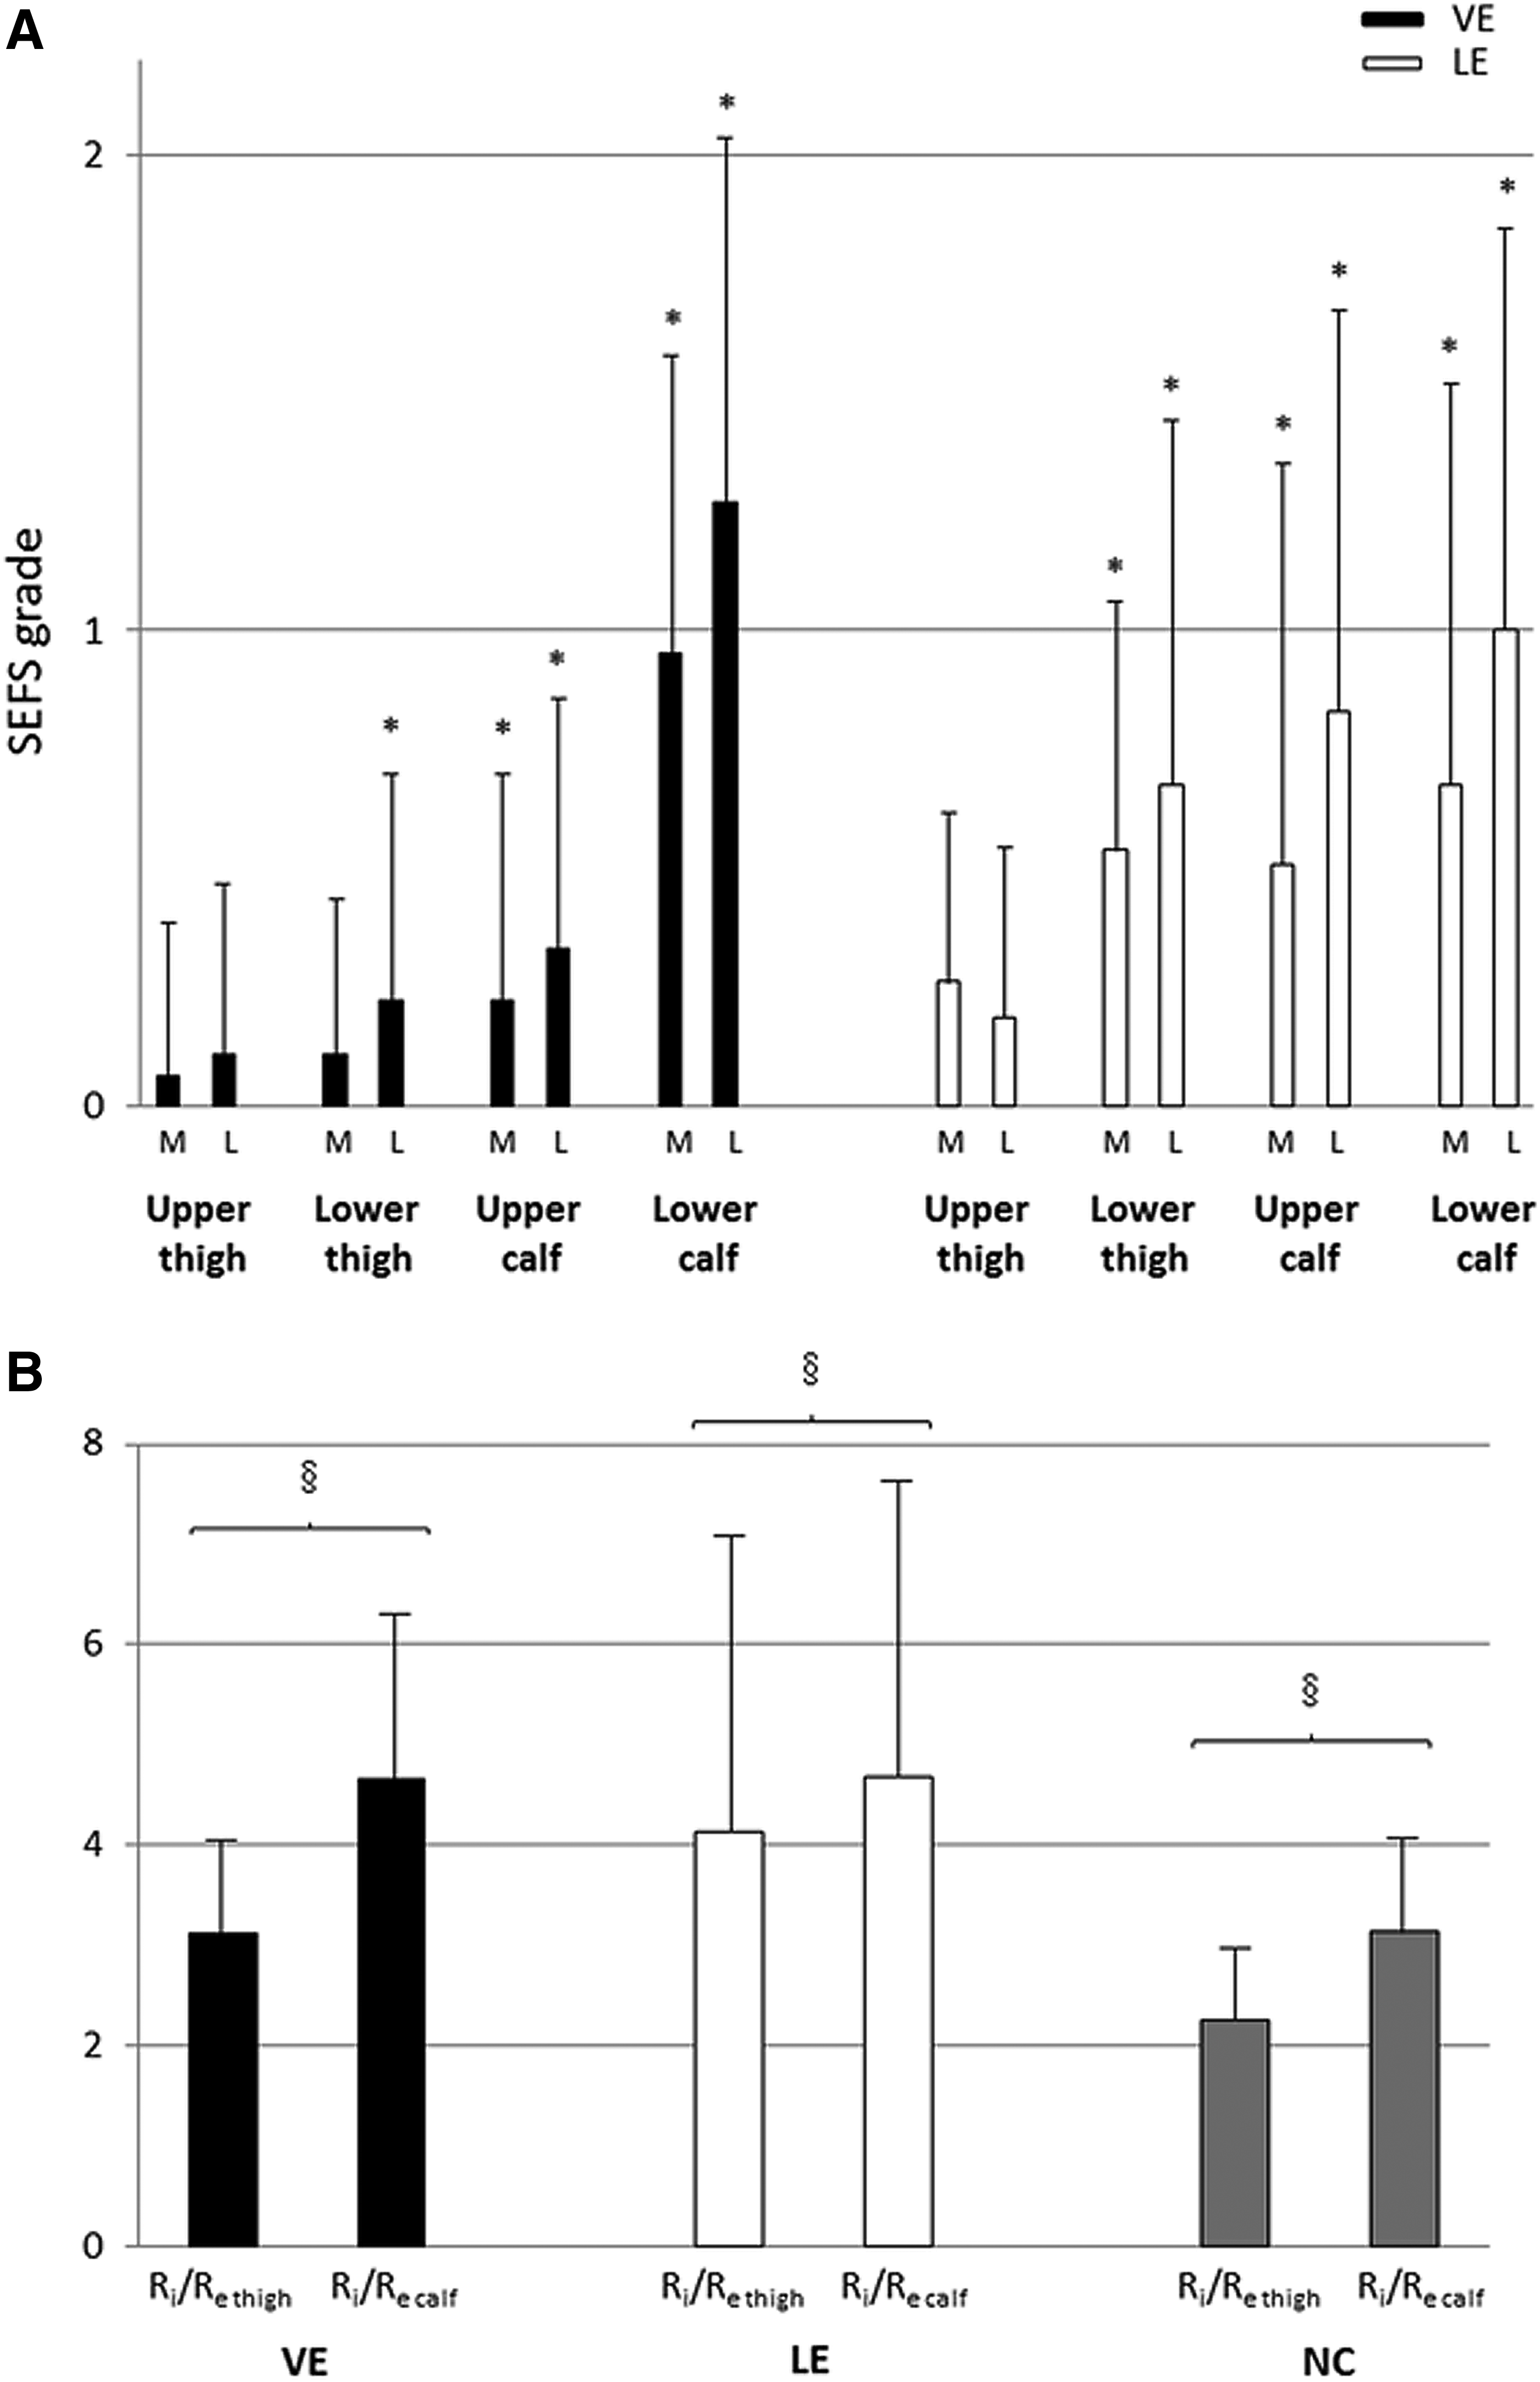
Consistent with our previous report, 2 the increase in SEFS grade attributable to gravity in VE and LE was reconfirmed (Fig. 2A). In VE, the increase in SEFS was particularly evident in the lower calf; however, in LE, SEFS attributable to gravity was gradually increased. No SEFS grade 2 was observed in thighs with LE. When impedances were studied, R i /R e in the calf (R i /R e calf ) was significantly higher than R i /R e in the thigh (R i /R e thigh ) in all legs (Fig. 2B), which is also consistent with our previous report. 5
Next, SEFS grade and R i /R e were correlated. (Fig. 3) In thighs with LE, a mild linear correlation was found between SEFS grade and R i /R e thigh , but no such correlation was observed in thighs with VE. More linear correlations were observed between SEFS grade and R i /R e calf for LE in the calf than in the thigh, particularly in the lower calf. Also, in the calf with VE, better correlations were found between SEFS grade and R i /R e calf . Particularly in the lower calf, mean R i /R e of LE and VE in each SEFS grade was similar. Regarding SEFS grade 0, small but significant increases in R i /R e thigh for VE/LE and in R i /R e calf for VE compared with those for NC were found.
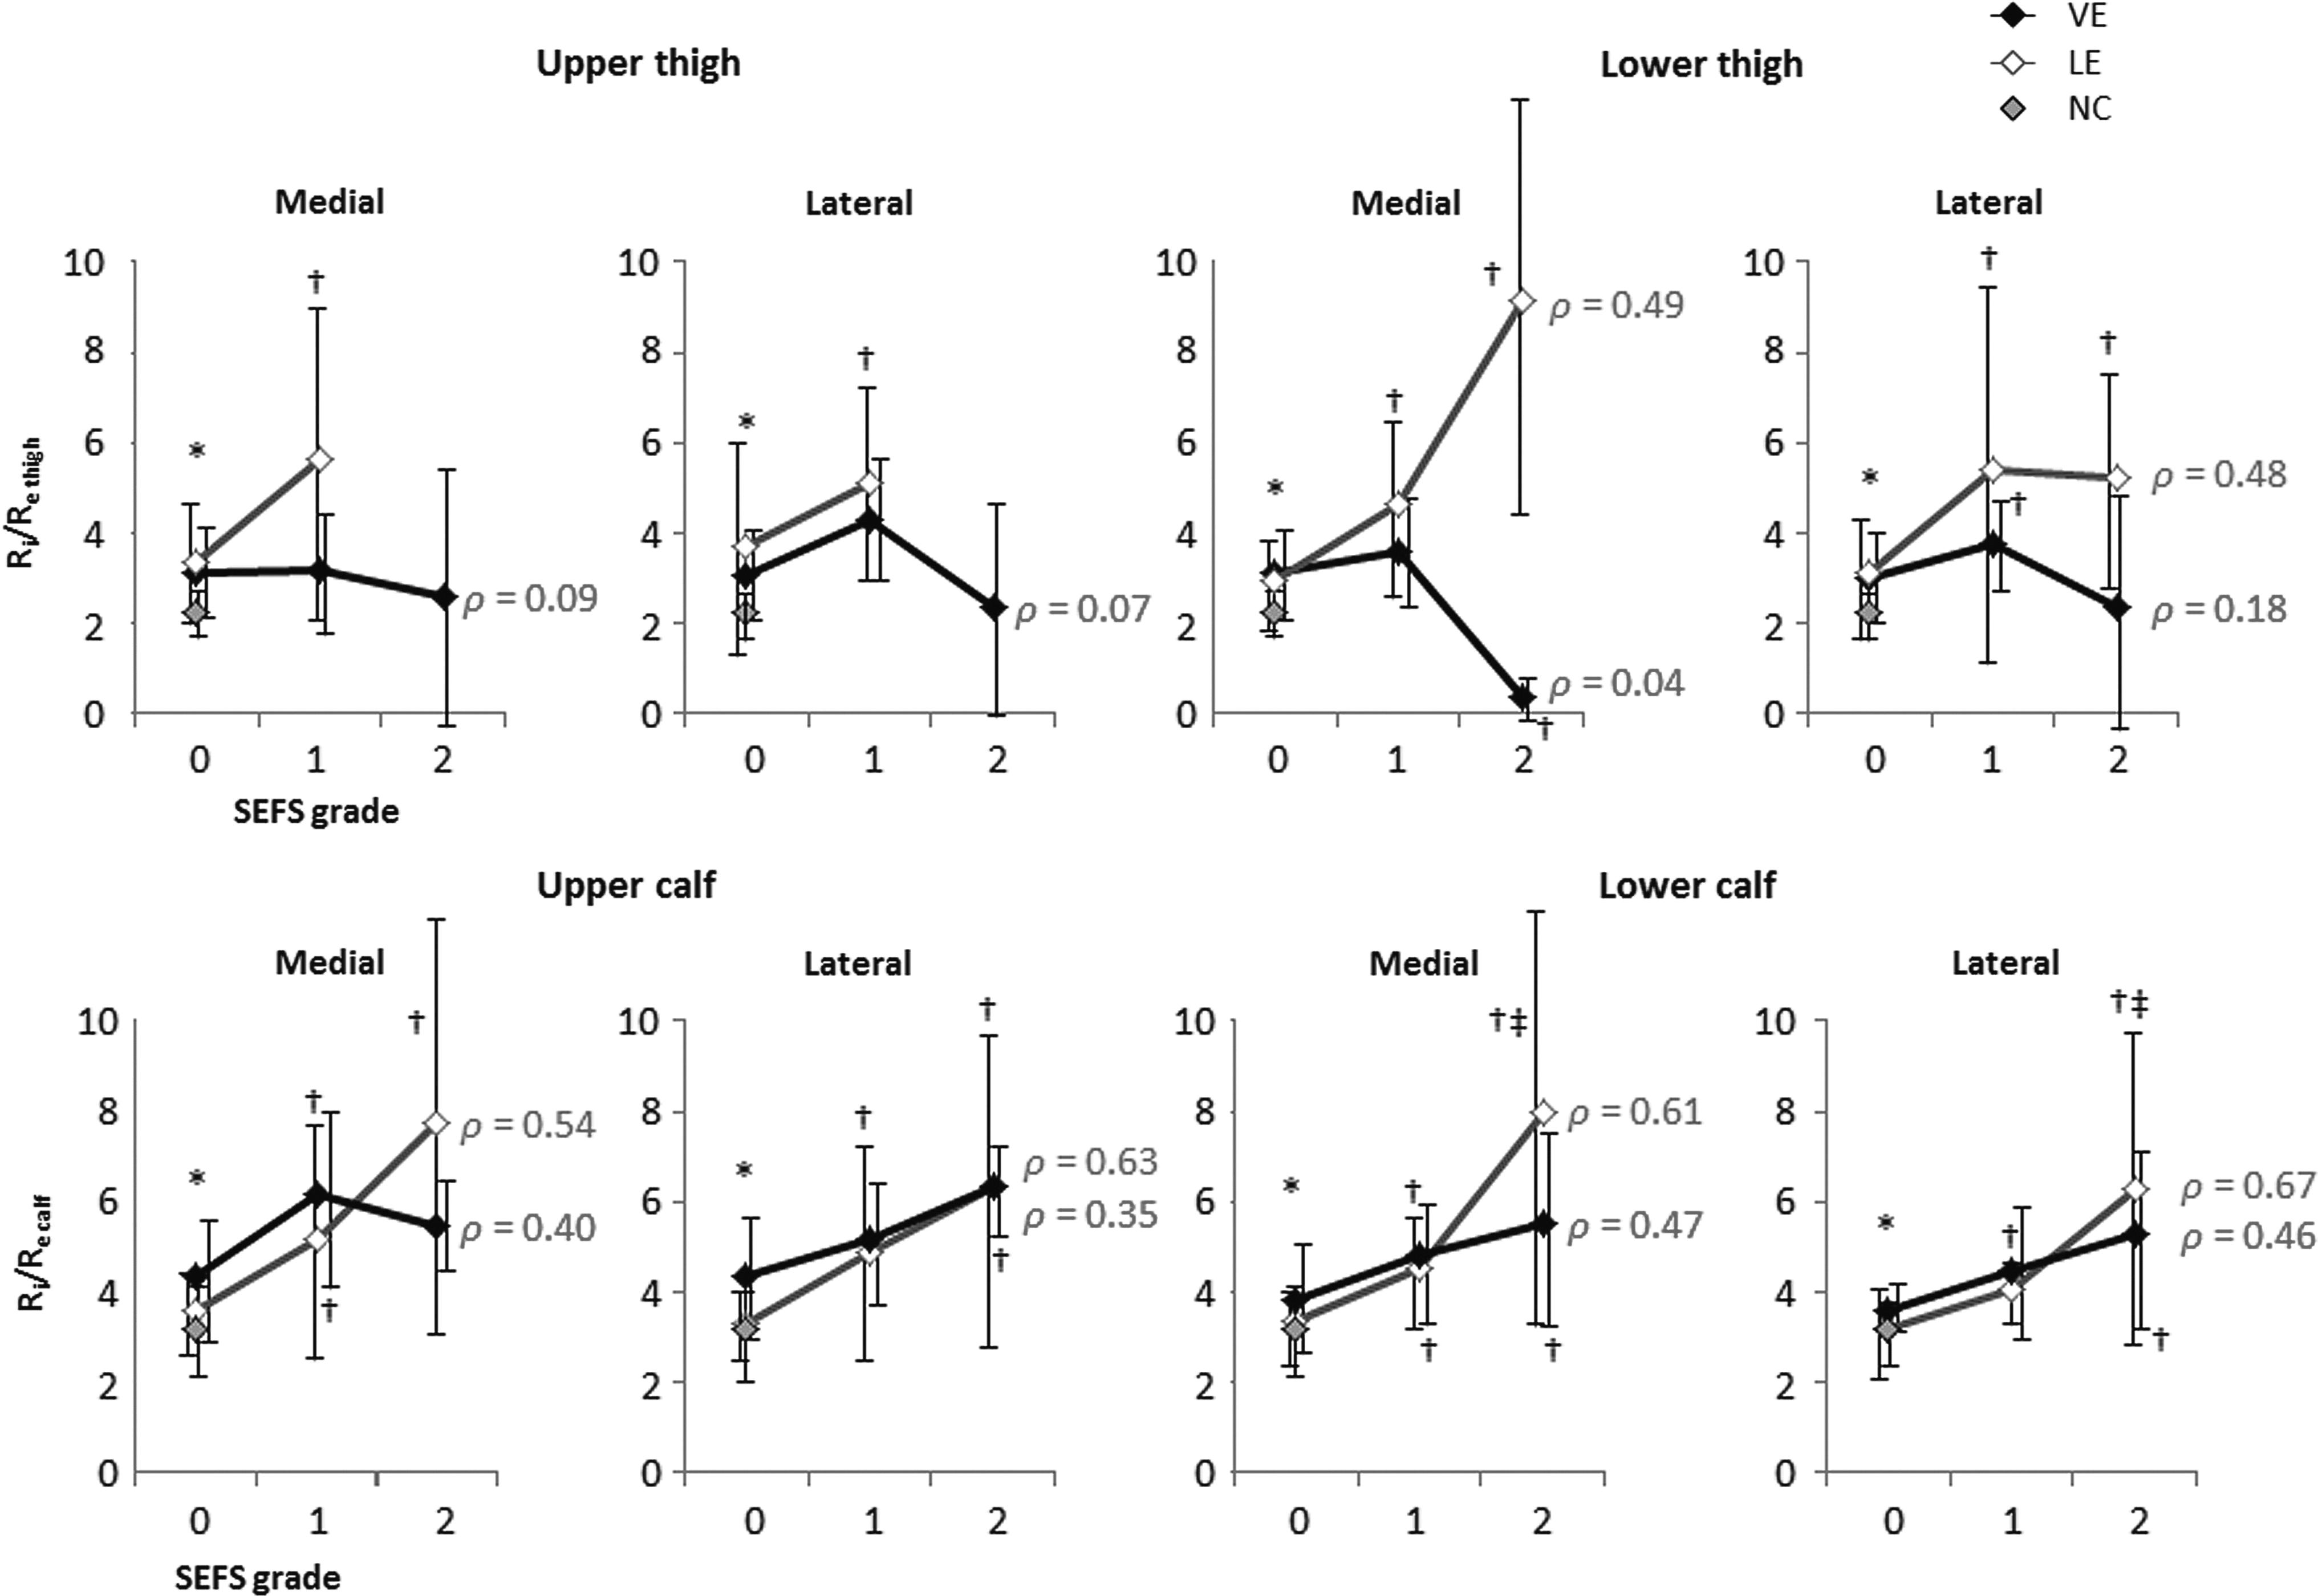
Correlation between SEFS grade and R i /R e thigh and R i /R e calf . *p < 0.05 for VE, LE, and NC. †p < 0.05 compared with SEFS 0. ‡p < 0.05 compared with SEFS 1. The rank correlation coefficient (ρ) is described in the figure. Error bars indicate the standard deviation.
Discussion
ECF detected by BIA is mainly plasma and interstitial fluid. The plasma can descend by gravity through the vessels, and so, the interstitial fluid can descend by gravity through the loose connective tissue. Therefore, the fluid in the thigh is not likely to stay in place; instead, it is likely to fall to the lower part of the leg. As a result, the ECF distributes more in the calf. This is true regardless of the type of leg edema and even in normal legs. 5 If plasma distribution is similar in these legs, then the increase in R i /R e of the leg with edema is considered to be derived from the increase in interstitial fluid.
In the current study, we confirmed that the correlations between mean R i /R e calf and SEFS grade in the lower calf were linear in VE and in LE, and that these mean R i /R e values were similar. This might mean that intuitively estimating edema severity in the calf by observing SEFS was roughly justified, although its correlation might not be very linear because R i /R e varied largely by individuals. In addition, this estimation could be made regardless of the type of edema. This may be helpful in daily medical practice, particularly when BIA is not available. However, SEFS grade in the thigh showed almost no correlation with R i /R e thigh and R i /R e leg for VE, whereas a slight correlation was found between SEFS grade and R i /R e thigh for LE. One possible explanation for this result is the difference in the mode of fluid accumulation in these leg edemas. In VE, the fluid in the thigh might be part of the accumulated fluid from the bottom of the leg. However, the fluid in the thigh might be derived from lymph stasis and subsequent chronic inflammation in the thigh with LE, part of which might have descended to the calf. Another possible explanation is the effect of posture during the examination. Because the patients were left in supine position for 3 minutes before measurements, the shift of plasma caused by postural change could be stabilized. However, the shift of interstitial fluid during the 3 minutes and additional few minutes for measurements might not be negligible, although SEFS does not normally change in such a short duration. This might have caused SEFS-insensitive measurements in comparison to impedance.
Essentially, SEFS cannot be seen in healthy legs; it is only seen in edematous tissue. Therefore, SEFS grade 0 should indicate normal fluid status. However, small but significant increases in R i /R e thigh for VE/LE and in R i /R e calf for VE compared with those for NC were noticed in SEFS grade 0. This could indicate that an undetectable increase in interstitial fluid by currently used ultrasound might have existed, or that the amount of plasma was increased due to underlying inflammatory status. This discrepancy needs to be clarified in a future study.
Limitation
Because SEFS was determined by a single observer in the current study, reevaluation of interobserver and intraobserver differences may be necessary. The calculations used to estimate fluid resistance data incorporate the assumption of constant coefficients of resistivity for the fluids. However, these may be different among VE, LE, and NC, thereby possibly resulting in a source of error in the fluid volume calculations using BIA. 10 Ward et al. reported that R i /R e in the leg was higher in healthy subjects, 80 years or older than in younger subjects. 6 Although the subject characteristics, particularly regarding age, were similar in this study, this could have affected the results. An asymptomatic case of unilateral LE served as NC in this study, but no detailed definition in terms of stage 0 LE (i.e., latent phase) is available. 11 These legs might have reduced lymph transport reserve; therefore, it was considered whether such legs should have been distinguished from truly normal legs. The correlation between SEFS grade and impedance ratio was tested using the Spearman rank correlation in the current study, but this might not be appropriate. However, we (including our statistician) could not find any better methods because of the small sample size and SEFS grades. Therefore, this grading system may require further refinements.
Conclusion
We found that the SEFS grade for the lower calf represents the amount of edema fluid for both LE and VE in the calf. SEFS in the thigh also represented the fluid status in thighs with LE, but not with VE.
Footnotes
Author Disclosure Statement
No competing financial interests exist.