
Abstract
Abstract
Background:
Staging of lower extremity lymphedema (LEL) is difficult in clinical work. The excellent soft tissue contrast of magnetic resonance imaging (MRI) enables soft tissue changes to be feasibly and reproducibly characterized and distinguished.
Aim:
To determine whether cross-section areas of edema calves measured with MRI could be useful for staging of the LEL.
Materials and Methods:
We recruited 138 participants who were clinically diagnosed with LEL: 61 unilateral and 77 bilateral LEL. Two legs underwent different stages of LEL. Fourteen characters are diagnosed without LEL; we assumed them as stage 0; age-matched 54, 59, and 54 lower extremities had the LEL, which are classified as stages 1, 2, and 3, respectively. On fat-suppressed T2-weighted mid-axial images of calves, the total area of the soft tissue (TA), muscle area (MA), and the water area (WA) of subcutaneous tissue of the bilateral claves were measured and analyzed statistically for staging of LEL. The difference of TA (DTA) of the unilateral LEL was also analyzed.
Result:
TA and DTA showed statistical differences among each stage (p < 0.0001), except that it was challenged in making off stages 0 and 1 (p > 0.05). No significant difference was found among four stages of LEL in MA. WA was able to display the perfect sensitivity to lymphedema appearance (p < 0.0001, sensitivity = 100%).
Conclusion:
The WA of the calves could be suggested as a specific indicator for diagnosis of LEL. TA and DTA are the secondary indicators for staging of LEL.
Introduction
L
LEL can be staged according to the International Society of Lymphology (ISL) 2013. 1 In the early stage of LEL, the physical condition of the extremities can be alleviated with limb elevation. 6 As for the increasing LEL stages, the swelling extremities may be relieved with appropriate therapy. Once it comes to the late stage, even operative methods are not applicable. 7 Therefore, early recognition and proper assessment of LEL are the precondition for the best results of treatment.
Water displacement and circumference changes are clinically applied to stage LEL,1,8 whereas some patients with early LEL are not identified by using the recommended values of a 20% increase in volume, or a 2 cm increase in circumference of the affected limb compared with the unaffected limb.1,9,10 Moreover, these rough measurements provide little information on the underlying tissue structural and componential changes. Hence, a sensitive and specific method for timely diagnosis of LEL is needed.
The diagnostic tools, such as computed tomography (CT), 11 dual-energy X-ray absorptiometry (DAX), 12 magnetic resonance imaging (MRI), 13 and ultrasonography (US), 14 are usually applied to examine the thickened subcutaneous tissue and adipose tissue of the chronic lymphedema. However, CT and DAX are not only insensitive to the fluid tissue but also increase the radiation risk. US is limited in the deep tissue penetration. Previous studies suggested that MRI was the optimal tool for detecting soft tissue contrast,13,15 and our work also showed that the subcutaneous thickness of the lower extremities measured with MRI could be recommended as an indicator for staging of LEL. 16 Here, we find that the subcutaneous areas of calves measured by MRI also could contribute toward differentiating the LEL.
Materials and Methods
Participants
The study was officially approved by our institutional review board. Written informed consent was obtained from each participant before the enrollment of this study.
From November 2014 to September 2015, 60 patients with primary LEL and 78 patients with secondary LEL were recruited in our study based on the following criteria: (1) The patients were diagnosed with extremity swelling with unknown reasons; (2) unilateral extremity or bilateral extremity swelling occurred after lower abdominal surgery. Participants were excluded from this research by the following standards: (1) Patients were diagnosed with vascular disease by ultrasound; (2) muscle disease or its related problems. LEL was diagnosed and staged by two experienced lymphologists (each with >10 years of experience in diagnosis and treatment of disorders of the lymphatic system) who reached agreement by consensus, according to the ISL 2013 criteria 1 (Table 1).
In general, despite the clinical appearance, such as extensiveness, erysipelas attacks, inflammation, and pitting, the volume difference was used to assess the severity of the lymphedema: stage 0: no significant inter-extremity volume discrepancy (<5%), no pitting, no skin changes, and no size changes in the bilateral extremities after one night's elevation; stage 1: the affected extremity is <20% larger in volume than the unaffected extremity, subsides with one night's elevation, or shows slight pitting; stage 2: >20% inter-extremity volume discrepancy, the swelling does not subside with one night's elevation, manifest pitting is evident, and no skin changes are found; stage 3: the affected extremity is 40% larger in volume than the unaffected extremity, pitting is absent, and trophic skin changes are present, including acanthosis and warty overgrowths.
MRI protocols
MRI was performed by using a clinical 3.0T MR scanner (Achieva, Philips Medical System, Best, the Netherlands) that was equipped with an eight-channel torso array coil. The interval between the MRI study and clinical staging was in the range of 1–3 hours (mean, 1.2 hours; median, 1.5 hours). Each participant was placed in the supine position with feet first into the magnet. The scanning covered the area between the ankle and inguinal region.
After localizing images, images of bilateral calves were obtained by using coronal T2-weighted imaging (T2W) (repetition time TR, 3500 ms; echo time TE, 120 ms; matrix, 320*304; section thickness, 5 mm; number of slices, 24–32; acquisition time, 142–196 seconds); axial fat-suppressed T2-weighted imaging (TR, 3500 ms; TE, 12 ms; matrix, 320*304; section thickness, 5 mm; number of slices, 32; acquisition time, 196 seconds); and axial T1-weighted images (TR, 650 ms; TE, 12 ms; matrix, 320*304; section thickness, 5 mm; number of slices, 32; acquisition time, 132 seconds). The coronal plane images were performed along the long axis of the bilateral thighs.
A field of view of 400*400 mm2 was used to cover the thigh. Coronal T2-weighted images were included to plan the T1- and T2-weighted acquisitions, and axial T1-weighted images were included for the conventional diagnostic images.
Data interpretation
Post-processed images were reviewed by two independent readers (Q.L. and J.R.X. with 15 and 27 years of experience in musculoskeletal MRI, respectively) who were blinded to the clinical data. By using the ImageJ2x (Rawak Software, Inc., Germany), total area of the soft tissue (TA), muscle area (MA), and water area (WA) of the calves were measured (Fig. 1).
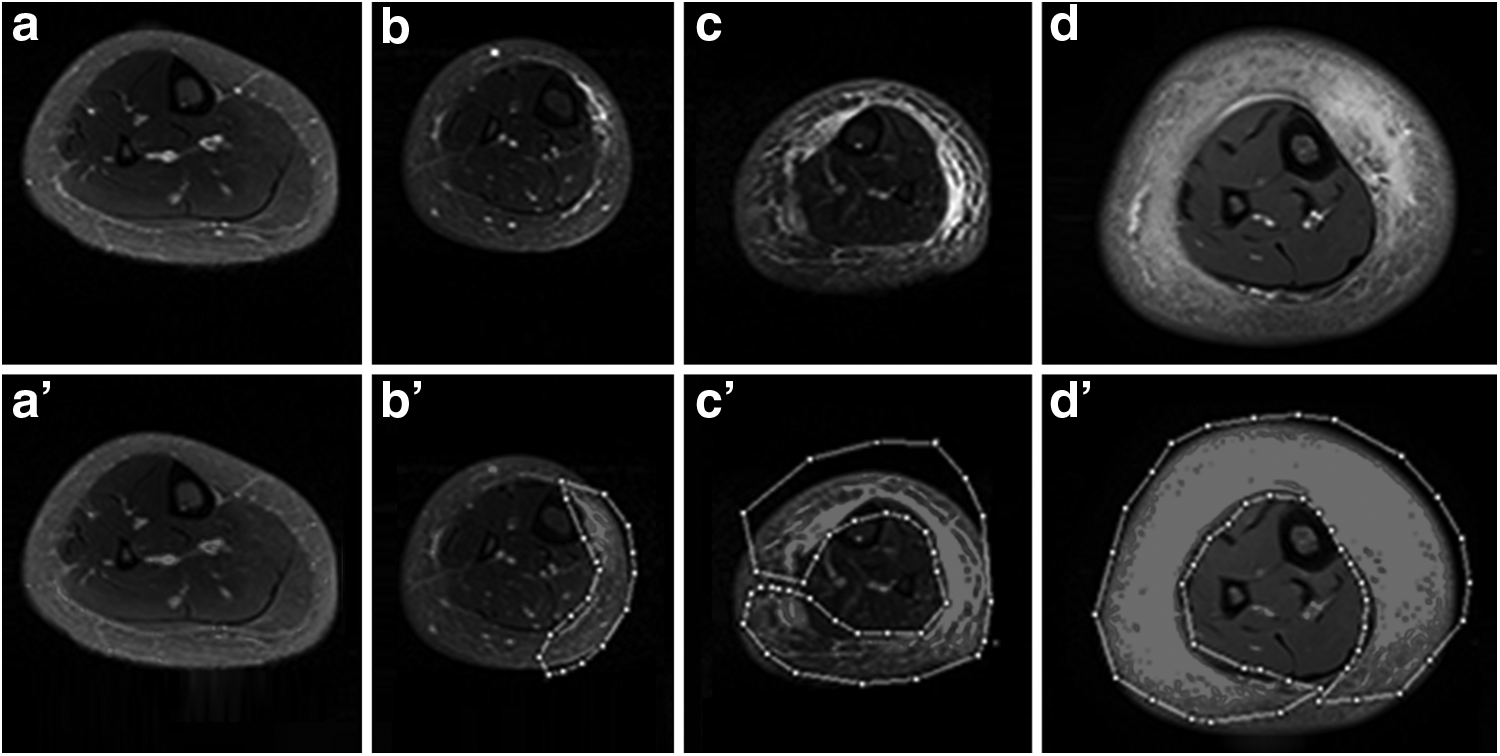
Fat-suppressed mid-axial T2W images of calves showed the changes of subcutaneous tissue areas with LEL identified as stage 0 in the right calves in a 27-year-old man
Fat-suppressed T2W axial images, corresponding to the midpoint of edematous soft tissue, were used to eliminate the impact of the high signal of fat tissue on the measurement of edematous soft tissue. The midpoint of the calves was defined as the middle point of the fibular head between the lesser trochanter and medial epicondyle. In axial images of the calves, the lasso-like method was used to measure the soft tissue area. The TA was defined as the total area of the affected calf excluding the area of the fibula and tibia at the midpoint section of the fibular. The MA of the affected calves represented the MA of the midpoint section of the fibular. The WA of the affected calves expressed the area of subcutaneous water of the midpoint section of the fibular. The difference of TA (DTA) expressed the DTA.
Statistical analysis
The reliability of the measurements of TA, MA, and WA in calves was obtained by two independent readers; it was assessed with the intra-class correlation coefficient (ICC), as follows: 0–0.2, no agreement; 0.21–0.40, poor agreement; 0.41–0.60, moderate agreement; 0.61–0.80, good agreement; and >0.80, excellent agreement.
Spearman's rank correlation analysis was used to assess the correlation between the LEL stage and the TA, MA, and WA values of the calves. The parameters were compared between patients stratified by LEL stage, by using multivariate analysis with the Least Significant Difference (LSD) for multi-comparisons. If the multivariate analysis yielded a significant positive finding for a parameter, the parameter cutoff values for classifying LEL stages were determined with receiver-operating characteristic curve (ROC) analysis.
The area under ROC curve (AUC) measured the accuracy of staging, as follows: AUC = 0.5, random prediction; AUC < 0.5, fail than the random prediction; 0.5 < AUC <1, better than random prediction, have the prediction value; and AUC = 1, perfect prediction value. All statistical analysis was carried out with SPSS version 22.0 (SPSS, Inc., Chicago IL). A p < 0.05 was considered indicative of a significant difference.
Results
Reliability of inter-observer measurements
Excellent inter-observer agreement was obtained in the measurements of TA (ICC = 0.92), MA (ICC = 0.90), and WA (ICC = 0.85). The mean measurement values of the two readers were used as the final results. The TA, MA, and WA values of the four stages are summarized in Tables 2, 3 and Figure 2. TA showed great differences among each stage, except its hardly making off stage 0 from stage 1. WA made significant difference among each stage. MA showed no significant difference among each stage.
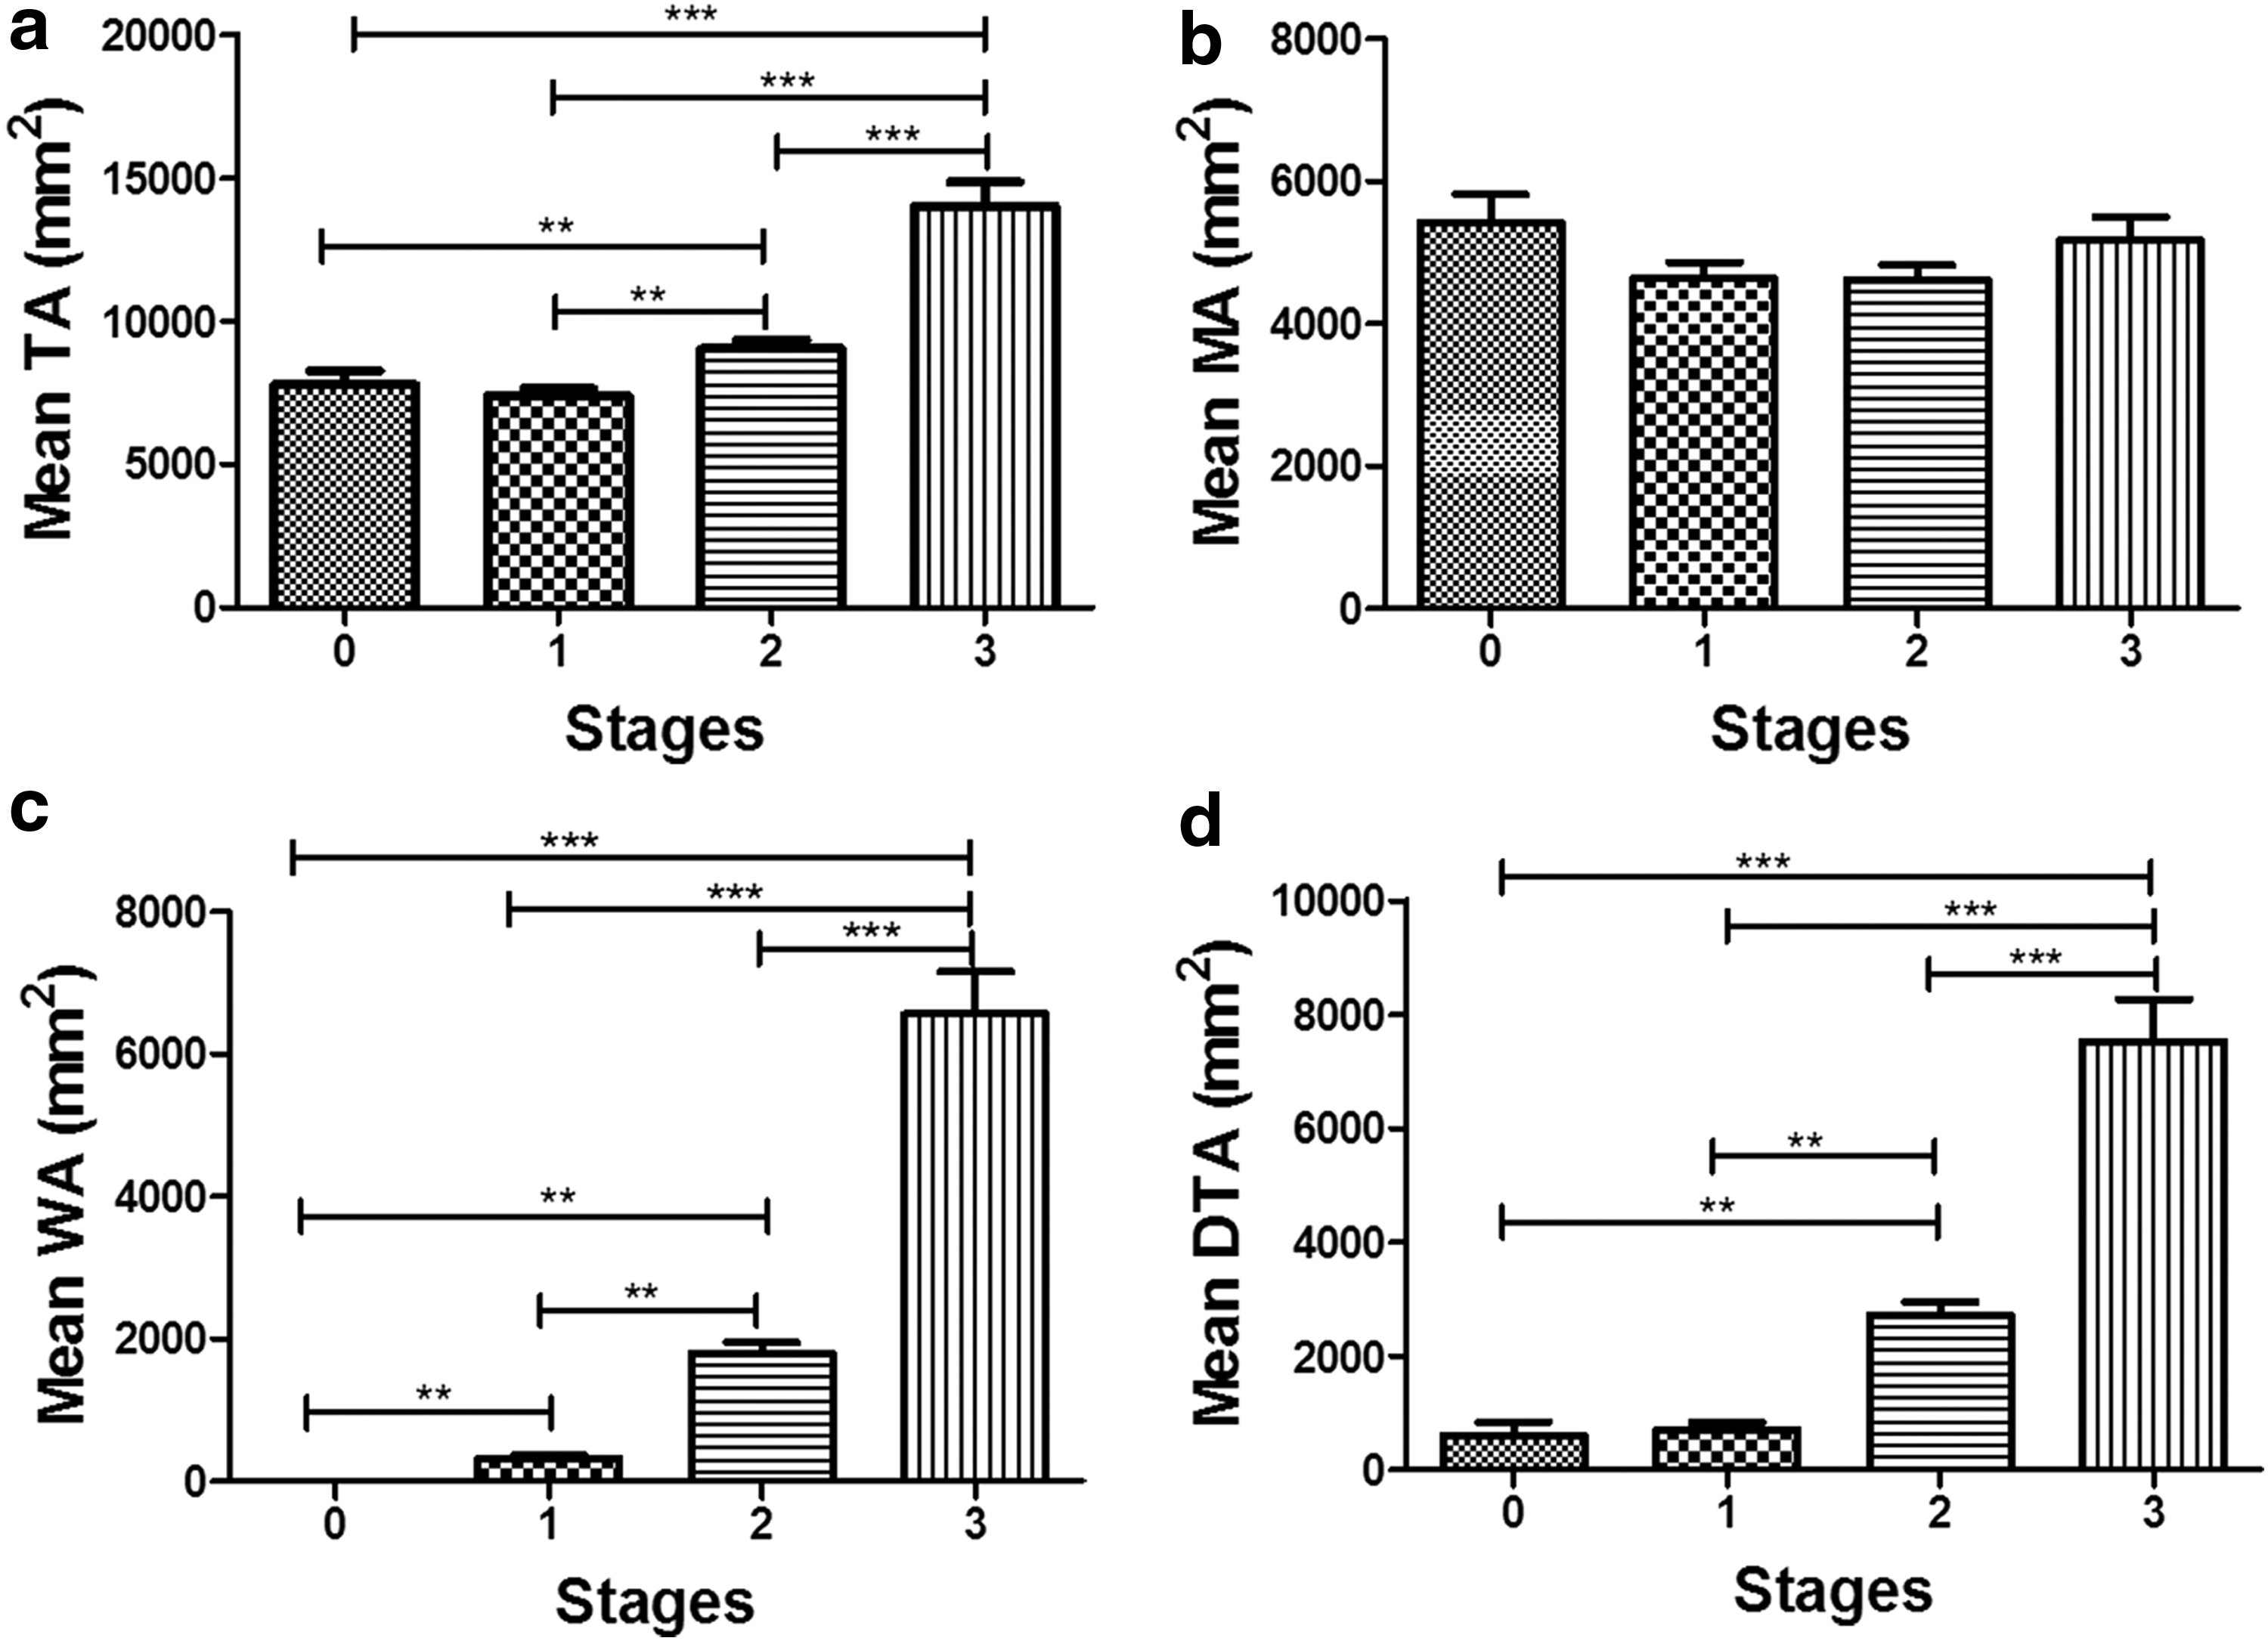
These histograms illustrate the correlation between soft tissue areas of calf and stages of LEL by Turkey analysis. The histograms a, b, c, and d show the correlation between TA, MA, WA, and DTA of calves with LEL stages, respectively. DTA, difference of TA; MA, muscle area; TA, total area of soft tissue; WA, water area. **p < 0.01; ***p < 0.001.
Different from stage 0 (p < 0.001).
MA, muscle area; TA, total area of soft tissue; WA, water area.
Different from LEL stage 0.
Different from LEL stage 1.
Different from LEL stage 2.
Different from LEL stage 3.
LEL, lower extremity lymphedema.
Correlation of the LEL stage of the calves with soft tissue area
Spearman analysis showed that LEL stages were moderately related to increasing TA (0.817), and a strong correlation was seen between LEL stages and WA (0.921) (p < 0.001), with the absence of correlation being disclosed (0.155). Independent-sample t-test (Table 3) showed that the TA of the calves displayed no significant increase from stages 0 to 1. MA of the calves showed no significant increase from stages 0 to 3. WA showed a significant increase from stages 0 to 3 (p < 0.05). Pairwise comparisons with LSD correction were consistent with the trend of multivariate analyses (Fig. 2).
ROC analysis of the utility of the soft tissue area of all the calves for staging of LEL
Based on the ROC analysis, the cutoff values for TA, DTA, and WA for the different LEL stages are shown in Table 4. The corresponding areas under the curve, sensitivities, and specificities are also illustrated in Figure 3. These results suggested that TA and DTA are useful for staging from 1 to 3 (Fig. 3), but they are not suitable for early diagnosis of LEL. WA of the calves is the best parameter for classifying LEL.
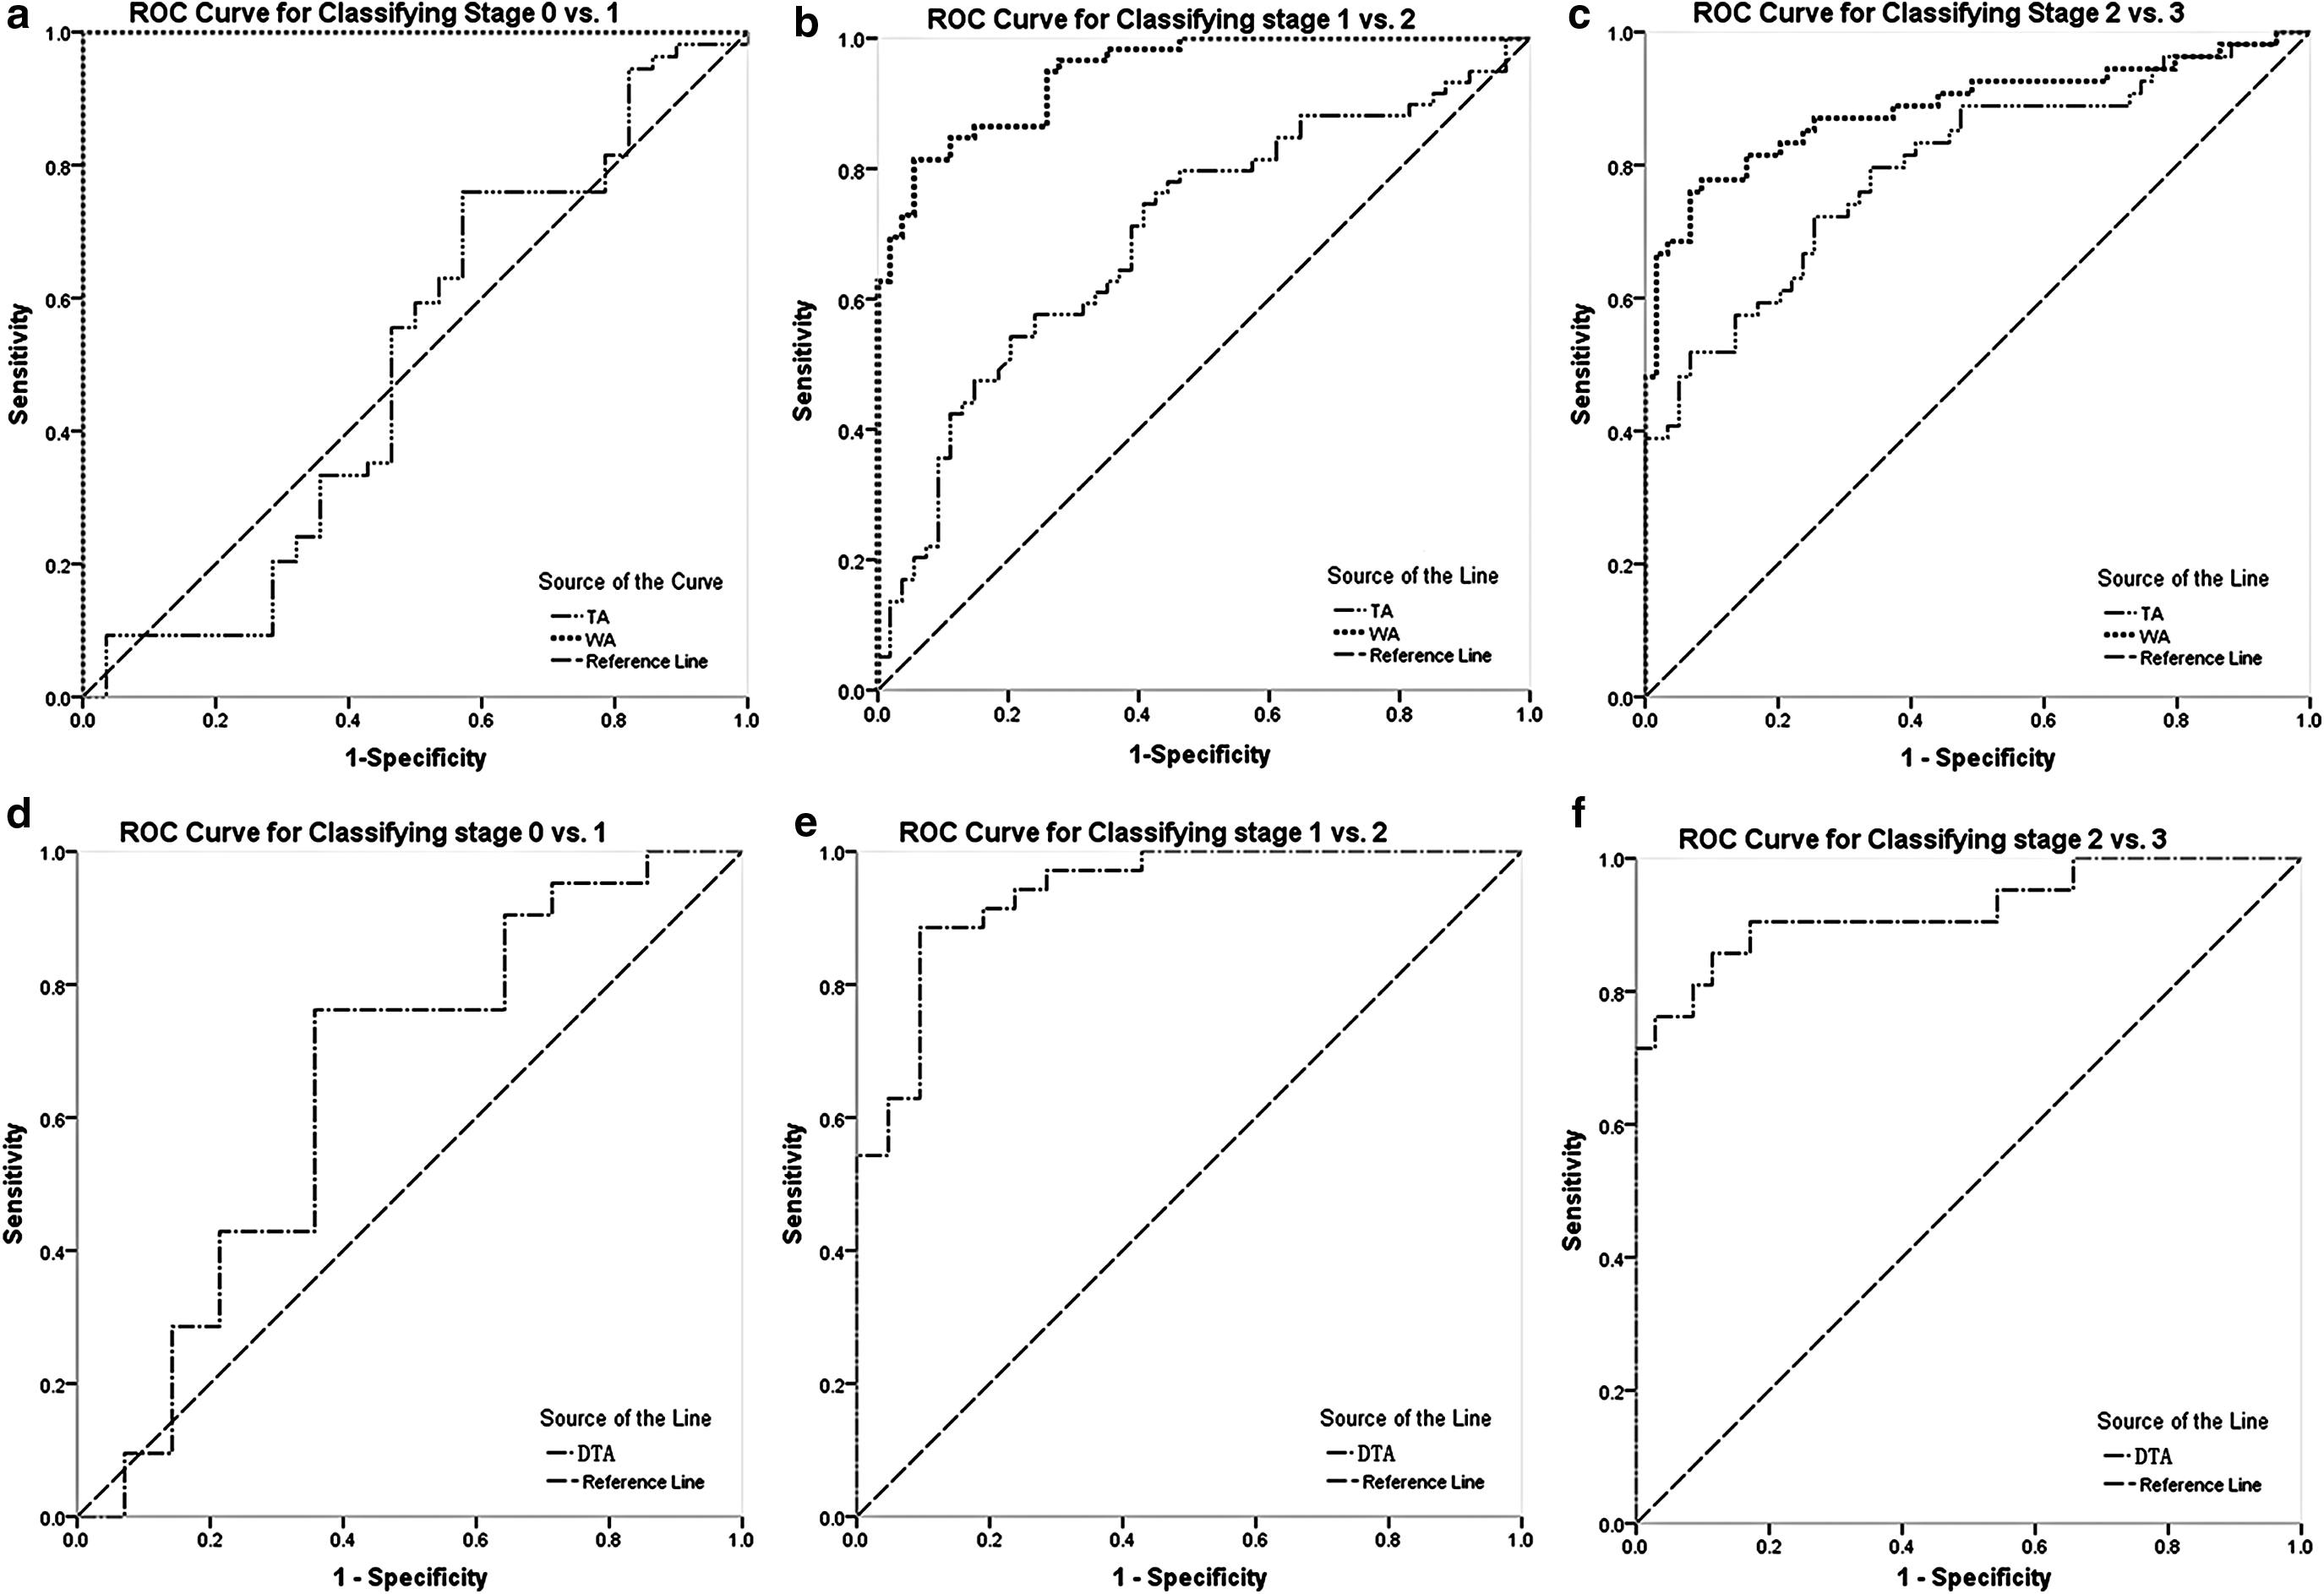
ROC curves show the TA, DTA, and WA of calves for classifying LEL stage 0 versus 1, 1 versus 2, and 2 versus 3.
AUC, area under the curve; DTA, difference of TA; WA, water area of the soft tissue.
Discussion
Recently, an increasing number of literature have paid attention to the identification of early staging of lymphedema.17,18 According to the pathophysiology of lymphedema, the retained lymphatic fluid is typically confined to the epifascial space of the skin and subcutaneous tissue and does not involve the deeper muscle,19,20 which is consistent with our MRI findings. Slowed lymphatic flow has been shown to incite lipogenesis and fat deposition and later leads to increased fibrocyte activation and connective tissue overgrowth. Affected patients, thus, develop progressively firmer subcutaneous tissue as fibrosis ensues, including hypertrophy of their adipose tissue. 21
These pathologic changes indicate that at the early staging of lymphedema, interstitial fluid is the main component. With the disease progression, the fat deposition and subcutaneous tissue fibrosis would disproportionally contribute to the swelling of the affected limb. Therefore, accurate evolution of the interstitial fluid is very important for lymphologist because it is helpful for the severity assessment and treatment plan. Since the interstitial fluid could be easily removed after intense complex decongestive therapy, the subcutaneous tissue fibrosis and fat deposition need a long time to treat or need surgical treatment.
The measurement of the proportion of interstitial fluid within the subcutaneous tissue could accurately evaluate the stage or severity of lymphedema and evaluate the response of treatment or prognosis. Previous MRI studies have reported that MRI could be used for the evaluation of severity and the demonstration of pathologic changes of lymphedema, including interstitial fluid, subcutaneous fibrosis, and fat deposition. Which components are mainly associated and how they are related to progression of lymphedema are not studied and elucidated so far. This study specifically focused on the measurement of interstitial fluid in the subcutaneous tissue, which helps us to understand whether MRI could be used as an early diagnostic tool and whether the amount of interstitial fluid is correlated with the progress of lymph edema.
MRI is demonstrated to be the relatively practical and reproducible tool to assess the LEL.13,22,23 In the early stage of lymphedema, since fat signal is high, water can be clearly displayed. Fat deposition and fibrosis get along with the medium and, in the later period, the characteristic of lymphedema is also prominent. Hence, MRI is a good method that is used to develop the changes of water.
The earlier lymphedema is detected and properly treated, the better will be the outcome.24,25 Early detection and treatment can lead to near normalization of a swollen extremity, and a greater chance of minimizing or avoiding significant complications.25,26 However, no cross-section study was performed to confirm whether the current stage of lymphedema develops as chronic lymphedema. Many researchers reported that lymphedema is a chronic condition that requires lifelong treatment. The development of lymphedema represents a dynamic, actively changing process.
Chronic lymphedema has been considered a progressive condition. When lymphedema is presented, the progression of this disease will not stop. Although the transition from early stage to late stage of lymphedema may be highly variable, fibrosis may develop quickly in some patients and take months or years to develop in others. 26 Because early detection of lymphedema is more frequently based on the patient's own recognition of symptoms, such as limb tightness and swelling, too often, symptoms are either unrecognized or disregarded, resulting in initial therapy being sought at a more advanced stage.
Patient education and informed awareness can improve this scenario, and even under favorable conditions may be unnecessarily delayed. 27 Thus, there have been efforts to identify latent or incipient lymphedema by using more quantitative and sensitive methods, including the detection of early tissue changes by MRI. Our study demonstrated that MRI could quantify the changes of lymphedema.
According to this method, we quantitatively measured the TA, MA, WA, and DTA of the calves from stages 0 to 3 to determine how these parameters changed with LEL stages. The results showed that the TA, MA, WA, and DTA of the calves displayed the variant correlation with LEL stages (Fig. 2). The TA, DTA, and WA were correlated closely with LEL stages. According to our previous study, the WA of the calves is the optimum parameter for distinguishing stages of LEL, the DTA of the calves is the second choice, and the TA of the calves is relatively insensitive and unspecific compared with DTA in staging of LEL. 28 The TA and DTA of the calves displayed a significant increase from stages 1 to 3, whereas LEL progressed considerably slowly.
At the early stage of LEL, the total soft tissue areas of calves may not make sense, and physiopathologic alterations may happen, such as fluid absorbing, protein accumulation, and fibrosis of the soft tissues. This may explain why TA and DTA did not obviously increase in earlier stages, and the thickness of the calves cannot exactly reflect the edema. Maybe the changes of subcutaneous ingredients dominant the transformation from stages 0 to 1 of LEL, except for water. However, the molecular mechanisms on this progress are unresolved. The MA showed no significant increase from stages 0 to 3, and the excessive weight of fluid did not contribute to the larger area of muscle. WA showed a significant increase from stages 0 to 3 (all p < 0.05). The general trend of WA is consistent with that the subcutaneous tissue's thickness of calf increased with the LEL stages,13,15,16,29 except the steady appearance between stages 0 and 1 (Fig. 2a, d).
In conclusion, only the WA of the calves can distinguish all the stages of LEL with high specificity and sensitivity. The great performance of WA should be attributed to the MR detection method, as described earlier.
Above all matters, in spite of the significant difference, the parameters can hardly differentiate the early stages of LEL, except for WA. The fairly high sensitivity and specificity of WA could suggest that the parameters of WA can play the indicator of grade LEL, especially for early LEL. It could be beneficial to patients who just had lower abdominal axillary lymph node surgery, body radiation, and just high risk for LEL. Consequently, complications can be minimized when LEL is treated in the earliest stages. Measurement of WA can overcome the disadvantages of water displacement and circumference measurements, and it is completely unaffected by the contralateral calves and their muscle changes. At the same time, DTA and TA can also be added to value the LEL stage, except for the early stage.
However, our study also shows several major deficits. First, our results are only suitable for individuals whose calves are affected, and parameters of thighs are not carried out. Second, primary and secondary LEL individuals may have been separated into two groups. Third, some additional factors, such as the function of draining lymphatic vessels and lymph nodes numbers, are not counted in this study. Finally, therapy histories such as compression garments and operations are not included. The last but not the least, as we all know, the widely accepted gold standard method is volume measurement for objectively assessing lymphedema. 30
In our previous published work, we performed a study to demonstrate that the soft tissue size of calves measured with MRI was of concurrent or construct validity with lymphedema by using the water displacement method. 28 In this study, although we did not perform a similar study to validate the measurement of subcutaneous areas of calves by using MRI, we found that the subcutaneous areas of calves correlated closely with lymphedema stages. WA was different from the thickness of soft tissue of calves. A further study is necessary to validate the volume measurement of lymphedema with the measurement of WA of calves.
Fat-suppressed T2W MRI is not only sensitive and reproducible but also a noninvasive method to detect the LEL. Importantly, with the earliest identification of LEL, we can help many patients increase their quality of life by minimizing the potential risk. Given the difficulty and importance of early diagnosis of LEL, we recommend that the WA of calves measured with MRI for early identification of LEL and parameters of TA and DTA, except for MA, could be applied in staging of LEL. In conclusion, this study may be valuable for early detection and staging of LEL.
Footnotes
Acknowledgments
This research was supported by the National Natural Science Foundation of China (Grant Nos. 81271638 and 81371622), and Shanghai Pujiang Program (Grant No. 15PJ1405200).
Author Disclosure Statement
No competing financial interests exist.