
Abstract
Abstract
Background:
Near-infrared fluorescence (NIRF) imaging is a new imaging technique that is used to visualize lymphatic vessels in humans. It has a high spatial and temporal resolution, allowing real-time visualization of lymphatic flow.
Methods and Results:
The current study investigated the intra- and inter-individual variability of the technique, and how local hypo- and hyperthermia (20°C, 40°C), as well as exercise affect lymph transport. In this study, 10 healthy volunteers were studied twice, with 2 weeks between. NIRF imaging was conducted by using intradermal Indocyanine green injections and a custom-built camera setup. All data were blinded before analysis and presented as mean ± standard deviation.
Mean contraction frequency and lymph propulsion velocity were 0.59 ± 0.13 minutes−1 and 1.51 ± 0.24 cm/s, respectively, with no significant difference during each 4 hours examination or between the two visits. The maximal pressure that the lymphatic flow in the vessels could overcome on test day 1 and 2 was 56 ± 9 mmHg and 57 ± 9 mmHg, respectively (p = 0.496). Local hyperthermia increased contraction frequency from 0.62 ± 0.4 minutes to 1.46 ± 0.5 minutes−1 (p < 0.05). Hypothermia caused no significant changes. Immediately after exercise (exercising at a simulated distance of 1.4 km on a cycle ergometer), an increase in lymph propulsion velocity from 1.5 ± 0.49 to 2.2 ± 0.63 cm/s was observed (p < 0.05); whereas contraction frequency was unaltered. A decrease in contraction frequency from 0.68 ± 0.25 minutes to 0.35 ± 0.19 minutes−1 was observed 10 minutes after exercise, without a change in velocity.
Conclusions:
NIRF imaging can be conducted for 4 hours without a change in lymphatic activity. Furthermore, it has the sensitivity to detect changes in lymphatic activity by local hyperthermia and exercise. No changes were seen after local hypothermia. Pumping pressure shows good repeatability, whereas the other parameters show poor repeatability.
Introduction
L
The transport of lymph is mainly the result of contractions that are generated by the collecting lymphatic vessels. 2 In vitro studies have, in recent years, led to the discovery of new knowledge about the nature of lymphatic vessels.3–5
Because of the limitations of available imaging techniques, there is still much to be learned about the lymph flow in humans in vivo. Near-infrared fluorescence (NIRF) imaging of lymphatic vessels or indocyanine green (ICG) lymphangiography was introduced on humans in 2007 and 2008.6,7 NIRF imaging provides a noninvasive way of visualizing lymphatic vessels in vivo, with a high spatial and temporal resolution. When the vessels contract, the pulsatile movement of lymph can be seen as moving “packets.” (Fig. 1) The frequency of the contractions and the velocity by which the packets are moving can be measured.
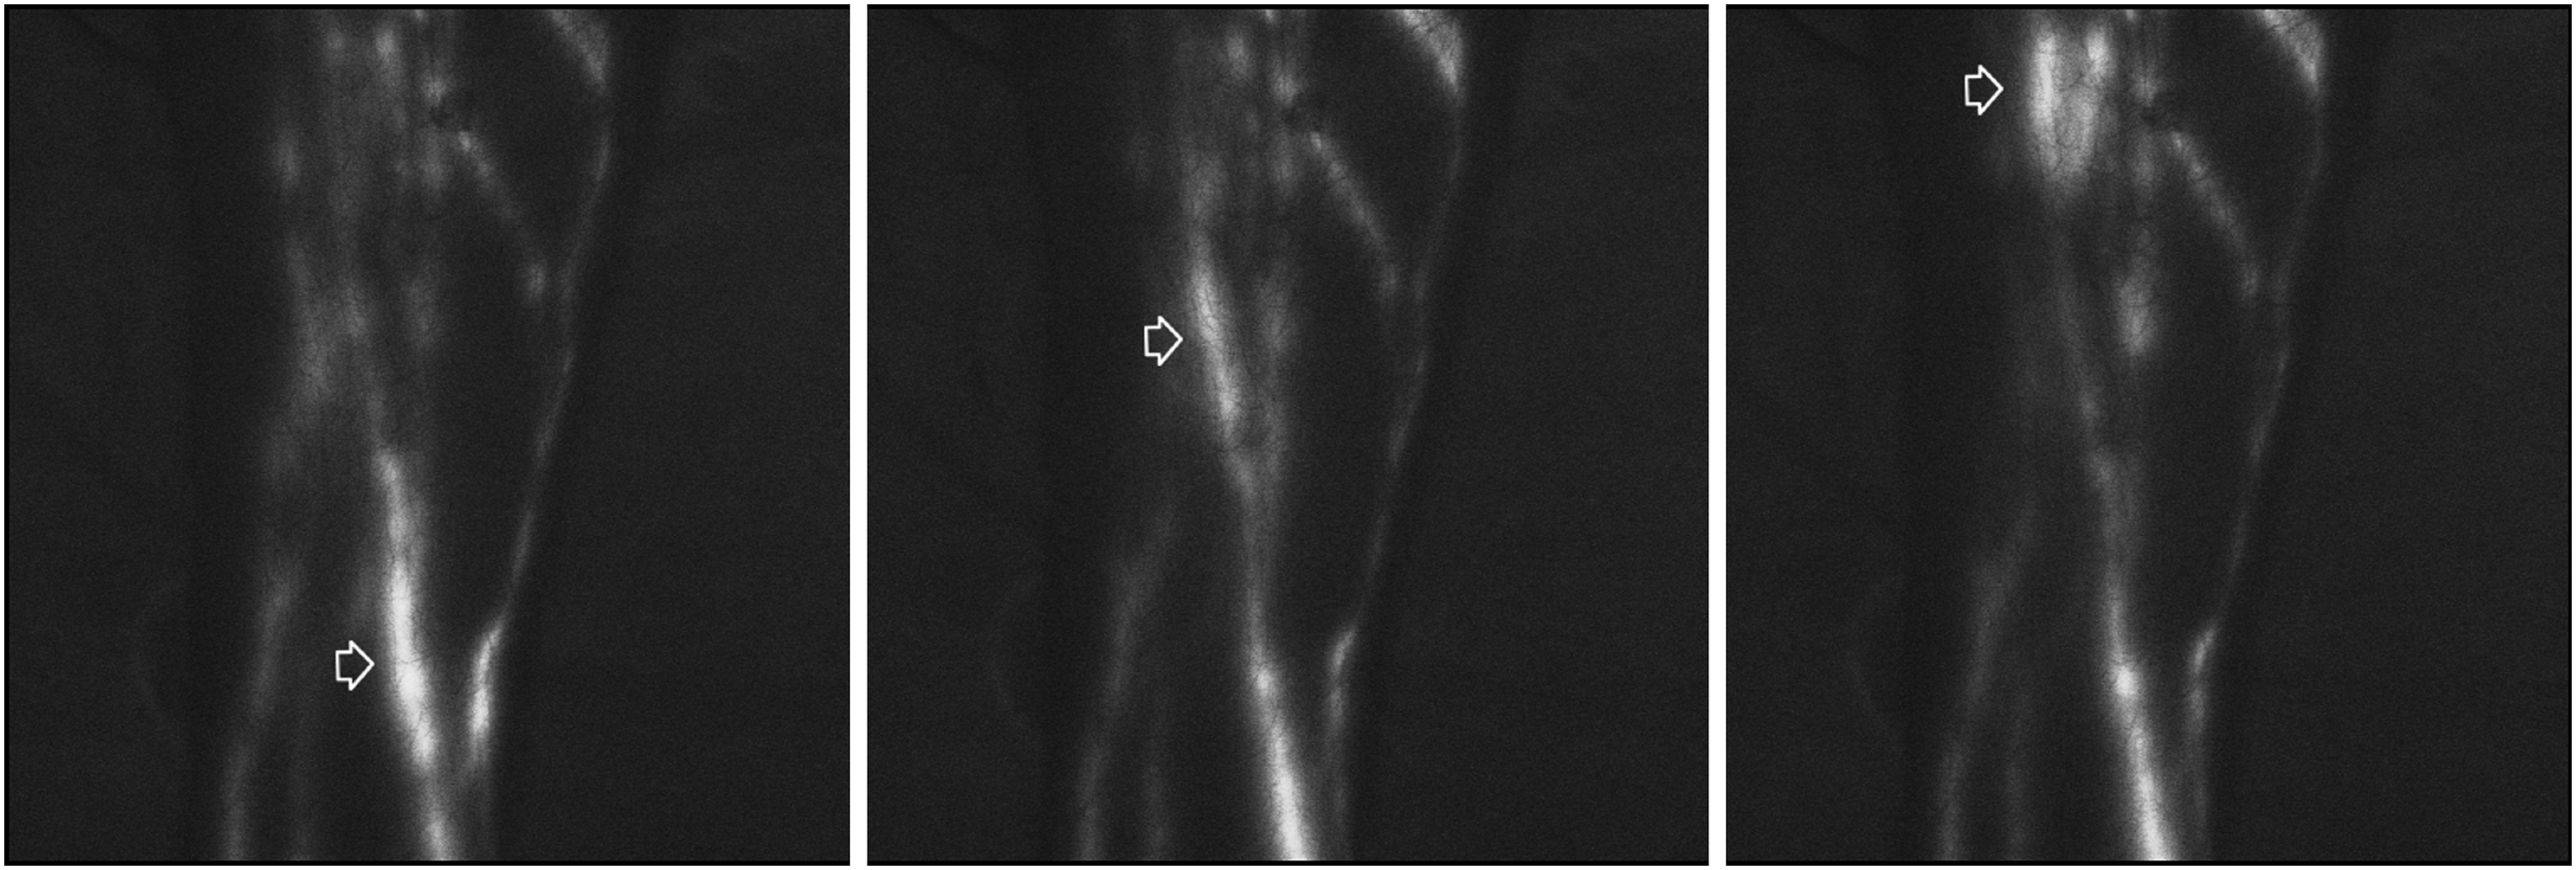
Images from a standard sequence. Illustrating the movement of a lymph propulsion (marked by an arrow).
Several animal studies have also used NIRF imaging to noninvasively examine the role of the lymphatics in conditions such as: salt-induced hypertension, 8 inflammation, 9 arthritis, 10 cancer, 11 and lymphadenectomy. 12 The technique is used clinically in some centers to diagnose and stage lymphedema and as the technique of choice in most centers for mapping lymphatic vessels before lymphatico-venous anastomosis surgery.
Near-infrared fluorescent imaging has the potential to become a new standard imaging technique for diagnosis and staging of lymphatic diseases, as well as an important research tool for understanding the complex pathophysiologies underlying the different types of lymphedemas. There is, however, no consensus on how imaging is conducted and used clinically. 13
The aim of this study was to examine the inter-individual and intra-individual variability of NIRF imaging in healthy volunteers and how time, temperature, and muscle activity affect the measured parameters.
Materials and Methods
NIRF imaging
Fluorescent dye, ICG, is injected into the dermis, and it is rapidly taken up by and stays in the lymphatic vessels. The dye is excited with a light source, and the resulting emission is collected with a near-infrared sensitive camera and displayed on a computer monitor.
Indocyanine Green (ICG; Nomeco, Denmark) was dissolved in isotonic saline, and 0.1 mL was injected, equivalent to a dose of 30.5 μg per injection site. All participants received three intradermal ICG injections on each foot, distally in the first and fourth intermetatarsal spaces, and behind the medial malleolus. The light source used for excitation of ICG was a custom-designed 785 nm 450mW laser (PowerTechnology, Arkansas), with a 780 ± 28 nm band-pass filter. ICG emission was collected by an electron-multiplier charged coupled device camera (C9100-13 Hamatsu, Japan), fitted with a Navitar lens (25 mm f0.95) and 835 ± 15 nm band-pass filters in front of and behind the lens. Image capture rate was between 2 and 3.33 seconds
Study design
Study subjects were positioned in the supine position in a standard hospital bed. Room temperature was maintained at ∼25°C. The subjects spent the first 15 minutes in the bed acclimatizing to position and temperature. Each subject underwent a study protocol scheduled to take ∼4.5 hours twice, with 2 weeks between examinations. The two examinations started before noon at approximately the same time to eliminate any diurnal changes. All sequences were made in the same area of the calf on the two visits.
Subjects
Study participants (n = 10) were healthy volunteers recruited via flyers at Aarhus University hospital. Inclusion criteria were: male 20–30 years; exclusion criteria were: lymphedema, edema, or venous diseases.
Outcome measures
Lymphatic function was assessed by using the following outcome measures: contraction frequency, packet velocity, pumping pressure, and refill time.
Contraction frequency
Regions of interests (ROIs) were plotted on all vessels, the intensity in the ROIs was measured, and a differentiated intensity curve was calculated and plotted. Contractions were seen as first a transient positive deflection and then a negative deflection. A contraction was defined as a combination of a significant valley of at least 100 ΔI/Δt in the differentiated intensity curve and visual confirmation on the computer screen that a packet, indeed, moved through the ROI. The number of events was counted over the 6-minute sequence obtained, and the frequency was calculated.
Packet velocity
Two ROIs were placed ∼10 cm apart on each vessel. Velocity was only measured in packets that moved continuously, without a pause, through both ROIs. For each packet, the valley-to-valley time difference on the differentiated intensity curve in the two ROIs was measured. Distances between the ROIs were calculated by using a calibration scale inserted into the beginning of each sequence. Packet velocity was calculated by dividing the packet transit time between the ROIs with the distance. Contraction frequency and packet velocity were analyzed in all standard sequences.
Pumping pressure is the maximal pressure that the contractile vessels can develop. It was estimated by inflating a standard sphygmomanometer cuff around the calf, after having manually emptied the lymph vessels under and proximally to the cuff. The cuff was inflated to 70 mmHg, and every 5 minutes the pressure was reduced by 5 mmHg, until lymph passed the cuff. Pumping pressure was measured both distally and proximally (Fig. 2). The distance from the cuff to the heel was measured, so that the cuff could be placed in the same region on the two different visits.
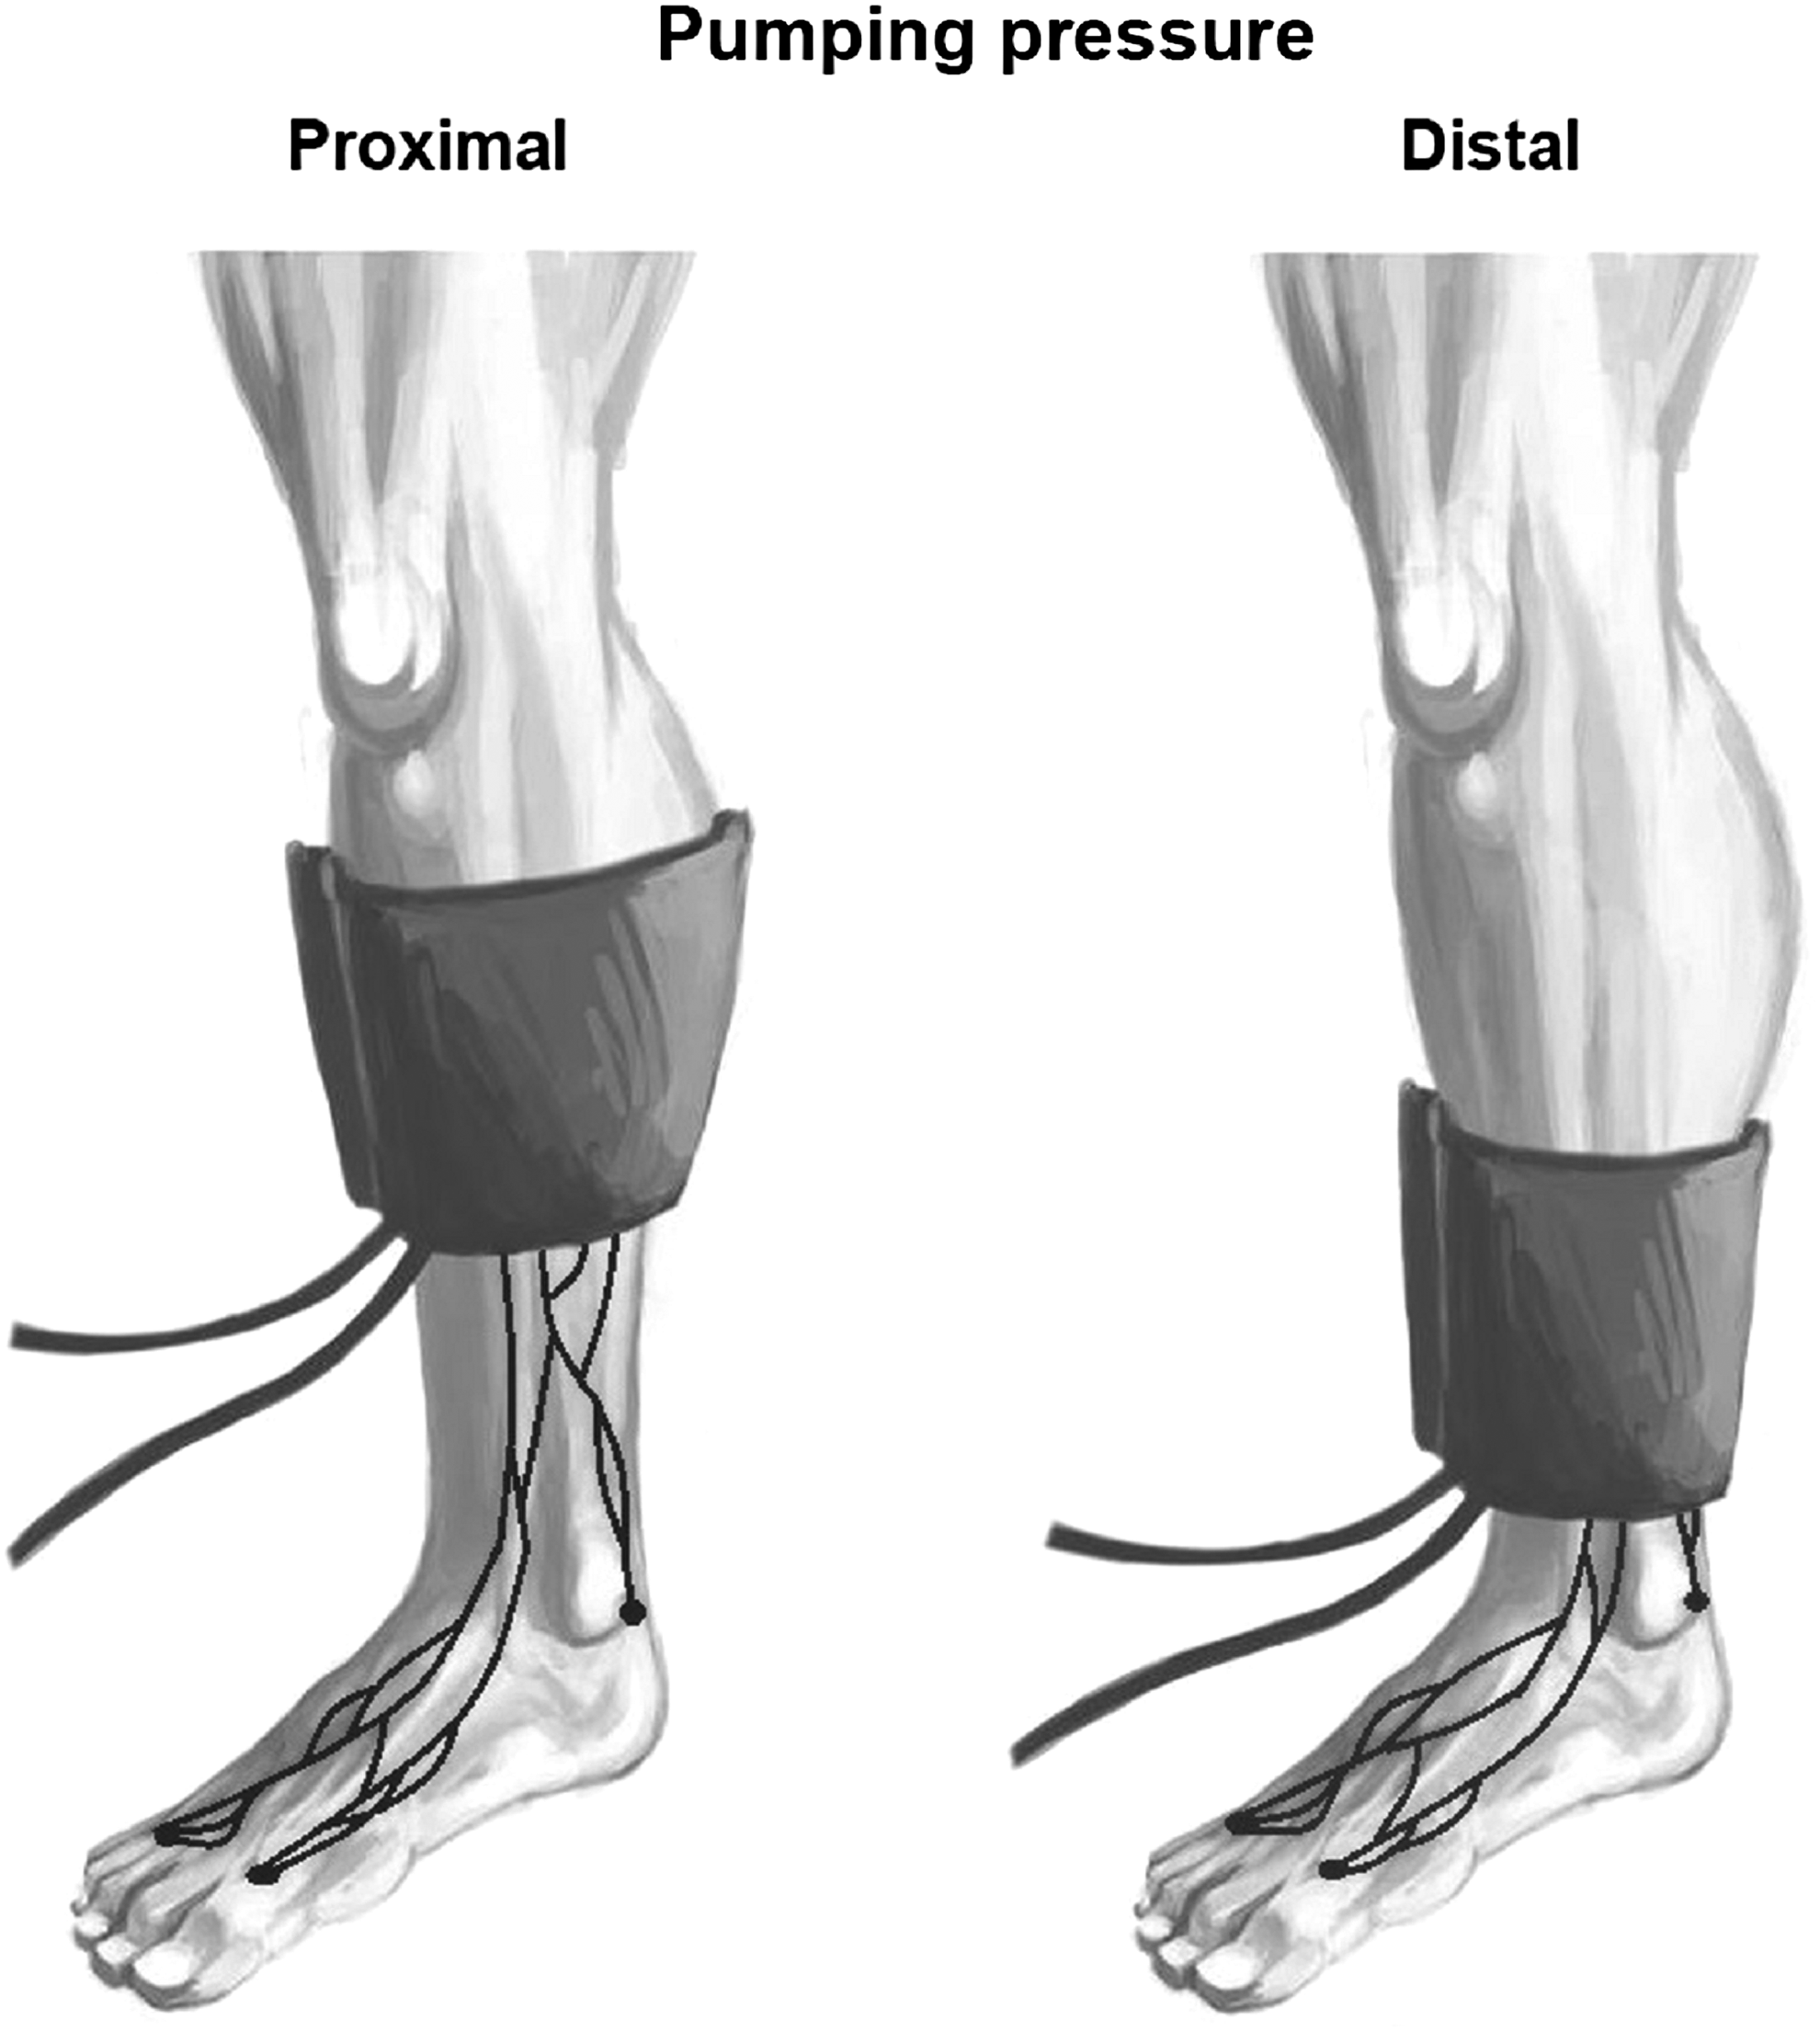
Illustration of pumping pressure. Showing proximal and distal cuff placements.
The refill time of a lymphatic vessel was defined as the time it took for the fastest vessel in a vessel network to refill after the whole network had been manually emptied. A tourniquet was applied for 1 minute, and the proximal vessels were manually emptied. After release, lymph flowed into the vessels, and the time that it took to refill 10 cm of the first vessels was noted. This was done three times, and an average value of these was used. The same vessels were examined on the two visits.
Study protocol
The first image sequence of the right leg was obtained during an injection of ICG. The foot and calf were then imaged for 3 minutes each, followed by a 4-minute pause. This was repeated three times. On the left leg, the calf was imaged for 30 minutes directly after the injections. The study protocol consisted hereafter of a number of 6-minute image sequences (standard sequences) that were obtained with the subject lying still and in relation to interventions followed by assessment of refill time and pumping pressure. Standard sequences were obtained both before and after the interventions to assess the effect of these. The detailed protocol is depicted in Figure 3. The three interventions were local hypo- and hyperthermia, and physical activity. For local hypo- and hyperthermia, the foot was immersed in cold (20°C) and warm (40°C) water, respectively, for 5 minutes. The physical activity consisted of an ergometer bike (Tunturi, F300), where all participants held a pace between 16 and 20 km/h (resistance 3), covering a calculated distance of roughly 1.4 km
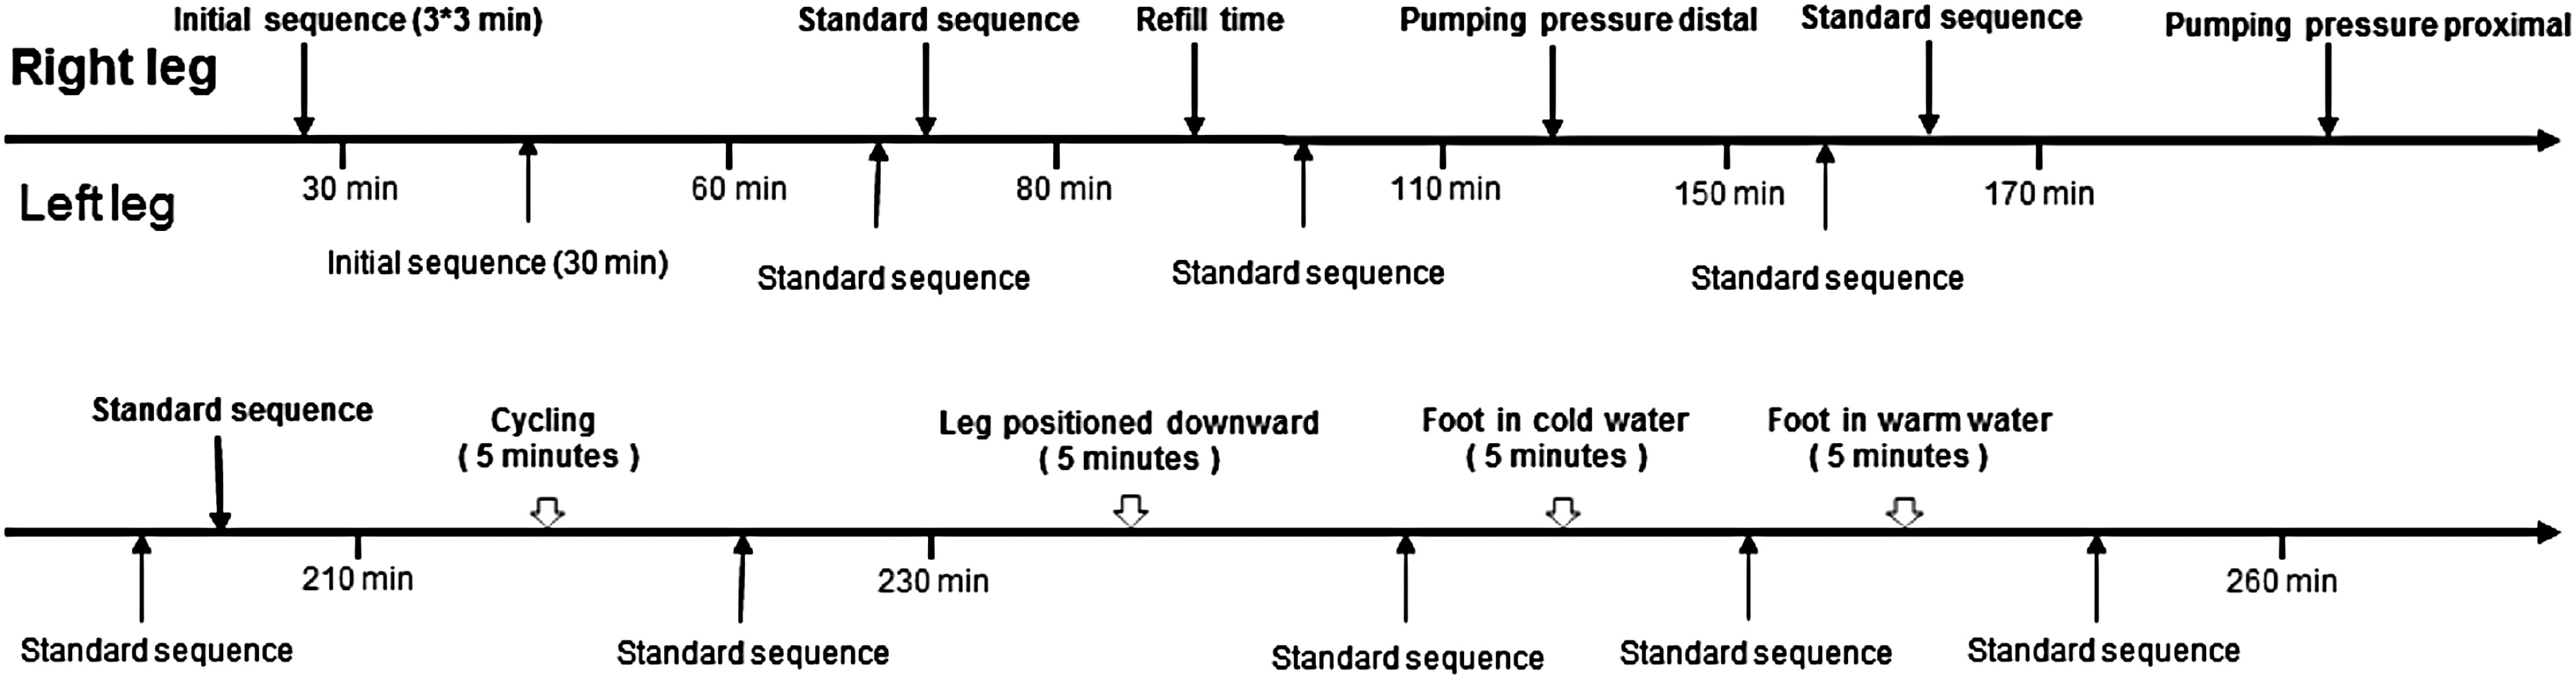
Flowchart illustrating the study protocol. The time in the chart is the approximate time after the first injection. (A standard sequence was a 6-minute sequence of the calf).
Data analysis and statistics
The sequences were analyzed by using a custom-written LabVIEW program (National Instruments, Texas). All sequences were blinded before analysis, and the blinding was revealed after all data analysis was completed. Before blinding, the first image sequence from each person was divided into four horizontal zones and the zone with the highest number of vessels was noted and used for analysis. This allowed placing the ROIs in roughly the same area throughout the data analysis despite the data being blinded. An ROI was placed in each measureable vessel in the sequence. In the presence of bifurcations, the ROI was placed upstream of it. The reported frequency and velocity are average for all vessels (total number of events/number of vessels).
All data were tested for normality and presented as mean ± standard deviation (SD). Using GraphPad Prism, data were tested for significance with either the paired Students t-test (data with two samples) or one-way analysis of variance (ANOVA) with Bonferroni's post-test (data with three or more samples). Significance level was set to 0.05 in all tests. Coefficient of variation (CV) was calculated by dividing the SD of the difference between the two compared measurements with the average of all measurements.
Ethical approval
Written informed consent was obtained from all study participants. The study was approved by The Central Denmark Region Committees on Health Research Ethics (1-10-72-528-12), and it was conducted in accordance with the Helsinki declaration. The study was registered at clinicaltrials.gov, under protocol ID: NIRF 2014.
Results
Near-infrared fluorescence imaging was successfully performed on all test subjects at both visits. Out of the 300 sequences acquired, 1 refill time sequence was discarded due to movements of the subject and 2 sequences could not be analyzed for velocity, because there were no propulsions to measure.
ICG was picked up visually by lymphatic vessels within 1 minute in 34 out of 40 injections (Supplementary Video 1; Supplementary Data are available online at www.liebertpub.com/Irb). After injection, an increasing number of vessels became visible, 2.2 ± 1.3 at 6 minutes, 2.8 ± 1.2 at 16 minutes, and 3.3 ± 1.5 at 26 minutes. After this, no further vessels appeared. There was an impression that the signal strength gradually decreased with time, which could not be quantified in a standardized manner given the design of the study protocol. Despite the impression of declining signal strength, the number of ROIs placed did not change during the 4-hours protocol, and we were able to analyze all sequences.
Contraction frequency and packet velocity
Contraction frequency on day 1 and day 2 ranged from 0.43 ± 0.16 minutes to 0.75 ± 0.36 minutes−1, and packet velocity ranged from 1.37 ± 0.31cm/s to 1.69 ± 0.65 cm/s (Fig. 4; Supplementary Video 2). One-way ANOVA showed no significant (p > 0.05) difference in lymphatic frequency or velocity over time, between the two visits or between the left leg and the right leg (p > 0.05). The mean contraction frequency on day 1 was 0.60 ± 0.23 minutes−1, and packet velocity was 1.51 ± 0.42 cm/s. The CV of the first measurement on the right leg, on the two visits was 86% for frequency and 37% for velocity.

Contraction frequency and packet velocity in standard sequences. Contraction frequency and packet velocity in right (A+C) and left leg (B+D) on day 1 (grey) and day 2 (black). Above each point, the average amount of ROIs placed in first and second visit is written. Data are presented as mean ± SD, n = 10. SD, standard deviation; ROIs, regions of interest.
The number of ROIs analyzed in each sequence did not change significantly over time (p > 0.05); for contraction frequency analysis, the average number for placed ROIs was 3.5 ± 0.2 and for packet velocity, it was 2.3 ± 0.2.
Pumping pressure and refill time
The average proximal pumping pressure on day 1 and 2 was 56 ± 9 and 57 ± 9 mmHg (p > 0.05), respectively, and similar to distal pressure on day 1 and 2, it was 57 ± 9 mmHg and 57 ± 9 mmHg, respectively (p > 0.05). When comparing proximal measurements on day 1 and 2, the CV was 12%. The average refill time was 215 ± 159 seconds and 166 ± 255 seconds on day 1 and 2, respectively (p = 0.366); the mean difference was −46 ± 152 seconds; and the CV was 80%.
Local hypo- and hyperthermia
Local hypothermia did not result in any changes. Local hyperthermia, induced by immersion of the foot in a 40°C water bath, resulted in a significant increase in contraction frequency from 0.62 ± 0.41 to 1.46 ± 0.50 (p < 0.05) (Fig. 5A). Packet velocity did not change, 1.67 ± 0.41 to 1.83 ± 0.64 (p > 0.05) (Fig. 5B).

The effect of local hyper- and hypothermia. Contraction frequency
Exercise
The contraction frequency immediately after the exercise intervention did not change: 0.68 ± 0.25 compared with earlier, 0.60 ± 2.78 (Fig. 6). However, 10 minutes after exercise, a significant decline in contraction frequency to 0.35 ± 0.19 minutes−1 was observed (p < 0.05). The packet velocity changed significantly (p < 0.05) from 1.50 ± 0.49 cm/s before exercise to 2.19 ± 0.63 cm/s immediately after exercise; however, after 10 minutes, it was 1.83 ± 0.64 cm/s (p > 0.05).
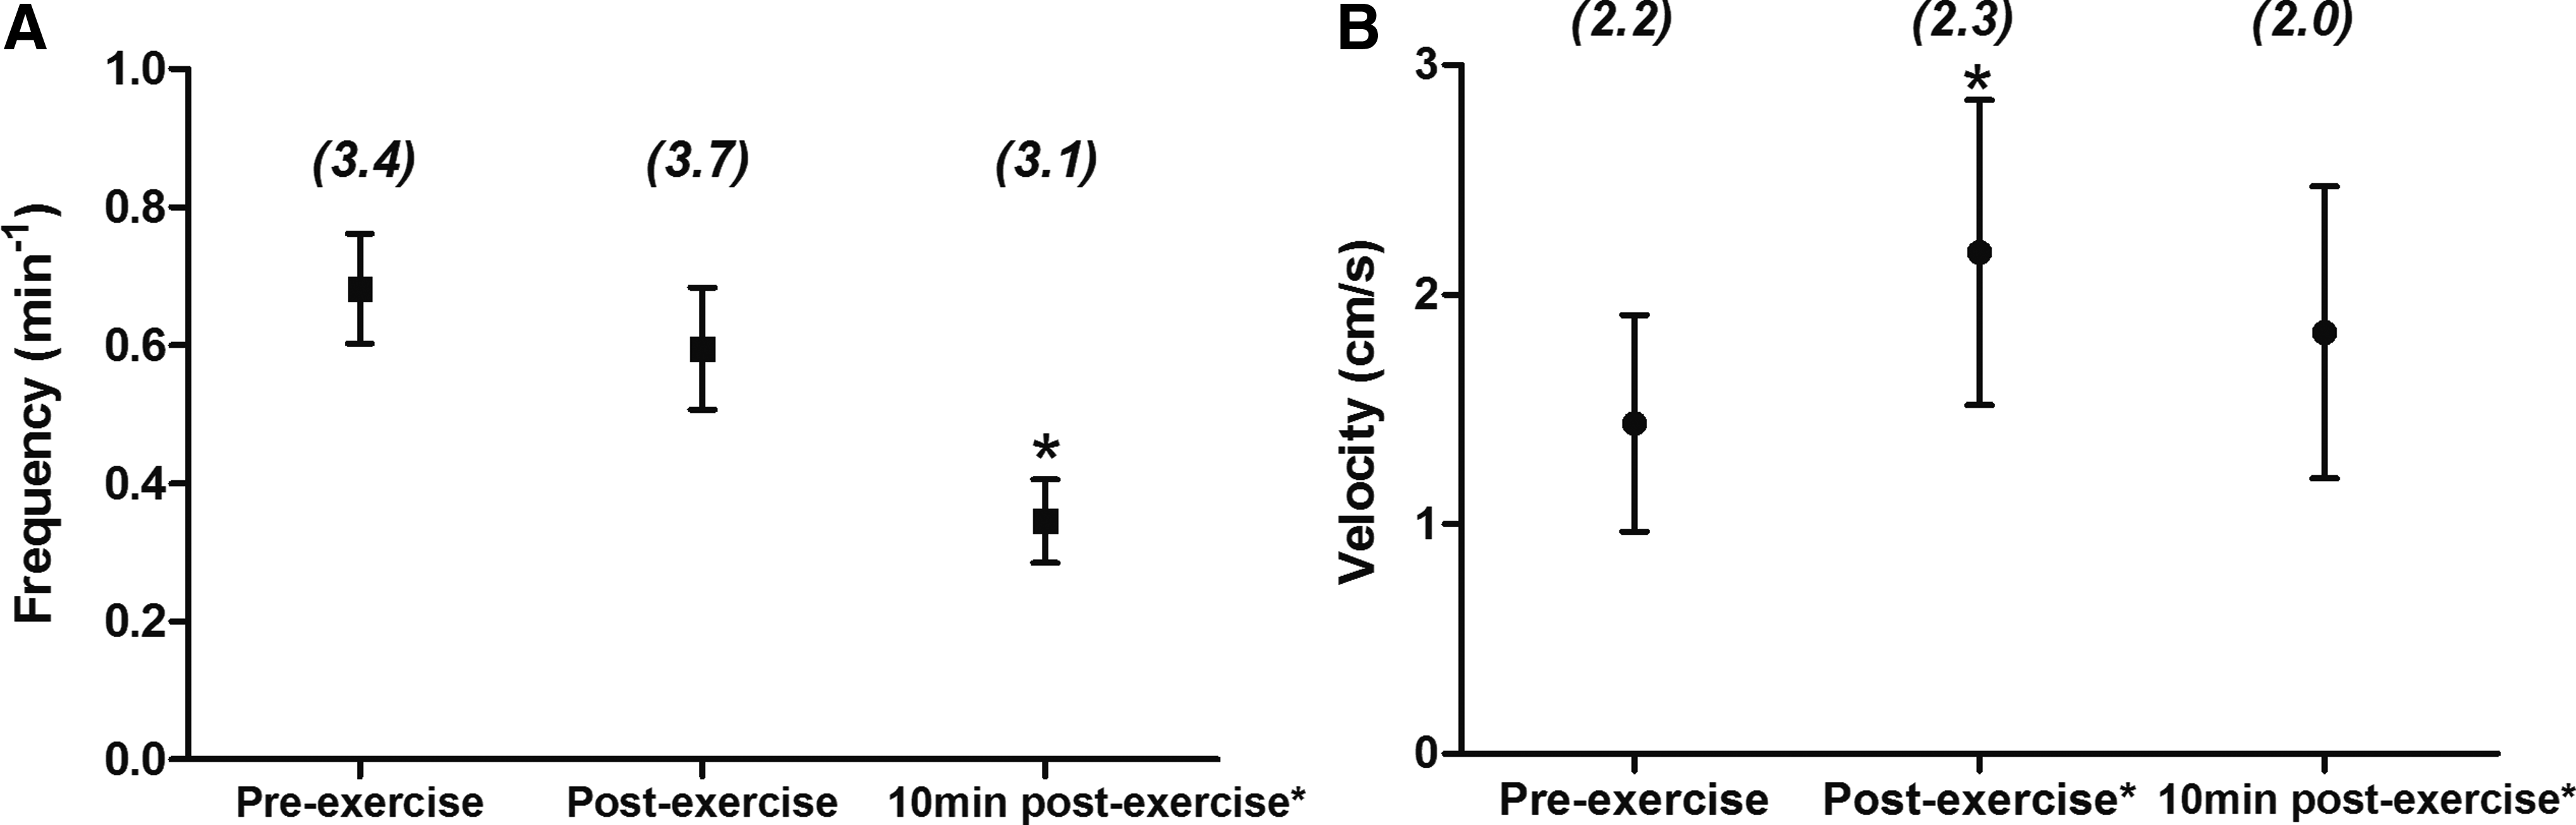
The effect of ergometer bike exercise. A-B Contraction frequency
Discussion
The aim of this study was to assess the repeatability of the functional parameters that can be obtained with NIRF imaging and how time, temperature, and exercise influence the measured parameters. We demonstrated that the technique is applicable and produces usable data in 99% of the measurements. There is sufficient dye uptake in lymphatic vessels, often within the first minutes after intradermal injection; it has a high degree of reproducibility from measurement to measurement over a 4 hour period and from day to day, with the highest degree of repeatability in the pumping pressure and the refill time and the lowest in contraction frequency. Heat results in an increased contraction rate, and exercise results in an immediate increase in velocity and a delayed (10 minutes after exercise) decrease in contraction frequency.
NIRF imaging is conducted by using both commercially available equipment and custom-built setups. The setups differ in specifications but have in common that they utilize a near-infrared sensitive camera and a light source to excite the only clinically approved NIR fluorophore, ICG. Some recommend the use of image intensifiers. 13 The dose of ICG used in NIRF imaging studies 13 varies between studies, from micro doses of 30 μg to doses as high as 25 mg, with the majority between 0.1 and 5 mg. In our study, we chose a dose of 30.5 μg per injection (91.5 μg per leg), because we 3 and others 7 have demonstrated the feasibility of using this dose for imaging. We are not aware of any study comparing the dose used and the quality of the imaging. In animals, it has, however, been shown that premixing ICG with albumin increases the signal-to-noise ratio. 14 These findings have not been confirmed in humans and from a patient safety perspective could be a problem because of the risk of hypersensitivity reactions. It is possible that a higher dose leads to a stronger signal and better imaging but it might also be relevant to keep the dose as low as possible to avoid any potential influence of the dye on the vessels. The dose administered in this study allowed imaging during the entire 4-hours study protocol.
Repeatability and changes with time
Neither packet velocity nor contraction frequency was altered during the 4 hours that the imaging was conducted. We tested repeatability by calculating the CV, which includes both the biological variation and the methodological accuracy. Of the measured parameters, only pumping pressure showed good repeatability with an acceptable CV (12%). Previous studies have shown contraction frequencies and packet velocities with large SDs,15,16 but it is unknown whether there is a high intraindividual variation in addition to the high interindividual variability. Both are important for estimating sample sizes in clinical studies. High interindividual variation increases the sample size necessary for studies in which groups are compared, whereas high intraindividual variability increases the sample size in crossover studies. To our knowledge, only a single study 16 has found a statistical difference of an intervention or disease on contraction frequency or packet velocity. It is possible that some studies have used too small sample sizes since power calculations are rarely reported in studies using NIRF imaging.
Lymphatic pumping parameters
The contraction frequency (0.60 ± 0.23 minutes−1) is within the range previously reported by Rasmussen et al 15 of 0.4 ± 0.3 minutes−1 and Tan et al 16 of 0.89 minutes−1. However, the packet velocity (1.51 ± 0.42 cm/s) is higher compared with the previously mentioned studies, 0.9 ± 0.7 cm/s 15 and 0.94 ± 0.80 cm/s. 16
The differences could be explained by the different demography in the cited studies with higher age and inclusion of women. Lower pumping pressure has been associated with high age and female gender, 17 and it is possible that packet velocity could be affected as well. Our pumping pressures are comparable to in vivo catheter measurements in human lymphatic vessels by Olszewski et al 18 and slightly higher than those reported with NIRF imaging by Unno et al. 17
In cannulated human lymphatic vessels, there is a high initial activity during the first hour after cannulation; thereafter, the frequency falls and stabilizes at 1–1.5 minutes−1. 18 This is slightly higher than our measurements, and, as such, is probably related to the methodology.
Interventions: hyperthermia and exercise
Both local hyperthermia and exercise, which are known to increase lymph flow,18,19 resulted in changes in lymphatic pumping that could be quantified with NIRF imaging. It is, however, interesting that different aspects of lymphatic pumping were affected. Local hyperthermia increased the frequency by 135% without affecting the velocity, whereas exercise increased the packet velocity by 52% without altering the frequency. The increased pumping necessary to remove the excessive fluid can be achieved by increasing either contraction frequency or stroke volume, and it is unclear as to what determines which parameters will change during conditions of increased lymph flow. Olszewski et al 19 measured flow after cannulating lymphatic vessels in healthy test subjects and found a 117% increase in lymphatic flow during local hyperthermia and an 83% increase after exercise, which is in agreement with our findings, although it is not possible to compare the exact numbers given the different measuring conditions. The delayed decrease in contraction frequency is a peculiar finding since skin blood flow is typically increased after exercise. 20 With a reduced blood vascular resistance, an increased fluid filtration and lymph production would be expected. We speculate that a possible explanation for the delayed reduction in contraction frequency could be that as blood flow and lymph production are returned to normal levels, lymph flow is maintained via an increased stroke volume whereas contraction frequency is reduced. It is also possible that late metabolic changes in the interstitial space could influence the lymphatic vessels.
Local hypothermia did not change the outcomes. If lymph flow is temperature dependent, which the hyperthermia experiments suggest, we would expect to see a fall in lymphatic activity with hypothermia. The temperature change during hypothermia was not as big as with hyperthermia. It is, therefore, possible that either the microcirculation is more affected by hyperthermia or rather large changes are needed to detect it with NIRF imaging.
Limitations
We used a fluorescent dye ICG, and there have been discussions on whether ICG influences lymphatic pupmping. 21 In vivo animal studies have shown conflicting results.22,23 We could not reproduce the inhibitory effect of ICG on lymphatic pumping in rats from the study by Weiler and Dixon, despite using a similar study design and a twice as large study population. However, we used one 10th of the dose (ICG/bodyweight) used in the study by Weiler and Dixon. In humans, ICG shows good correlation with lymphoscintigraphy for transit time 24 and pumping pressure. 25 ICG also shows good correlation with MR lymphangiography 26 for transit time. ICG has been used extensively in subjects with lymphedema without any published reports of adverse effects on their condition. Nevertheless, it is an important point when using NIRF imaging and describing “normal physiology” that it involves injection and excitation of a fluorescent dye. In the case of randomized trials, any potential effect would be irrelevant since both groups are exposed to the imaging.
We observed subjectively that signal strength declined with time. Unfortunately, this effect was not possible to quantify in a standardized manner since the study protocol was designed with shifting imaging between right and left leg. It was, therefore, not possible to align camera and laser in identical positions each time, which is necessary for such an analysis. The study protocol did not maintain the subjects in a supine resting position throughout the study day, which could have influenced the conclusion that the contraction frequency and packet velocity was unaltered by time. However, to a certain degree, this reflects on the nature of long experiments since these might require, for example, restroom visits.
Due to the rather poor fluorescent properties of ICG and light scattering, tissue penetration is limited. It has been estimated that NIRF imaging can be conducted up to a few centimeters beneath the skin. Information on lymph flow through deeper channels is, therefore, unfortunately missing.
Clinical perspective
In our study, we measured contraction frequency, packet velocity, refill time, and pumping pressure. These parameters probably reflect different aspects of lymphatic pumping. Both packet velocity and pumping pressure might relate to the contractile strength, whereas contraction frequency more reflects the activity of the vessels. Refill time is probably a combination of the previously mentioned parameters. Our findings show that NIRF imaging can be used to detect changes in lymphatic pumping after interventions that are known to affect lymphatic activity. A recent study 27 showed that a low pumping pressure was significantly associated with leg edema complaints and a lower quality of life in the general public. It is unclear whether contraction frequency, packet velocity, and refill time can be used in a similar manner, and further studies are needed to address this.
Stress lymphoscintigraphy is a test where exercise, temperature, or a pharmaceutical agent is used to stimulate the lymphatic system, to increase the test sensitivity. In our study, we found that both exercise and local hyperthermia have a significant impact on the activity of the lymphatic vessels. This could be highly relevant in future studies, to test whether the lymphatic system in disease has the capacity to handle an increased workload. From our results, it seems that warm water is the method of choice if you aim at increasing lymph formation and thus testing the capacity of the vessels to increase contraction frequency. There is currently no consensus as to whether ICG imaging should be performed immediately after injection or after, for example, 2 hours, during which the patients can move around freely (a sort of stress test).
Massage of the lymphatic vessels, known as manual lymph drainage (MLD), is used to increase downstream flow of lymph in inactive subjects. MLD is a potential “stress factor” that could be used to examine lymphatic vessels.
The information obtained from these interventions suggests that experimental conditions such as room temperature or allowing subjects to walk during the protocol can influence the results.
Conclusions
We have examined the use of near-infrared fluorescence imaging on healthy test subjects. We looked at the general limitations of the method, and found no significant changes over time, between legs or between visits. Repeatability was, however, poor for all measured parameters except pumping pressure. Based on our results, we conclude that it is possible to use NIRF imaging for at least 4 hours and that pumping pressure is the best end point in clinical studies to maintain as low study populations as possible. It is important to keep temperature and activity level standardized since heat and exercise have an impact on frequency and velocity, respectively. These data might be useful for detailing future study protocols using NIRF imaging.
Footnotes
Acknowledgments
The Danish Cancer Society and the Oak Foundation are acknowledged for their generous financial support of this project. The authors thank their kind participants for volunteering their time, Dr. Morten Olgaard Jensen for his help in developing the LabVIEW platform, and Thomas Grønlund for assisting with the artwork. Jacob Groenlund was the recipient of a scholarship from The Danish Cancer Society.
Author Disclosure Statement
No competing financial interests exist.
References
Supplementary Material
Please find the following supplemental material available below.
For Open Access articles published under a Creative Commons License, all supplemental material carries the same license as the article it is associated with.
For non-Open Access articles published, all supplemental material carries a non-exclusive license, and permission requests for re-use of supplemental material or any part of supplemental material shall be sent directly to the copyright owner as specified in the copyright notice associated with the article.