
Abstract
Abstract
Background:
This study aimed to evaluate posttreatment soft-tissue changes in patients with oral cancer with computed tomography (CT). To accomplish that purpose, a scoring system was established, referring to the criteria of lower leg lymphedema (LE).
Methods and Results:
One hundred and six necks in 95 patients who underwent oral oncologic surgery with neck dissection (ND) were analyzed retrospectively using routine follow-up CT images. A two-point scoring system to evaluate soft-tissue changes (so-called “LE score”) was established as follows: Necks with a “honeycombing” appearance were assigned 1 point. Necks with “taller than wide” fat lobules were assigned 1 point. Necks with neither appearance were assigned 0 points. Comparisons between patients with LE score ≥1 and LE score = 0 at 6 months postoperatively were performed using the Fisher exact test for discrete variables and the Mann–Whitney U test for continuous variables. Univariate predictors associated with posttreatment changes (i.e., LE score ≥1 at 6 months postoperatively) were entered into a multivariate logistic regression analysis. Values of p < 0.05 were considered to indicate statistical significance. The occurrence of the posttreatment soft-tissue changes was 32%. Multivariate logistic regression analysis showed that postoperative radiation therapy (RT) and bilateral ND were potential risk factors of posttreatment soft-tissue changes on CT images.
Conclusions:
Sequential evaluation of “honeycombing” and the “taller than wide” appearances on routine follow-up CT revealed the persistence of posttreatment soft-tissue changes in patients who underwent oral cancer treatment, and those potential risk factors were postoperative RT and bilateral ND.
Introduction
P
Identifying LE is problematic in itself because there is no objective assessment modality. 7 Although physical examination is considered sufficient for diagnosing head and neck LE, imaging examinations provide important supplemental guidance. 5 In a recent review, Deng et al. classified imaging modalities into two categories: (1) methods for evaluating the functional lymphatic structure and (2) those that identify tissue changes. 5 Computed tomography (CT) has been used to evaluate soft-tissue changes and is effective for identifying head and neck LE. 5 Another study provided evidence that facial edema assessed with CT scan could be an indicator of the prognosis for patients with head and neck cancer. 8
This study established the scoring system to evaluate the posttreatment soft-tissue changes by referring to the previous study about lower leg swelling. 9 By using this scoring system, the incidence of the posttreatment soft-tissue changes in oral cancer patients was determined, and those risk factors were identified. We also discuss the meaning of physiotherapy in patients who underwent oral cancer treatment.
Materials and Methods
This retrospective study included patients who underwent oral oncologic surgery with neck dissection (ND) at our department between 2006 and 2014. Histological diagnosis was squamous cell carcinoma in all cases. Patients who had recurrence at the primary site or the neck and secondary cervical lymph node metastases were excluded because the follow-up was not long enough to evaluate posttreatment soft-tissue changes. For evaluating posttreatment soft-tissue changes of necks, routine follow-up enhanced CT (6, 12, 18, and 24 months postoperatively) to monitor for tumor recurrence or metastasis was used. This retrospective study was performed under the Declaration of Helsinki. All patients had provided informed consent for the use of CT for the clinical study. Ethical approval was exempted by the institutional Medical Ethics Committee because of the retrospective nature of the study.
Medical records were reviewed to collect data about the patients' age and gender, smoking and alcohol drinking status, the primary site of the cancer, prognosis stage, the surgical procedure including extent of ND and type of simultaneous reconstruction, postoperative RT, chemotherapy, ligation of internal jugular vein (IJV), and postoperative local infection with abscess formation. For all the patients who underwent postoperative RT, the RT was initiated immediately after surgery. Hence, the postoperative RT was completed at the time of the CT scan 6 months after surgery.
CT assessment of LE
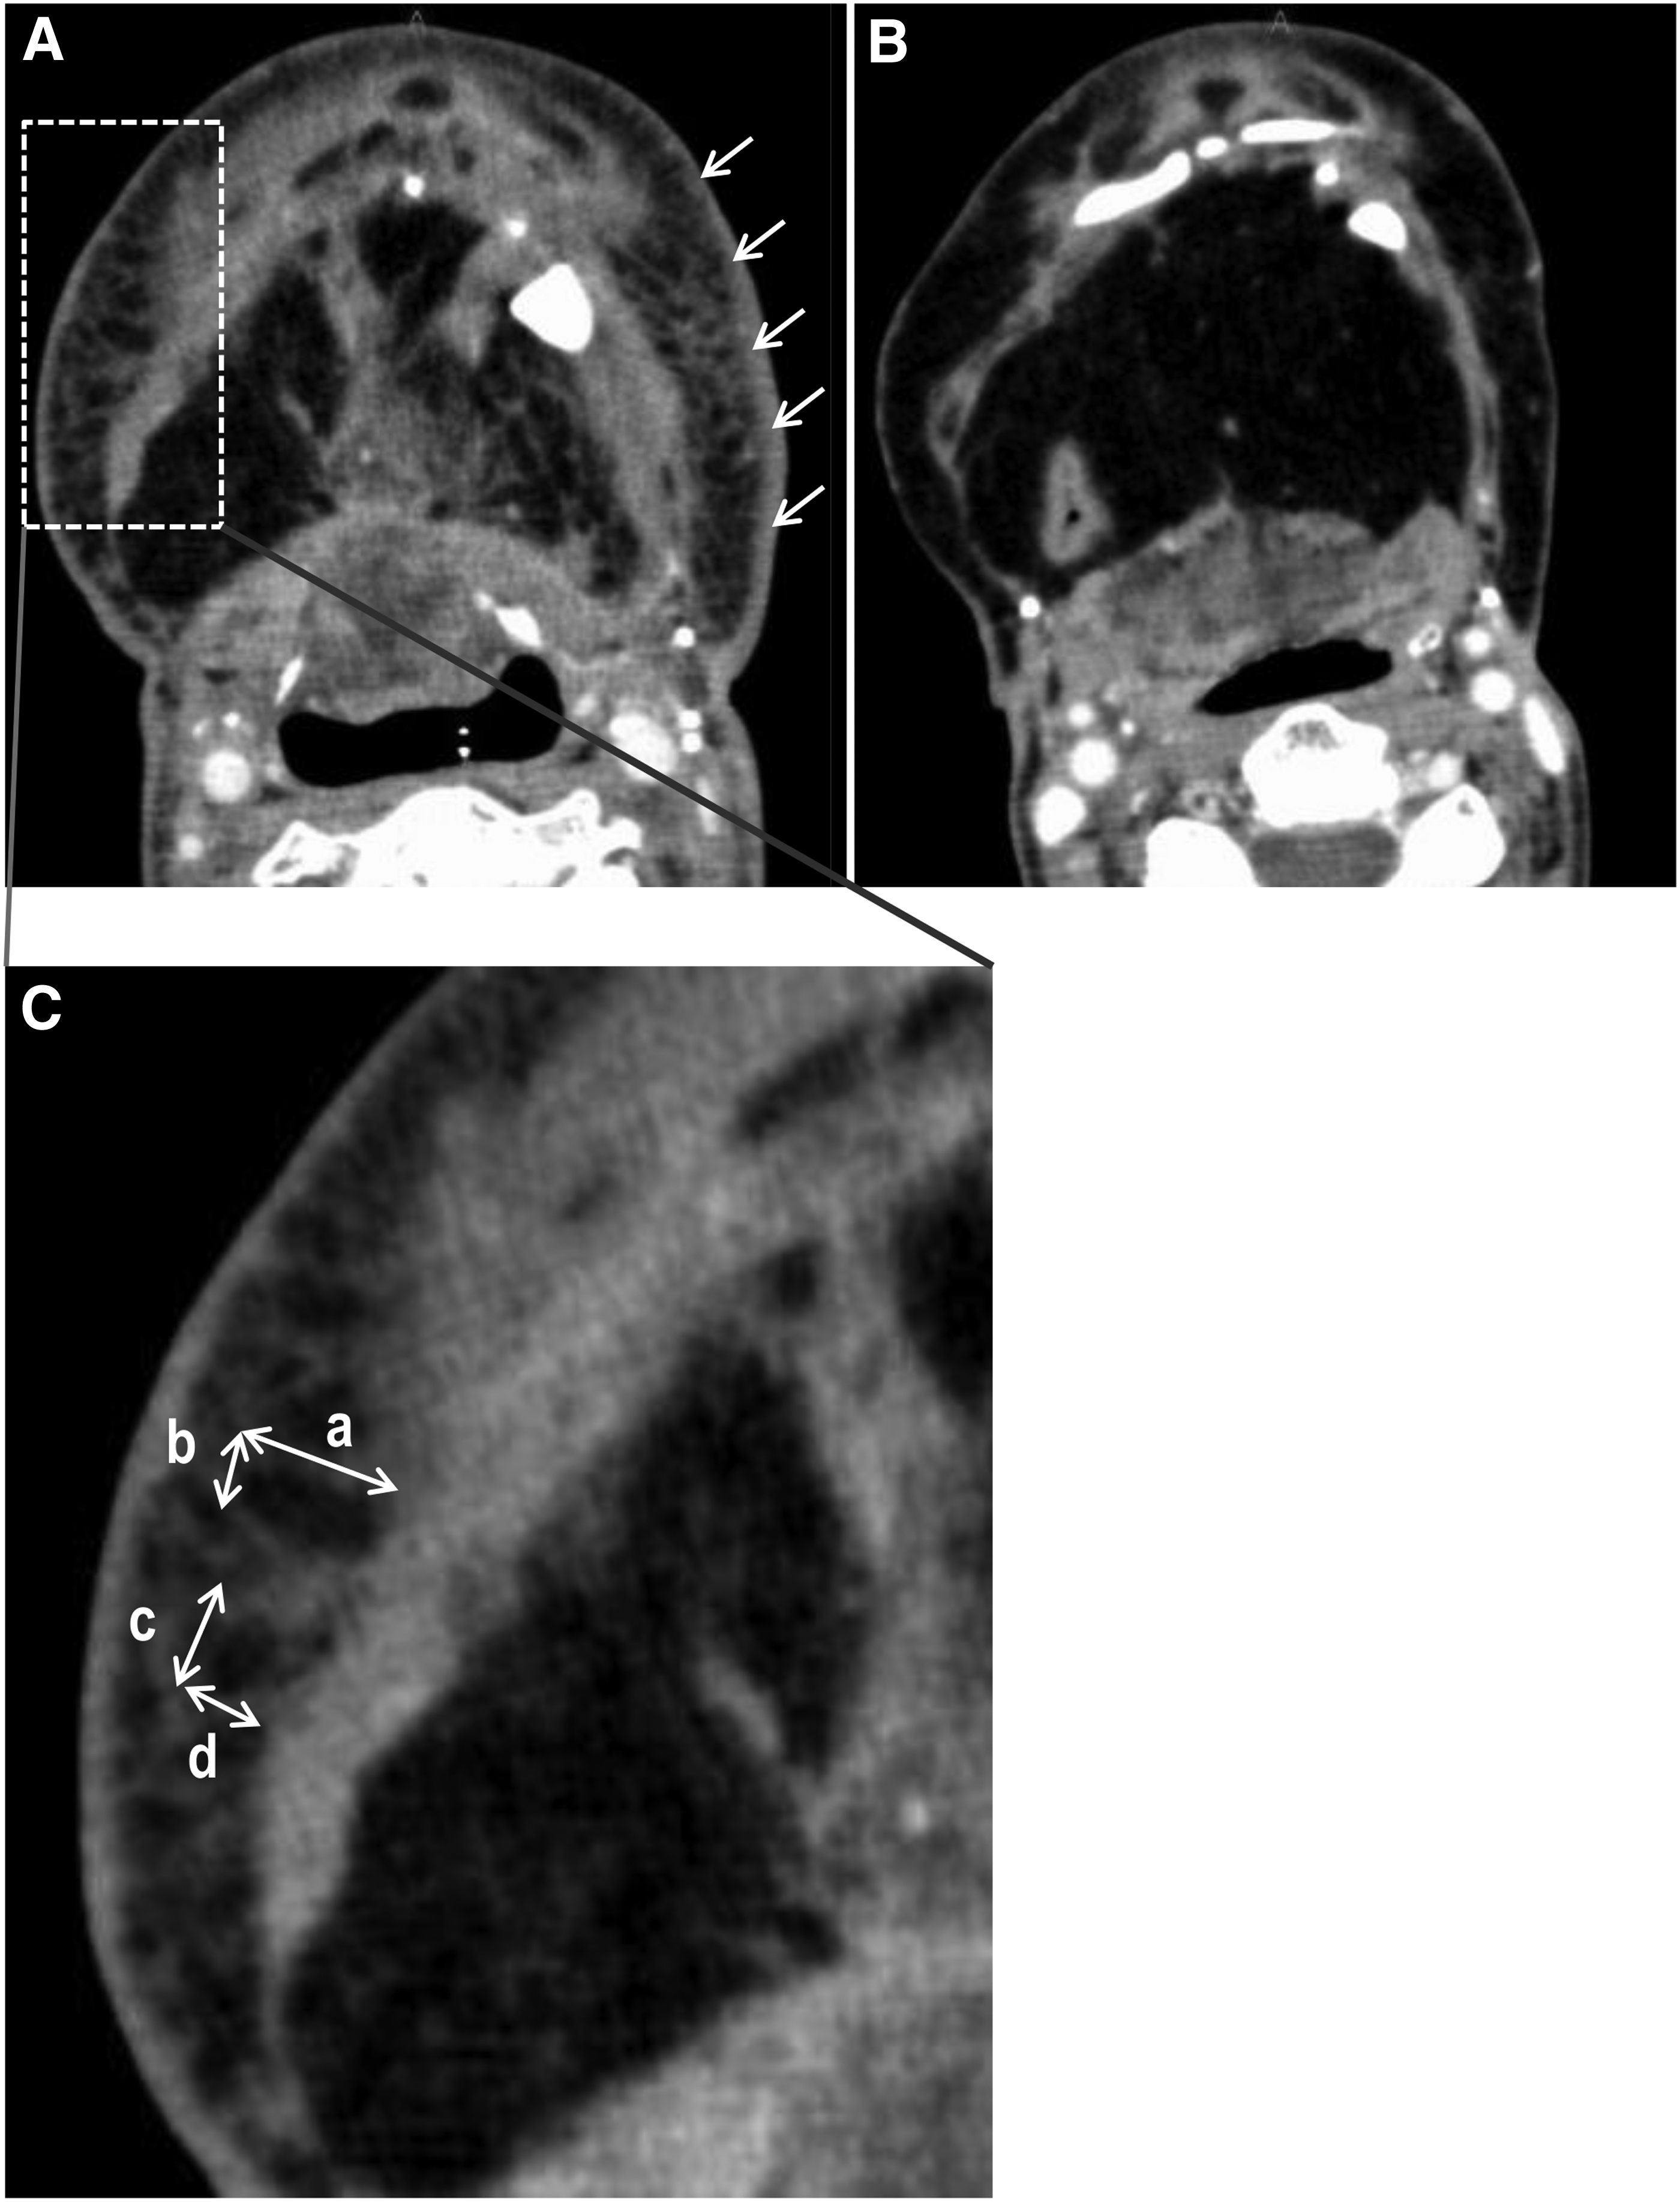
Two independent clinicians assessed the CT images in consensus. Discrepant results were solved by consecutive consensus readings. In a previous study, Shin et al. evaluated the same CT features (e.g., “honeycombing appearance” and “taller than wide” appearances of the fat lobules) that we use to compare LE, cellulitis, and generalized edema in regard to lower leg swelling. 9 Hadjis et al. reported the characteristic “honeycombing” pattern of the subcutaneous component on CT images of patients with primary LE of the lower leg. 10 “Honeycombing” appears as thickened interstitial tissues in the subcutaneous layer that cross each other and polygonally shaped fat attenuation with peripheral septa-like structures composed of fluid or fibrous tissue, or both.9,10 In addition, Shin et al. described the polygonally shaped fat lobules as having a “taller than wide” appearance if the diameter was greater in the perpendicular direction than in the horizontal direction. 7 Referring to these criteria of lower leg LE, a two-point scoring system was established as follows (so-called “LE score”): Necks in which the “honeycombing” appearance was observed on CT images were assigned 1 point (Fig. 1). Necks in which the “taller than wide” fat lobules were observed on CT images were assigned 1 point (Fig. 1). Necks in which neither “honeycombing” nor “taller than wide” appearances were observed on CT images were assigned 0 points (Fig. 1). Using this scale, the maximum LE score was 2.
Representative CT images of “honeycombing” and “taller than wide” appearance
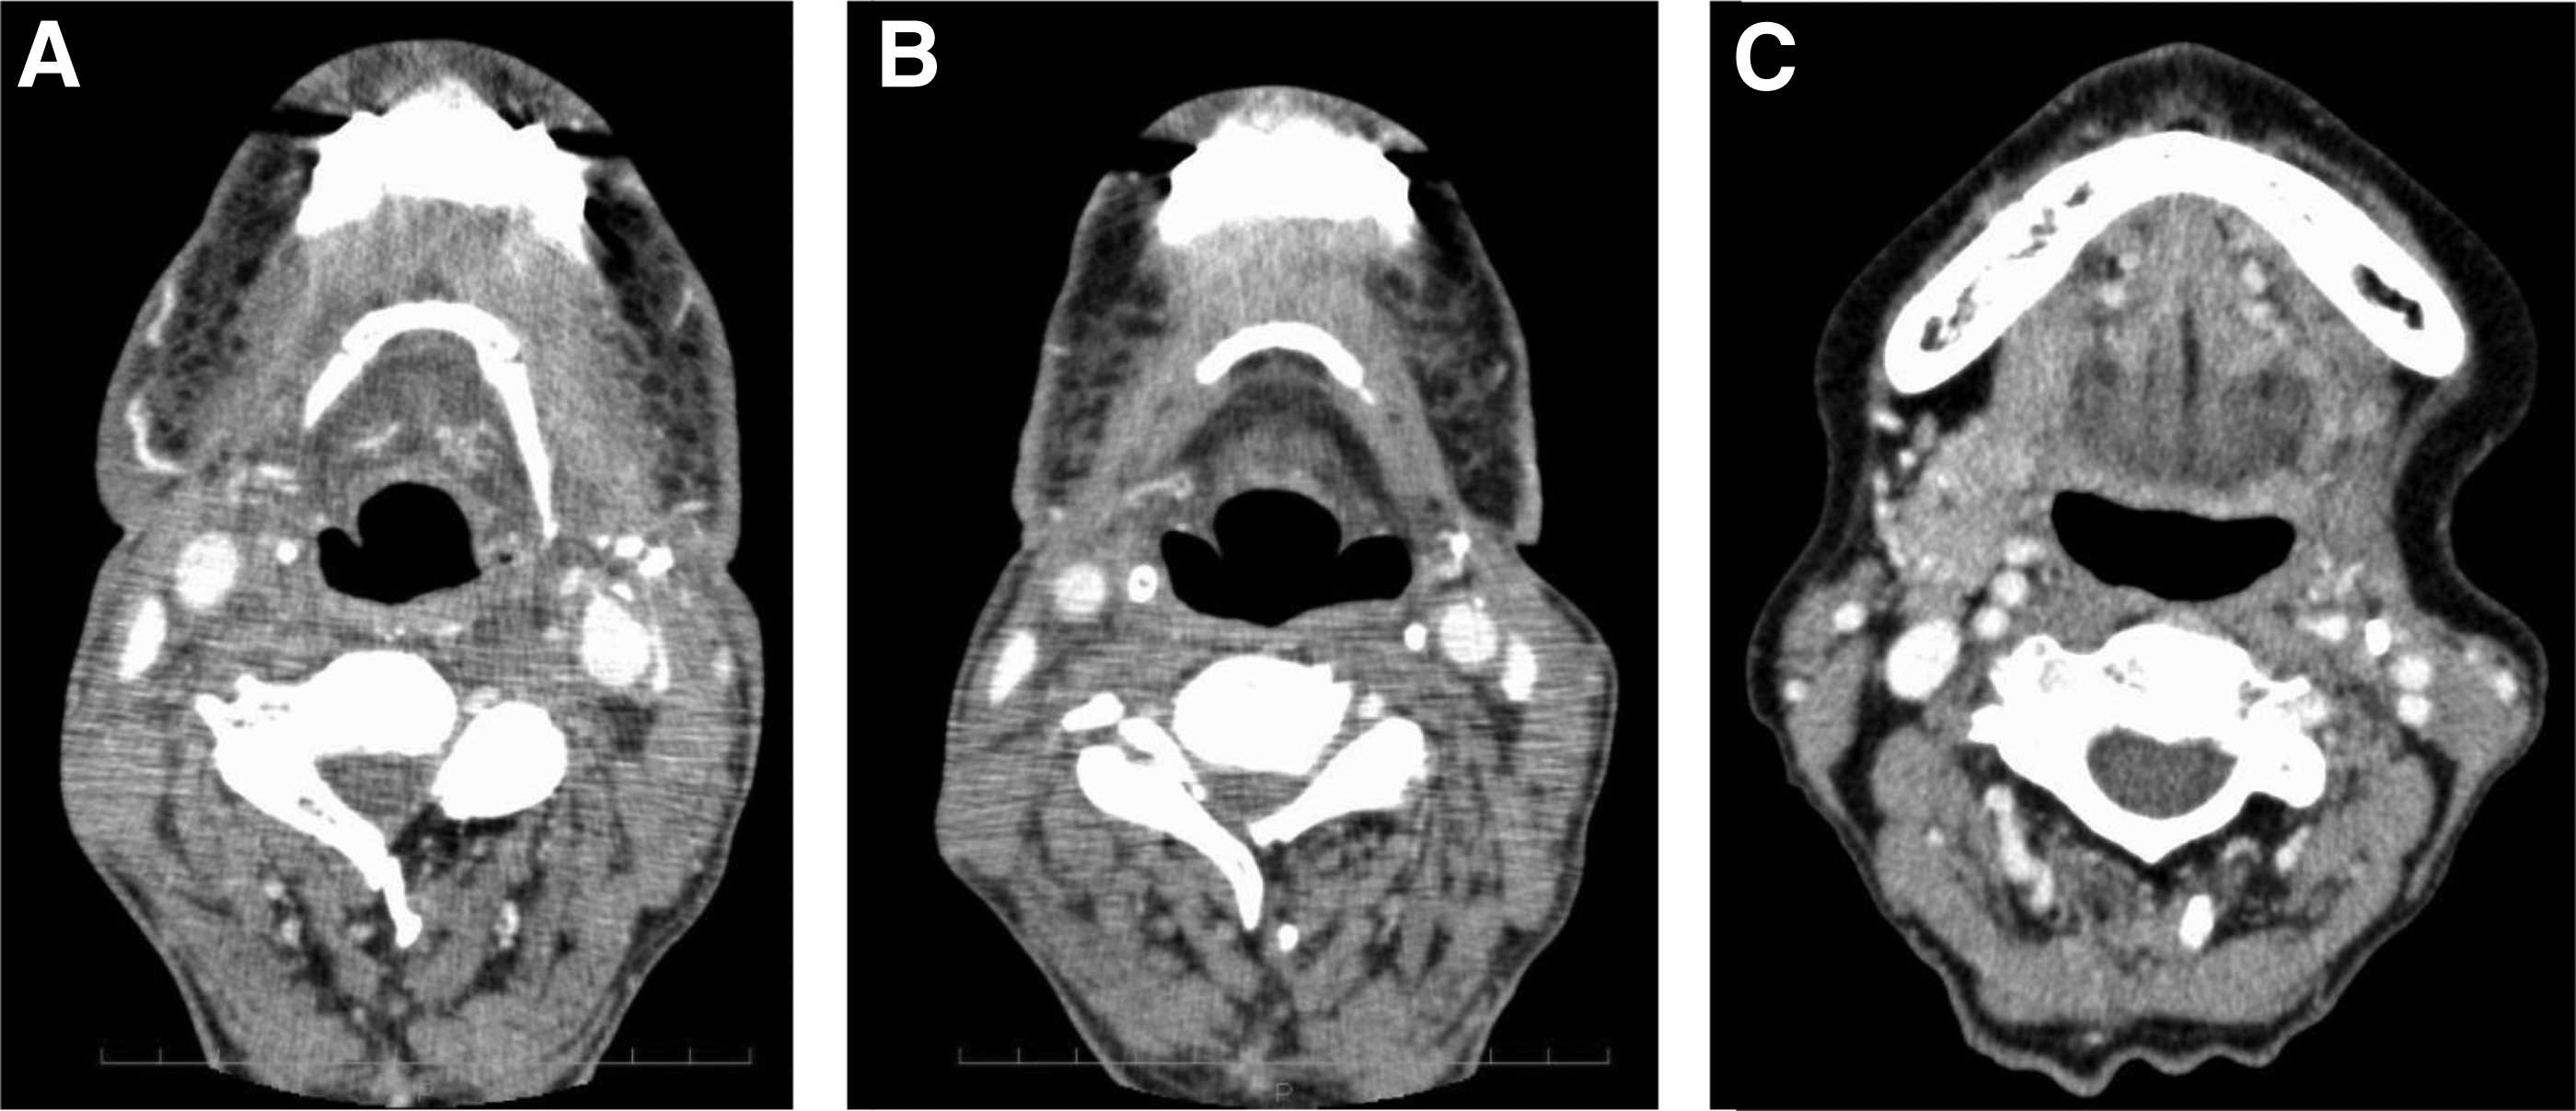
The representative images in two patients were shown in Figure 2. The persistence of “honeycombing” or “taller than wide” appearances on CT images was found at 6 (Fig. 2A) and 12 months (Fig. 2B) postoperatively in a 64-year-old male patient who underwent bilateral ND, segmental mandibulectomy, reconstruction with double free flaps (radial forearm and fibula), and postoperative concomitant chemoradiotherapy. On the other hand, “honeycombing” nor “taller than wide” appearances were not observed at 6 months operatively in a 71-year-old female patient who underwent supraomohyoid ND, partial maxillectomy, and reconstruction with free radial forearm flap (Fig. 2C).
Representative CT images of the long-term persistence of “honeycombing” nor “taller than wide” appearances at 6
Statistical analysis
The primary endpoints of this retrospective study were determination of the occurrence of abnormal CT findings (LE score ≥1) at 6 months postoperatively in patients who underwent oral oncologic surgery, and identification of those risk factors. The data were analyzed with R software (R Development Core Team, 2011). Comparisons between patients with LE score ≥1 and LE score = 0 at 6 months postoperatively were performed using the Fisher exact test for discrete variables and the Mann–Whitney U test for continuous variables. Logistic analyses were conducted to evaluate the relative influences of potential risk factors (bilateral ND, postoperative RT, chemotherapy, and IJV ligation). Subsequently, factors found by univariate analysis to be predictors whose odds ratios suggested an association with the abnormal CT findings (LE score ≥1) at 6 months postoperatively were entered into the final multivariate logistic regression analysis model. A p-value less than 0.05 was regarded as indicating statistical significance.
Results
Patients' characteristics are shown in Table 1. In all, 11 of 95 patients (12%) underwent bilateral ND. Thus, 106 necks were evaluated. Figure 3 shows the sequential change in the LE scores. The number of necks with an LE score of 2 decreased sequentially over time: 10 (9%) at 6 months, 3 (3%) at 12 months, 0 at 18 and 24 months. The most common pattern of change in the CT appearance for these necks was the “taller than wide” appearance diminishing first, followed by disappearance of the “honeycombing.” The number of necks with an LE score of 0 sequentially increased: 71 (67%) at 6 months, 95 (90%) at 12 months, 101 (95%) at 18 months, and 103 (97%) at 24 months. At 24 months postoperatively, “honeycombing” (i.e., LE score of 1) persisted only in 3 of 106 necks (3%).

Sequential decreases in the LE scores (2, 1, 0 points) over time. The presence of either a “honeycombing” appearance or “taller than wide” fat lobules is assigned a score of 1 point (dark gray columns). The presence of both conditions is assigned a total score of 2 (black columns). If neither condition is present, the score is 0 (light gray columns). LE, lymphedema.
Other free flaps: double free flap (forearm and fibula), latissimus dorsi, scapula.
Unless otherwise noted, data are reported as number (percentage) of study patients.
Pedicled flaps: pectoralis major, deltopectoral, cervical island.
IJV, internal jugular vein.
At 6 months postoperatively, the number of patients with LE score ≥1 was 30 (32%). The results of the Fisher exact test for discrete valuables and the Mann–Whitney U test showed that bilateral ND, postoperative RT, and chemotherapy-associated LE score ≥1 at 6 months postoperatively (Table 2). Results of the univariate logistic regression analysis showed that significant causative factors of the persistence of abnormal CT findings (LE score ≥1) at 6 months postoperatively were also bilateral ND, postoperative RT, and chemotherapy (Table 3). Subsequently, the results of the multivariate logistic regression analysis showed that only bilateral ND and postoperative RT were statistically relevant to LE score ≥1 at 6 months postoperatively (Table 3).
Unless otherwise noted, data are reported as number (percentage) of study patients.
By Mann–Whitney U test.
By Fisher exact test.
LE, lymphedema.
CI, confidence interval.
Overall, 66 of 95 patients (69%) had no potential risk factors (i.e., neither postoperative RT nor bilateral ND). A total of 11 of those 66 patients (17%) had an LE score ≥1 at 6 months postoperatively. At 18 and 24 months postoperatively, all patients without potential risk factors had LE score of 0. In contrast, the long-term persistence of abnormal CT findings (LE score ≥1 at 12, 18, and 24 months postoperatively) was significantly associated with postoperative RT but not bilateral ND (Table 4).
Data are reported as the number (percentage) of patients.
By Fisher exact test.
Discussion
This study showed that the scoring system using CT could reflect the state of posttreatment soft-tissue changes on the basis of the potential risk factors (postoperative RT and bilateral ND). In oral cancer patients, the percentage of posttreatment changes (i.e., LE score ≥1) at 6 months postoperatively was only 32%, and none of patients without the potential risk factors had posttreatment changes on CT images at 18 months postoperatively.
The characteristic CT findings were reported by Shin et al., who concluded that most patients with lower leg LE display skin thickening as well as “honeycombing” and “taller than wide” fat lobules. 9 Although another previous study reported that the “honeycombing” pattern is exclusive to LE and considered to be LE-specific, 10 Shin et al. noted that this pattern is also seen in patients' lower legs that suffer from cellulitis and generalized edema. Hence, this radiologic feature is not LE-specific. 9 It remains unclear, however, whether “honeycombing” and “taller than wide” appearances on CT images are LE-specific for head and neck cancer. It is also unclear whether these conditions eventually result in irreversible fibrosis and reduced quality of life. In a literature review, Deng et al. mentioned a fibrosclerotic process of LE in regard to an experimental study in mice. 5 The authors hypothesized that lymphatic stasis initiates a cycle of inflammation→progressive tissue fibrosis→worsening lymphatic function. They went on to show that inflammation is a critical regulator of tissue fibrosis and lymphatic dysfunction in murine LE. 11 In the current study, “honeycombing” and the “taller than wide” patterns on CT images are due to inflammation, fibrosis, and probably LE. In almost cases following oral cancer treatment, the lymphatic system is repaired or compensates for lymphatic damage, resulting in disappearance of the “honeycombing.”
Some previous methods for evaluating post-therapeutic head and neck LE were ultrasonography, 12 a moisture meter, 7 tape measurements,6,7 flexible fiberoptic endoscopic examination,2,13 and physical examination. 2 Although these methods play indispensable roles, medical and support staff should be trained to arrive at more accurate diagnoses. The scoring system used in this study is simple, necessitating only routine follow-up CT images. The strengths of this scoring system using routine follow-up CT are that the additional examinations are not required and that the evaluation is relatively easy even by less experienced medical staff. The results of this study indicate that the assessment of both “taller than wide” and “honeycombing” appearances contribute to the evaluation of post-therapeutic soft-tissue changes in the head and neck by medical and support staff.
Smith et al. reported the effectiveness of a head and neck cancer-specific regimen for treating external LE. 6 It included manual lymph drainage, tissue compression with bandaging and/or garments, remedial exercises, and skin care. 6 They started manual lymph drainage a minimum of 4–6 weeks postoperatively or waited until the RT regimen was completed. Patients' response to that treatment was significantly better in those who underwent surgery alone than in patients who underwent postoperative RT. 6 In this study, the “honeycombing” appearance did not persist in patients, who did not undergo bilateral ND and RT 18 months postoperatively. Other factors, such as ligation of IJV, local infection with abscess formation, and type of reconstruction—which were previously analyzed 8 —did not relate to the posttreatment change (LE score ≥1 at 6 months postoperatively). To determine whether the persistence of abnormal CT findings (i.e., “honeycombing,” “taller than wide” fat lobules) truly relate to reduced quality of life, a further study using an evaluation tool (e.g., Lymphedema Symptom Intensity and Distress Survey–Head and Neck used by Deng et al. 13 ) is required. Based on the results of this study and previously conducted studies, immediate initiation of physiotherapy in patients who undergo bilateral ND or RT for oral cancer may be meaningful.
In conclusion, the two-point scoring system used in this study is useful for identifying posttherapeutic tissue changes that are probably due to inflammation, fibrosis, and external LE. Sequential evaluation of “honeycombing” and the “taller than wide” appearances on routine follow-up CT showed that the incidence of posttreatment soft-tissue changes was 32% in patients who underwent oral cancer treatment, and those potential risk factors were postoperative RT and bilateral ND. The most important limitation of this study is the lack of investigation of correlation between LE score and clinical symptoms such as skin tightness, pain, body image, trismus, and dysphagia. Further study is needed to analyze the relation between patients' symptoms and the abnormal CT findings (“honeycombing” and “taller than wide” appearances).
Footnotes
Author Disclosure Statement
No competing financial interests exist.