
Abstract
Abstract
Introduction:
The clinical assessment of unilateral limb lymphedema is commonly based on measurements of interlimb volume differences. Reference values for interlimb percentage differences of the volume, fat mass, and lean mass measured with dual-energy X-ray absorptiometry (DXA) scan are, however, not established. The aim of the study was to establish and categorize these reference values in normal limbs.
Methods and Results:
DXA scans of the normal arms of 167 and normal legs of 196 melanoma patients (aged 18–75 years, body mass index <40), respectively, were performed. The interlimb percentage difference is calculated as follows: (“Limb-of-interest”—contralateral)/contralateral × 100. The interlimb percentage differences for the limb-of-interest were stratified to upper (according to handedness) and lower limbs and categorized as none/mild, moderate, or severe, respectively, based on whether the value is below, in between, or above the two prediction limits. The prediction limits for interlimb total volume percentage difference were 6% and 10%, 0% and 4%, and 3% and 6% for the dominant arm, nondominant arm, and leg, respectively. Further data are given for interlimb percentage differences of regional (upper arm, lower arm, hand, thigh, lower leg, and foot) and total volume, fat mass, and lean mass, respectively.
Conclusions:
The provided clinical reference values allow for identifying and categorizing pathophysiological differences of limbs-of-interest and evaluating tissue composition.
Introduction
T
Identifying pathological interlimb volume and tissue composition differences is dependent on a reliable method for assessing volume and tissue composition, and reference values for the population of interest.
Various methods for limb volume measurements with varying accuracy exist.1,3 We have previously shown that the repeatability of volume measurements of the arm obtained with dual-energy X-ray absorptiometry (DXA) scan is excellent compared to circumference measurements and water displacement. 1 The same applies to the repeatability of the volume measurement obtained with DXA of the legs, and in particular the thigh and lower leg. 3 DXA is a reliable method that is easy to perform, relies on computer-based registration, and allows for data analysis of selected regions. DXA has been used in studies assessing limb lymphedema.4,5 However, to use DXA for evaluation of interlimb differences, sufficient reference values have to be established. To our knowledge, no such reference values are currently available. The aim of this study was therefore to provide reference values for the volume and tissue composition differences between normal limbs in the population of interest.
Materials and Methods
Participants
In an effort to provide reference values in melanoma patients, this study included patients participating in a cross-sectional study on Health-related quality of life and surgical morbidity in melanoma patients (HRQL study). In brief, participants were 431 individuals (aged 18–75 years) who, at least, 1 year previously had been treated for cutaneous melanoma with wide local excision, axillary or inguinal sentinel lymph node biopsy alone, and/or complete lymph node dissection. All patients were clinical stage IA-III (American Joint Committee on Cancer [AJCC] 7th edition) at the time of diagnosis, and none of the included patients had an evidence of metastatic disease.
The exclusion criteria were body mass index (BMI) >40, previous lymph node surgery or major surgery affecting symmetry, or artifacts in the not-at-risk limbs, which were included in the study. Artifacts were, for example, heavily attenuating implants or jewelry that could not come off. The DXA scans of the arms of patients who had been treated for melanoma on the trunk or the legs with lymph node surgery in the groin were included for the reference material for arms. The DXA scans of legs of patients who had been treated for melanoma on the neck, trunk, or the arms and lymph node surgery in the axillary were included in the reference material for legs.
All participants gave written informed consent to participate in the study. The height was measured to the nearest 0.01 m using a stadiometer and the body weight was measured to the nearest 0.1 kg in minimal clothing using a SECA weight scale (Hamburg, Germany) before the scan. The study was approved by the Danish Regional Committee on Biomedical Research Ethics (r. no.: H-4-2014-127), the Danish Data Protection Agency (2012-58-0004, local no.: HEH-2015-003, I-Suite no.: 03436), and the Danish Melanoma Group, registered with ClinicalTrials.gov (Identifier: NCT02352623), and conducted in accordance with the Helsinki Declaration of 1975, as revised in 2008.
DXA scans of the limbs
Scan of the arms and legs were performed using the same DXA scanner (Lunar Prodigy DXA mini fan beam scanner serial number DF +13189, GE Medical Systems, Madison, WI) as previously described.1,3
The legs were scanned as part of a whole-body scan and analyzed with the following software: Prodigy med enCore version 15, GE Medical Systems, Madison, WI. The arms were scanned separately and analyzed with the following software: Small Animal Programme version 8.1027, individual analysis version, GE Medical Systems, Madison, WI. A standardized quality control was carried out daily with a variable composition phantom (Lunar, GE Medical Systems, Madison, WI). A standardized weekly control of the precision of the bone mineral density measurement was conducted with a spine phantom encased in an epoxy-resin block (Serial number 35357, Lunar, GE Medical Systems, Madison, WI).
Each arm was scanned separately. The patients were lying supine slightly oblique on the scan table to ensure that the arm was positioned parallel with the scan table and with space between the arm and the rest of the body. The hands were positioned palms down to ensure both have a similar degree of rotation of the wrist and to prevent movement of the hand and arm during the scan. Scanning time was ∼3 min per arm.
For the scan of the legs, the participants were consistently positioned lying supine on the scan table with the head at the top end of the table just below the upper scan margin. If the patient was taller than the scanning area, the head was positioned just above the upper scan margin to ensure sufficient scan lines of the lower extremities. The patients were centered within the sides of the table scan margins. The arms were placed straight or pointing slightly outward from the patient's side with a space between the patient's arms and sides. The hands were positioned palms down and not overlapping with the thighs. If the patient's arm and/or hand could not fit within the lateral scan margins, the arm and/or hand was positioned just outside the lateral scan margin to ensure no overlap of the upper limbs with the lower limbs. The legs were kept anatomically positioned with the feet slightly apart. A Velcro strap was placed around the feet to prevent rotation of the lower legs and feet. Scanning time was 8–12 min, depending on the size of the participant. Standardized preparation (e.g., lightly dressed, trousers and socks/stockings off, no metal items, jewelry, or watches, and daytime scan) was applied for all participants.
Data processing and analysis
All images were assessed for correct automatic point typing of bone, air, and tissue and corrected if necessary. All regions of interest (ROIs) were drawn by one observer (first author). ROIs of the arm were manually drawn for the upper arm, lower arm, and hand using a simple mathematical algorithm and anatomical landmarks (Fig. 1). The upper border of the arm was drawn perpendicular to the body of the humeral bone at a point separating the proximal 1/3 and the distal 2/3 of the humerus. The upper border of the lower arm was drawn crossing to the elbow at the level of the humero-antebrachial joint space. The anatomical border of the hand was drawn as a line connecting the distal radial and ulnar styloid processes.
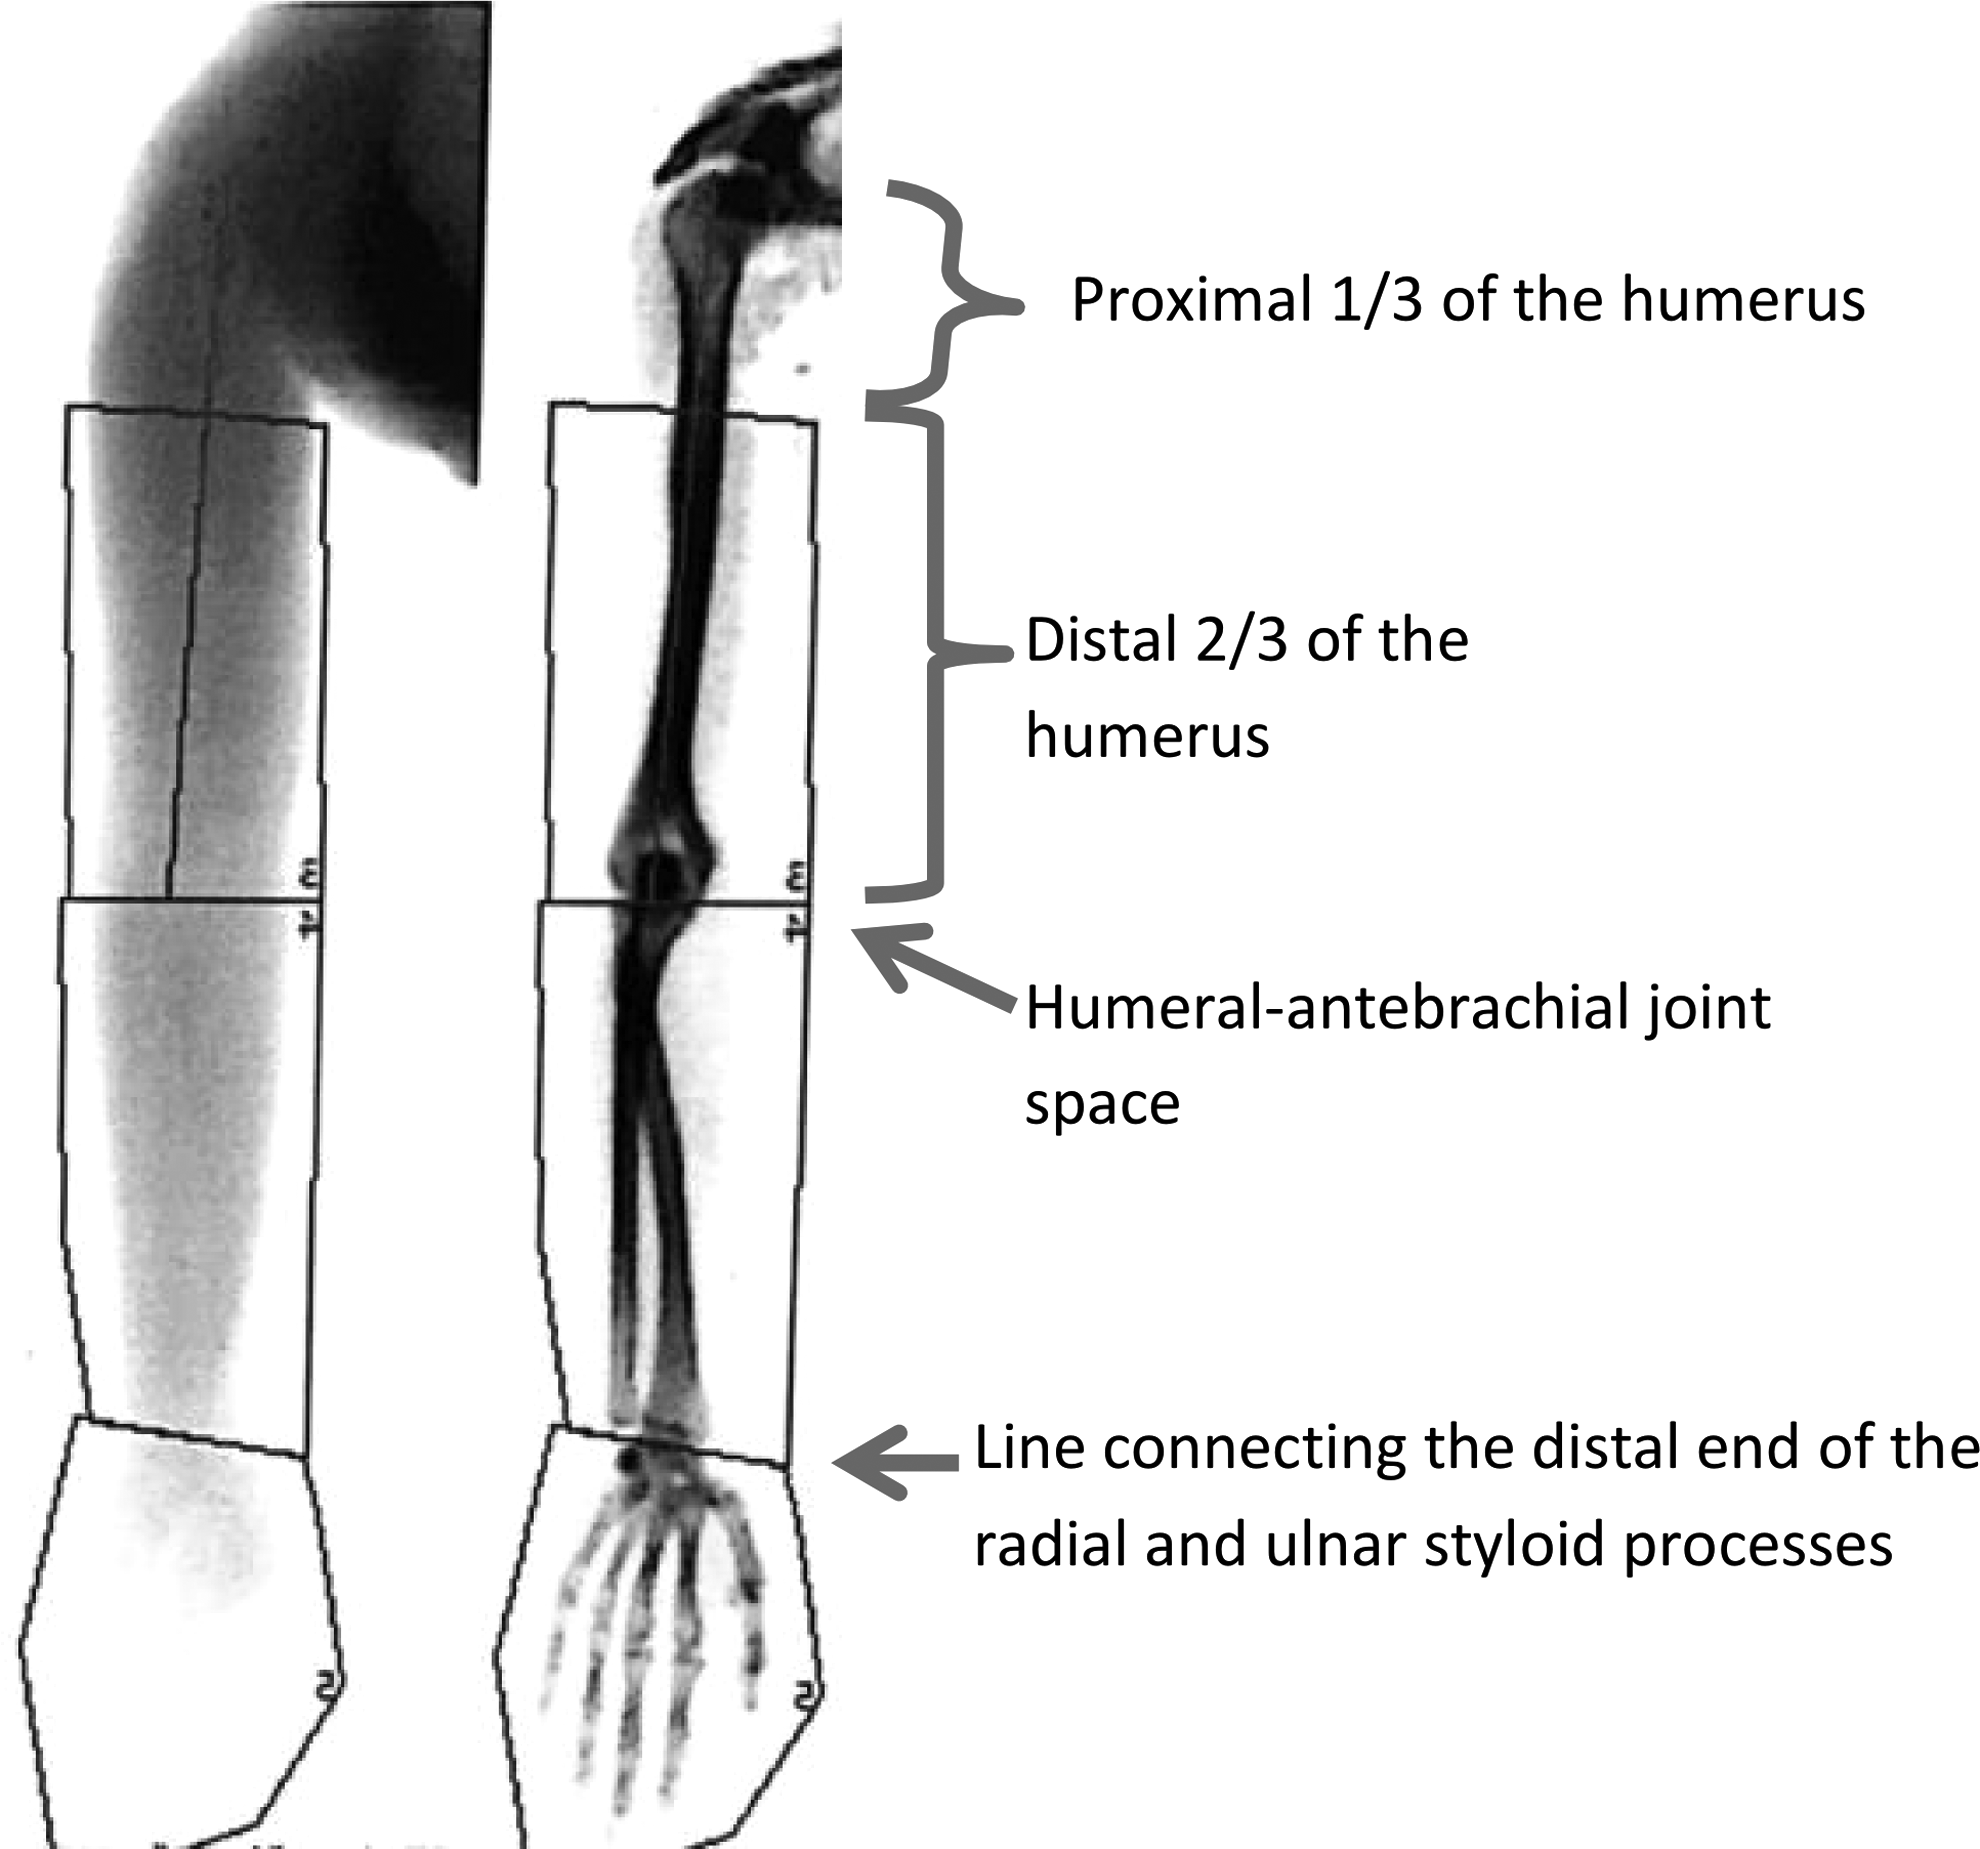
Regions of interests for measurement by DXA scan of the upper and lower arm and hand. A straight line is drawn along mid-humerus. The upper border is drawn perpendicular to the body of the humeral bone at a point separating the proximal 1/3 and the distal 2/3 of the humerus. The upper border of the lower arm is drawn crossing the elbow at the level of the humero-antebrachial joint space. The anatomical border of the hand is drawn as a line connecting the distal end of the radial and ulnar styloid processes. DXA, dual-energy X-ray absorptiometry.
ROIs of the leg were manually drawn for the thighs, lower legs, and feet using simple anatomical landmarks (Figs. 2). The upper border of the thigh was drawn as a horizontal line at the inferior border of the pubic bones. The upper border of the lower leg was drawn as a horizontal line through the joint space of the knee. The border of the foot was drawn as a horizontal line through the talocrural joint along the upper border of talus.
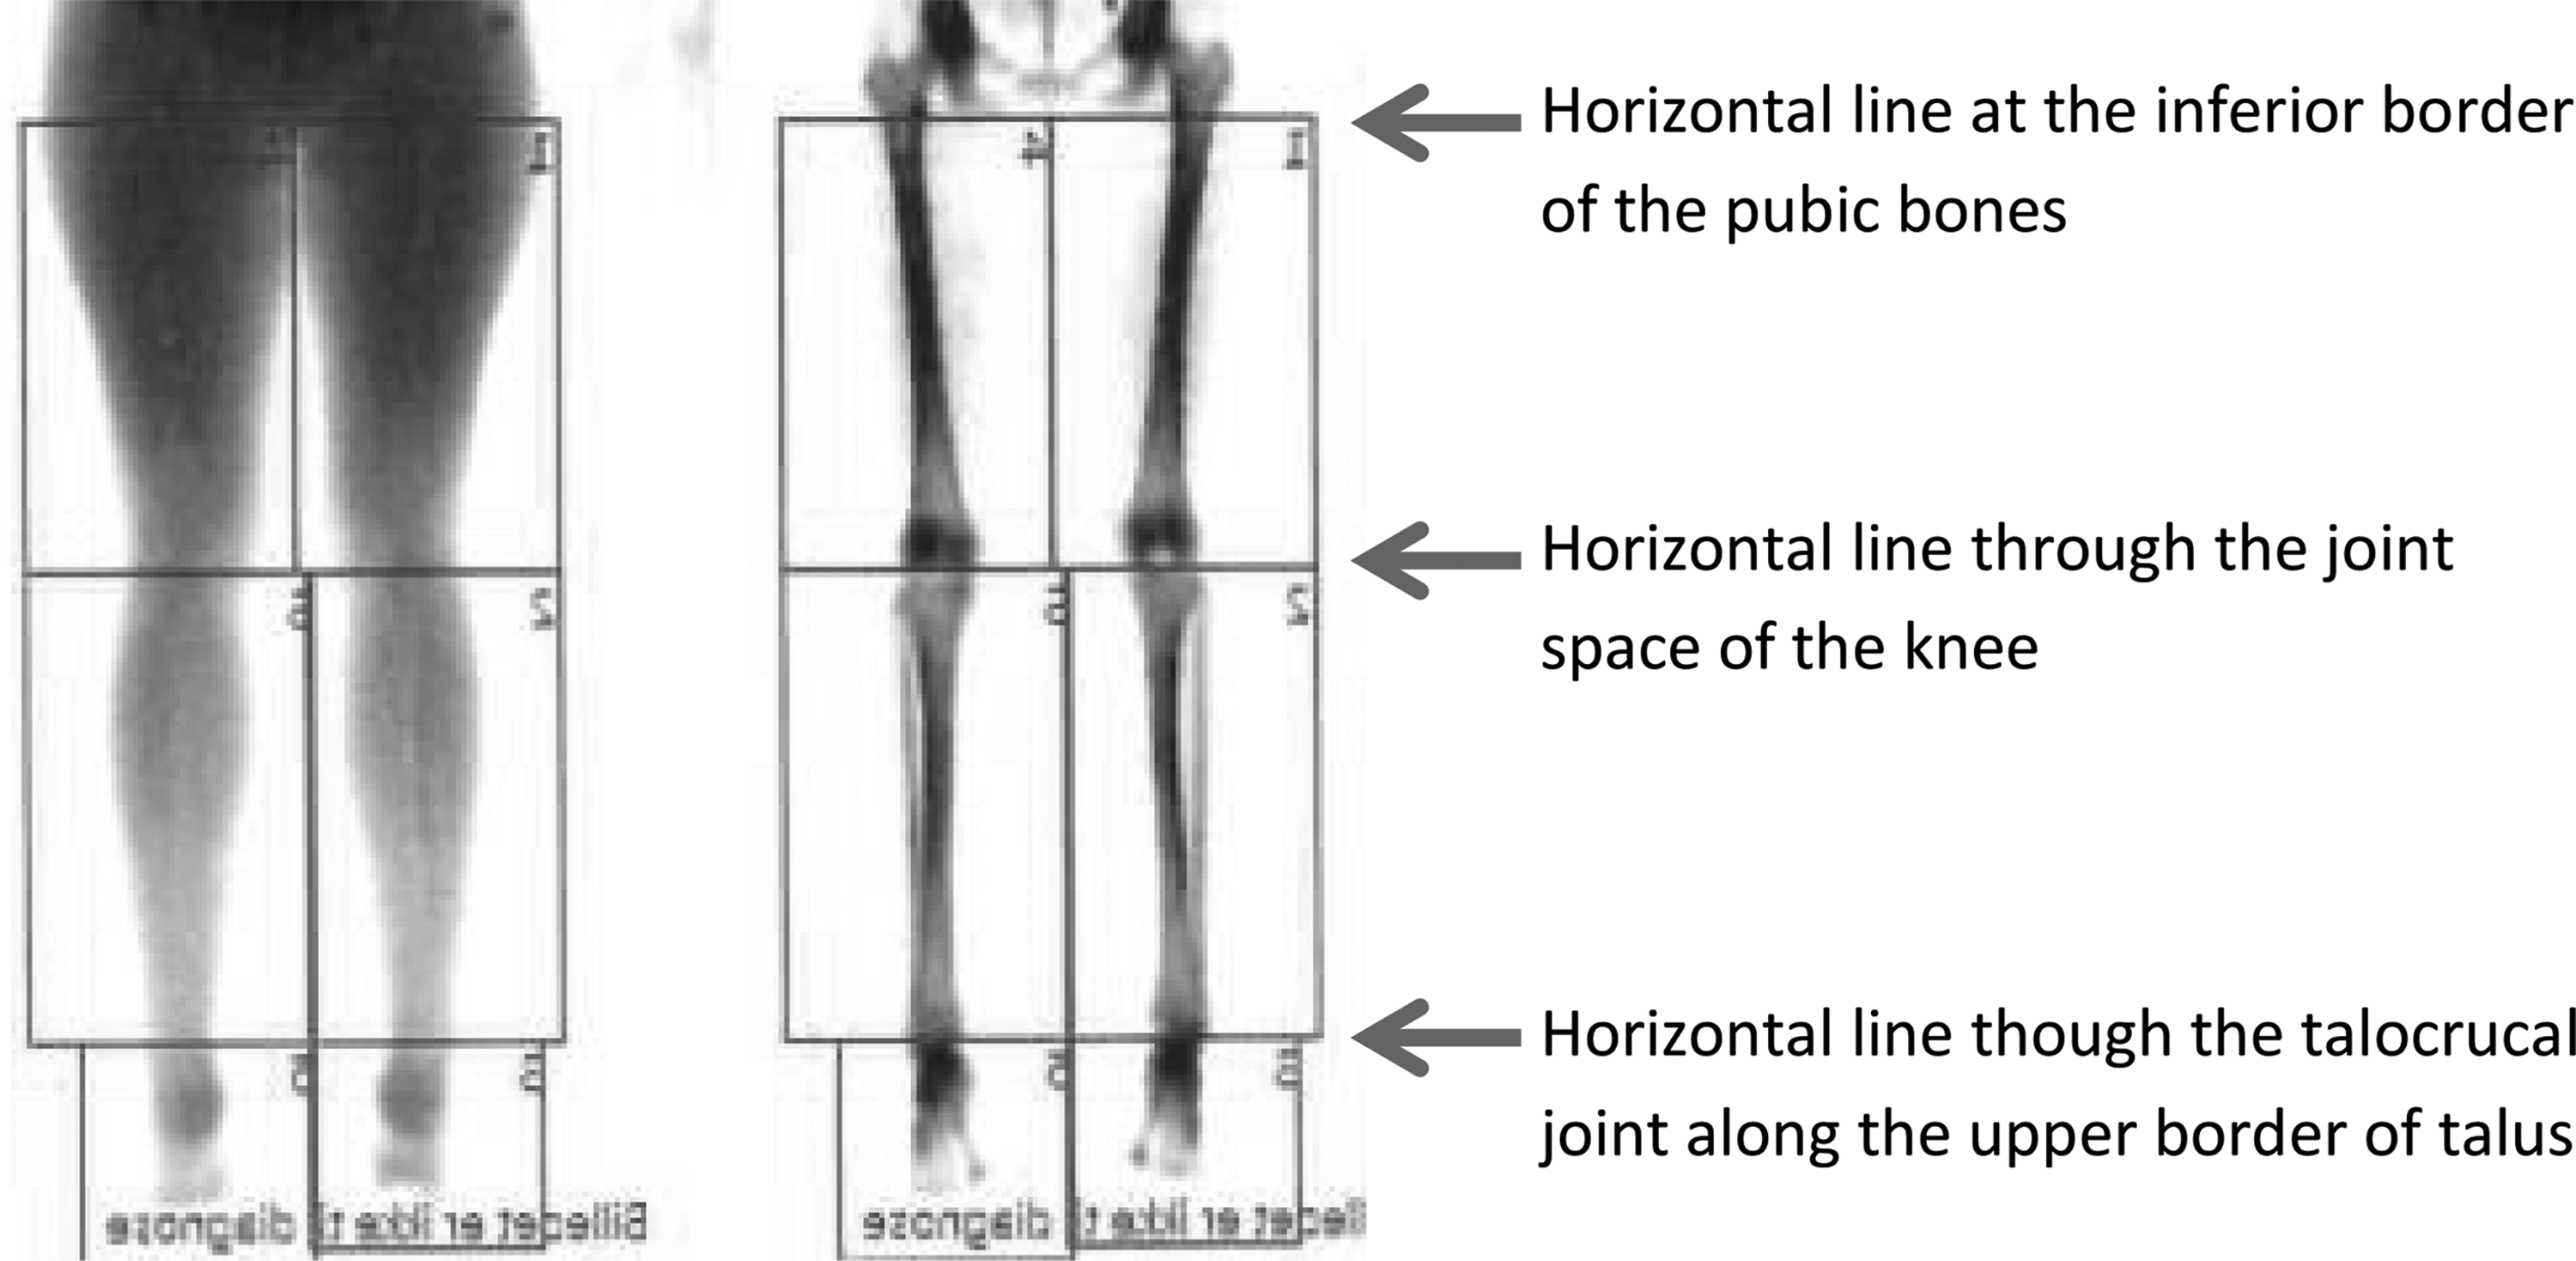
Regions of interests for measurement by DXA scan of the thigh, lower leg, and foot. The upper border of the thigh is drawn as a horizontal line at the inferior border of the pubic bones. The upper border of the lower leg is drawn as a horizontal line through the joint space of the knee. The border of the foot is drawn as a horizontal line through the talocrural joint along the upper border of talus.
Data for the mass of bone mineral content (BMC), fat mass, and fat-free mass were exported to Microsoft Excel 2013 using Prodigy med enCore version 15 Practical Management Tool and imported to SAS, version 9.4 (SAS Institute, Inc., Cary, NC).
Data were verified for plausibility, accuracy, and completeness. Missing data were added manually, if available. Implausible data and outliers (observations >1.96 standard deviations [SD] from the mean) were cross-checked and manually reassessed and corrected, if needed. Data of the limbs-of-interest were stratified according to site.
Statistical analysis
Descriptive statistics were calculated for anthropometric measures (weight, height, and BMI) and results expressed as means ± SDs and range. Volumes were calculated from the BMC, fat mass, and lean mass measured by DXA for each ROI using the density for BMC of 1.65 g/cm3, fat mass of 0.916 g/cm3, and lean mass of 1.04 g/cm3. 6 The total and regional volumes and masses of dominant and nondominant arms and the legs were expressed as means (SD). Normality of the data stratified by location (upper or lower limb) was assessed by inspection of a probability plot of the distribution of the regional and total volume and masses of the arms and legs.
The reference values for interlimb percentage differences for arms and legs were calculated as the mean + 1 SD and means +2 SDs, representing the prediction limits of differences corresponding to none/mild, moderate, or severe interlimb percentage differences.
Reference values for the arms
Significance of differences in measurements between the dominant and nondominant arms was determined using paired t-tests. The interlimb percentage difference was calculated as the difference between the dominant and nondominant arm in percentage of the mean of the dominant and nondominant arm. The mean interlimb percentage difference and SDs were used to calculate the prediction limits. The interlimb percentage differences for the limb-of-interest was categorized as none/mild, moderate, or severe, based on whether the value was below, in between, or above the two prediction limits as depicted in Figure 3A, B, respectively.
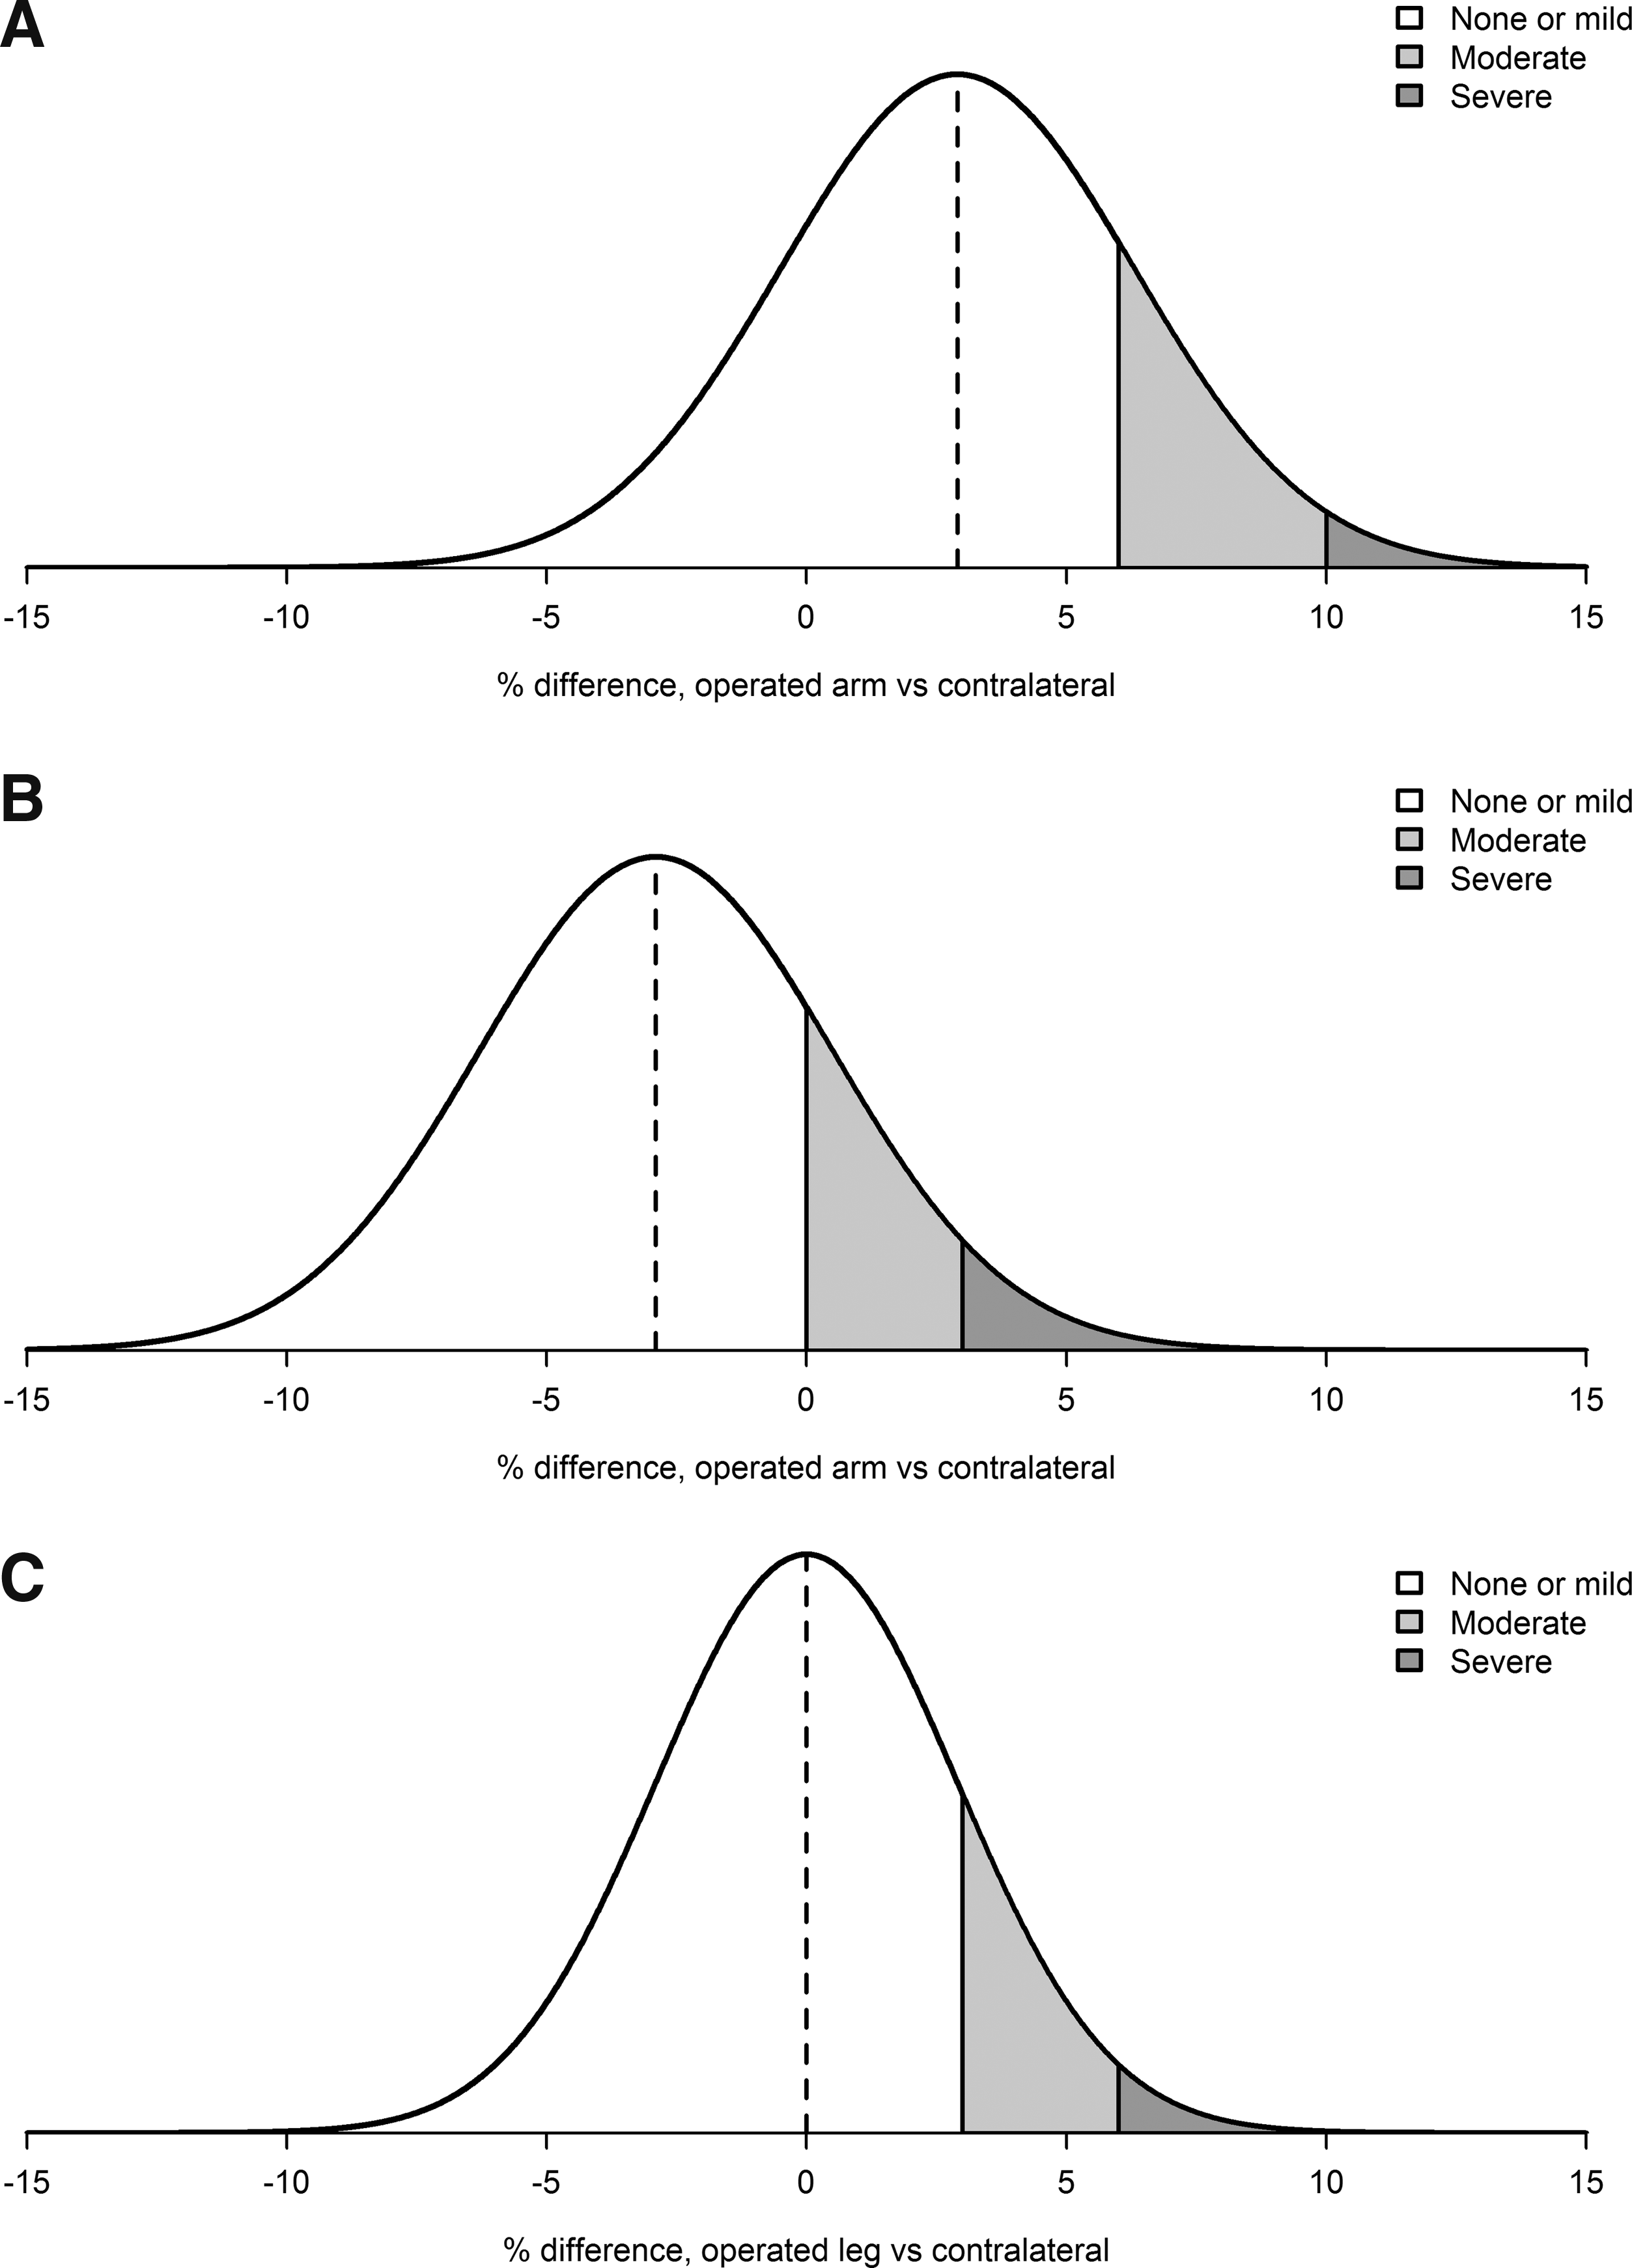
The interlimb percentage difference = (“Limb-of-interest” − contralateral)/contralateral × 100. The interlimb percentage differences for the limb-of-interest are categorized as none/mild, moderate, or severe, respectively, based on whether the value is under, in between, or above the two prediction limits (mean value +1 standard deviation [SD] and mean values +2 SDs). Examples hereof are shown for the reference values of the interlimb percentage difference of the total volume of the
Reference values for the legs
We did not define the dominant leg and therefore, the interlimb differences of the legs were calculated as the mean absolute differences in percentage of the mean of both legs. Lin's total deviation index (TDI) was used for defining the prediction limits. 7 The interlimb percentage differences for the limb-of-interest were categorized as none/mild, moderate, or severe, based on whether the value was below, in between, or above the two prediction limits as depicted in Figure 3C.
Comparison between interlimb differences and gender, age, and BMI
T-tests and F-tests were performed to assess for an association between the upper limb differences (of the total and the regional volume, fat mass, and lean mass) and gender, age, and BMI. Mann-Whitney U-tests were performed to assess an association between the lower limb differences (of the total and the regional volume, fat mass, and lean mass) and gender, age, and BMI. All results were Bonferroni corrected.
The statistical analyses were performed using SAS, version 9.4 (SAS Institute, Inc., Cary, NC), or R, version 3.2.3 (R Foundation for Statistical computing, Vienna, Austria); package “MethComp” was used for calculating Lin's TDI. p Values below 0.05 were considered to indicate a significant difference.
Results
A total of 431 patients were included in the HRQL study (Table 1). Of these, 68 were excluded in this study due to the following: BMI >40 (n = 6), lymph node surgery (n = 30), artifacts (n = 23) in the limbs-of-interest, or previous major surgery affecting symmetry of the limbs (n = 2) as presented in Figure 4. The scans of all outliers (more than 2 SD from the mean) were reviewed. This led to exclusion of seven patients with asymmetrical breast tissue overlapping the arm (n = 1) and limb length discrepancy (anisomelia) (n = 6). Of the 363 melanoma patients included in the study the DXA scans of the arms of 167 melanoma patients (who had had inguinal lymph node surgery) and the DXA scans of the legs of 196 melanoma patients (who had had axillary lymph node surgery) were included.

Flowchart of patients (n = 363) from the Health-related quality of life and surgical morbidity in melanoma patients study included in this study (n = 167 and n = 196 for reference values of the arms and legs, respectively).
SD = standard deviation.
Results of reference values for the arms
The absolute values and SDs of the dominant and nondominant arm in 167 patients and the relative interlimb differences in percentage, respectively, are presented in Figure 5 and Table 2. Of the 363 patients, 331 (91%) stated they were right-handed and 32 (9%) stated they were left-handed. No ambidexterity or cross-dominance (mixed-handedness) was reported. We found an association between the mean values of the arm-of-interest and the difference between the dominant and nondominant arm. This difference tended to be positively associated with the mean values (data not shown). However, the interlimb percentage differences were not associated with the mean values (data not shown).
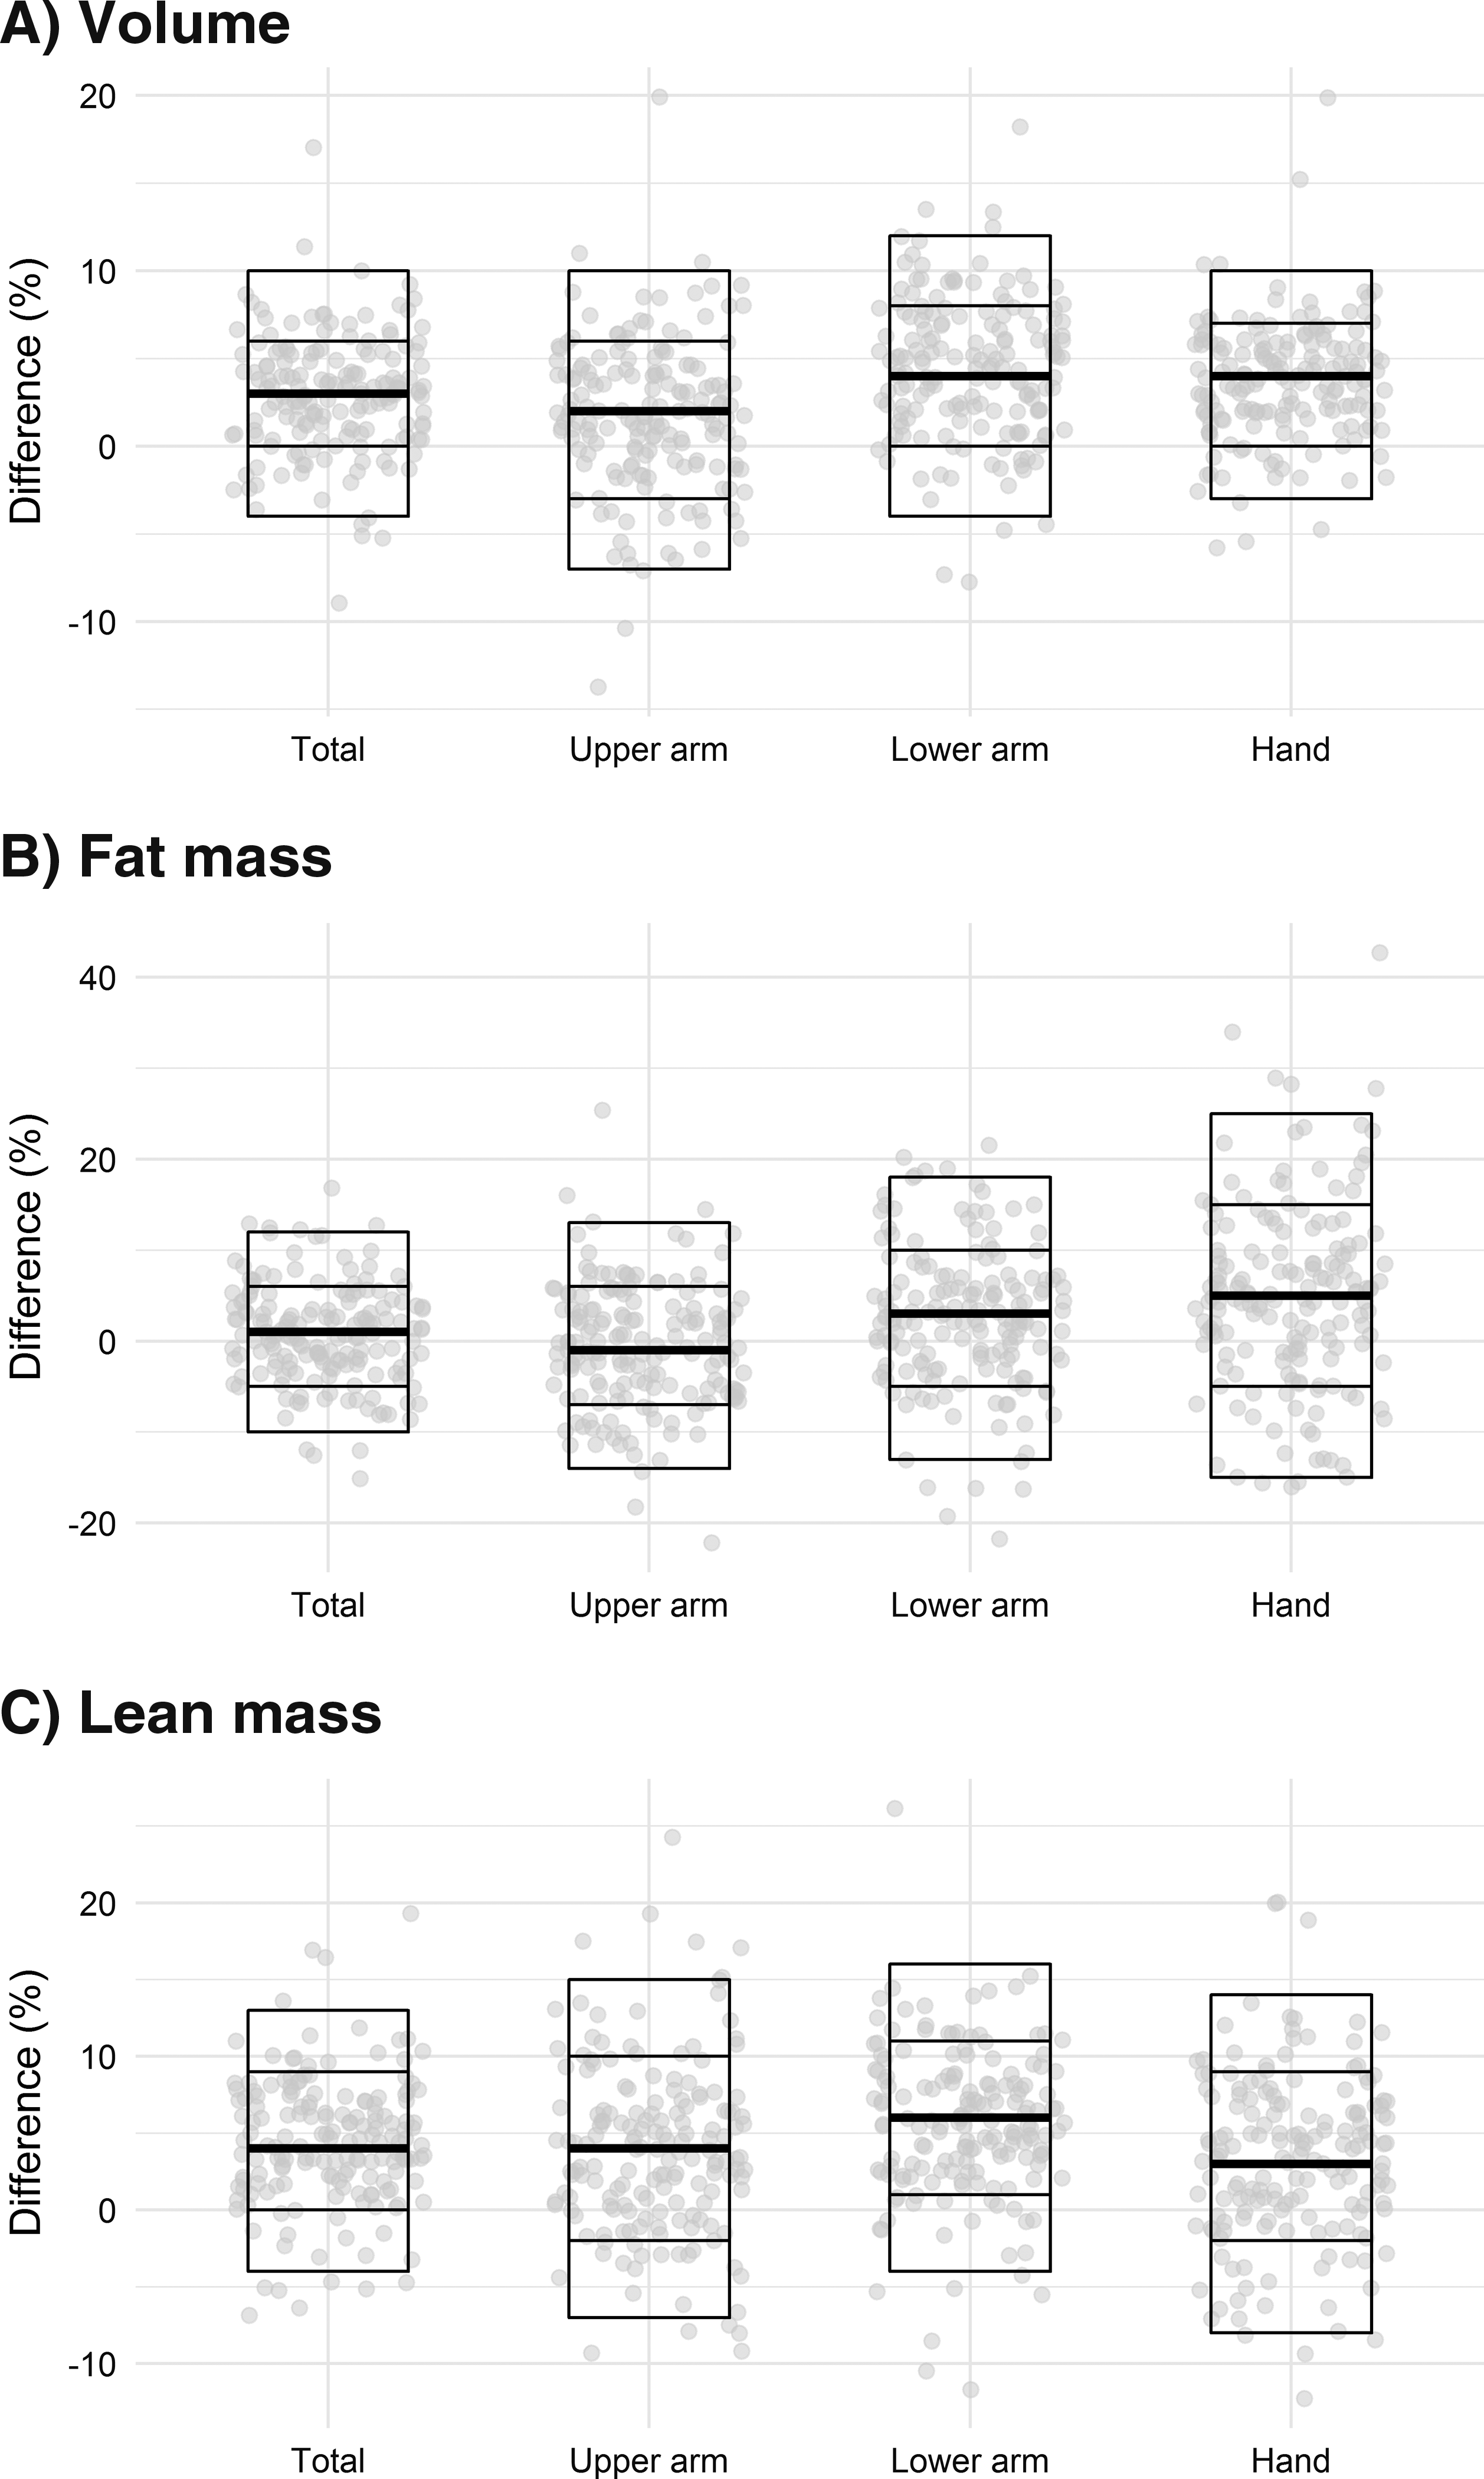
Total and regional interlimb differences (dominant arm - nondominant arm) of 167 arms in percentage of the mean of the dominant and nondominant arm in
In percentage of the mean of the dominant and nondominant arm.
The volume and lean mass of the dominant upper arm, lower arm, hand, and total arm were significantly higher than the nondominant arm. The fat mass of the lower arm and hand was significantly higher in the dominant arm than in the nondominant arm. Only the fat mass of the upper arm was not higher in the dominant arm. The categories of interlimb percentage differences for the dominant and nondominant arm, respectively, are shown in “dark blue” and “light blue” in Table 3A.
Only the interlimb percentage differences of the fat mass of the lower limb should be stratified according to gender.
Results of reference values for the legs
The mean values and SDs of the measurements of 362 legs and the mean interlimb percentage differences of the legs in 196 patients are presented in Figure 6 and Table 2. As for the arms, there was a positive association between the mean value of the leg and the difference between the two legs (data not shown). However, the interlimb percentage differences were not associated with the mean absolute values (data not shown). The categories of interlimb differences of the legs are shown in “green” in Table 3B. Noteworthy is the high absolute percentage difference for the fat and lean mass of the foot due to both the relatively low fat and lean mass in the foot and, in particular, poorer repeatability of the scans of the feet. 3 It is also important to notice that the absolute percentage difference of the fat mass of the lower leg is high: 20.2%. Significance of differences in measurements between the right and left leg, as well as between presumed dominant and nondominant leg (based on lateralization as handedness) was determined using paired t-tests. No clinical significant percentage differences were found (data not shown).

Total and regional interlimb differences of 196 lower limbs in percentages of the mean value in
Results on comparison between interlimb differences and gender, age, and BMI
Multiple tests (108 in total) for association between the interlimb percentage differences (of the total and regional volume, fat mass, and lean mass) and gender, age, and BMI were performed (data not shown). Only the associations between gender and the interlimb percentage difference of the fat mass of the thigh and lower leg, and therefore also total mass were significant. Therefore, the data for the fat mass were stratified according to gender and interlimb percentage differences were calculated.
How to use the reference material
The patient should be DXA scanned as outlined in the Materials and Methods section. The ROIs should be drawn for the upper arm, lower arm, and hand or thigh, lower leg, and foot as described in the Materials and Methods sections (Figs. 1–2). The volumes can be calculated from the DXA measurements of the BMC, fat mass, and lean mass also described in the Materials and Methods section. The interlimb percentage differences in the limb at-risk-of or with lymphedema can be calculated as follows:
The calculated interlimb percentage differences can be compared to the reference values in Table 3; and the interlimb percentage difference (of the volume, fat mass, or lean mass) of the limb-of-interest (regional area or total limb) can be categorized as none/mild, moderate, or severe as shown in Table 3. However, for the legs, the interlimb percentage difference of the fat mass of the thigh and lower leg should be stratified according to gender.
Discussion
This study provides clinical DXA reference values for the regional and total volume, fat mass, and lean mass of the upper and lower limbs to be used in assessing patients at-risk-of or with unilateral limb lymphedema. The clinical reference values can be used in assessment, monitoring treatment, or the natural course of unilateral limb lymphedema.
The clinical reference values have been produced in the normal limbs in melanoma patients. The age and BMI of the study participants were broad and both genders were well represented. Therefore, the reference values can be used in assessing patient at-risk-of or with lymphedema secondary to melanoma or other causes in comparable groups. Although DXA has previously been used to estimate the excess tissue in lymphedema arms, reference values have not been readily available.2,4,8 The presented clinical reference values allow for interpretation of the DXA scans in patients at-risk-of or with unilateral lymphedema, and other conditions affecting limb volume and tissue composition unilaterally. They also allow for categorization of interlimb differences as none/mild, moderate, or severe based on the prediction limits.
In lymphedema, the swelling and subsequent hypertrophy of adipose tissue are mostly localized to the subcutaneous tissue. Therefore, even a considerable amount of subcutaneous swelling measured as an increase in the lean mass or an increase in the fat mass might only mildly or moderately affect the total limb volume, total lean mass, and total fat mass. Applying the three categories none/mild, moderate, or severe allows for a clinically meaningful description of lymphedema even when changes are mild. These categories might also allow for detection of minimal improvement in measurements of surgical treatment of lymphedema such as lymphovenous anastomoses. 9
In early and mild lymphedema, the tissue changes are commonly regional and, in particular, localized to the lower arm and leg. The conservative treatment with compression garments is often localized to the lower arm and leg in such cases. The same applies to super microsurgical treatment with lymphovenous anastomosis, which is often performed on the lower arm or lower leg. The clinical reference values for regional interlimb differences allow for regional treatment, monitoring whether conservative or surgical treatment.
The regional limb volume, fat mass, and lean mass were significantly different between the arms, except for the fat mass of the upper arm. Therefore, the reference values for the arms were stratified according to hand dominance. In very rare cases, the type of handedness can be either ambidexterity or mixed-handedness (cross-dominance). However, handedness other than right or left was not reported in this study of 363 patients.
The total and regional limb volume, fat mass, and lean mass of the legs were not significantly different between the right and left leg (data not shown). We did not have data on presumable leg dominance, which can be either the same as (most cases) or opposite of the arm dominance. However, leg dominance is not well known for a considerable proportion of patients and due to the nature of the use of our legs, measurements can be expected to be of more symmetrical proportions than for the arms. In our population, the right lower limb was not significantly larger than the left. In athletes, for example, footballers', larger interlimb differences might be encountered. A limitation of this study is the lack of information on both work and leisure time physical activity, which may have had an impact on differences between the limbs. Noteworthy, the wide prediction limits for the feet are due to the poor repeatability of DXA scans of the feet. 3 The use of DXA scan for measurements of the feet alone should possibly be omitted. However, the volume of the feet constitutes only ∼5% of the total volume of the lower limb and can be retained in total lower limb measurements without severely compromising repeatability and, subsequently, the ability to detect changes in leg volume over time.
By assessing the percentage difference between the limbs, the effects of gender, age, and BMI on absolute values can presumably be avoided. The reference values are given for both genders produced in a patient population aged 22–75 years with a BMI <40. Multiple tests (n = 108) revealed an association between gender and fat masses of the thigh and lower leg, and therefore total fat mass. The reference values for the arm are not stratified for gender (Table 3A). The interlimb fat mass differences in the lower limbs are stratified for gender (Table 3B). Except for the fat mass differences of the lower limbs, no other significant volume, fat mass, or lean mass interlimb percentage difference was associated with gender, age, or BMI.
Furthermore, we excluded morbidly obese patients (BMI >40) as precision error increases in DXA measurements with increasing BMI. 10
However, our population of interest is reflected in the cohort, and as such, the data provide clinically yet unseen reference values for assessing limb volume, fat mass, and lean mass differences in patients at-risk-of or with unilateral limb lymphedema. These reference values allow identifying and categorizing changes in the volume and tissue composition of limbs at-risk-of or with clinical unilateral limb lymphedema. The clinical reference values can also be used in assessing other conditions affecting the upper or lower limb unilaterally.
Conclusions
The study provides clinical reference values of interlimb percentage differences of the total and regional volume, fat mass, and lean mass measurements for upper limbs according to hand dominance and lower limbs. These data allow for the use of DXA to evaluate and categorize the differences between the limbs as none/mild, moderate, or severe in a population at-risk-of or with unilateral limb lymphedema. This might provide better insight into the pathophysiological changes that occur in limbs with lymphedema.
Footnotes
Acknowledgments
This study was supported by the Department of Plastic Surgery, the Department of Clinical Physiology and Nuclear Medicine, and The Research Council at Herlev and Gentofte Hospital, University of Copenhagen, the private funds of Toemmerhandler Johannes Fog and Civilingeniør Bent Bøgh og hustru Inge Bøgh and The Danish Cancer Society, Denmark.
Author Disclosure Statement
No competing financial interests exist. All authors contributed to study conception and design, data collection, analysis, and interpretation of data and article preparation.