
Abstract
Abstract
Background:
The late effect continuum of lymphedema and fibrosis (LEF) affects more than 70% of patients after treatment for head and neck cancer (HNC). LEF is associated with symptom burden and decreased function and quality of life. Although surveillance imaging is common posttreatment, objective assessment of soft tissues is not, likely due to the lack of objective evaluation methods and understanding of the significance of LEF. We undertook the development of a tool to measure LEF using CT scans in HNC patients.
Methods and Results:
We developed a CT measurement tool assessing sites of soft tissue damage secondary to tumor, surgery, or radiation. The tool was applied to pre- and posttreatment CT scans for 10 HNC patients. The data were reviewed, and the initial tool was modified. Ten additional patients' scans were assessed using the revised tool. The tool was modified further after data review by an expert panel and was then applied to scans from all 20 patients. The final tool included 11 items as follows: grading of fat stranding at 6 sites (axial reconstruction images, scale 0–2), measurement of epiglottic thickness (sagittal images, scale mm), and measurement of prevertebral soft tissue thickness at C3 (sagittal images, scale mm). A total of 176 CT scans were evaluated from 20 patients (range 4–14 examinations/patient). Preliminary data demonstrated face validity.
Conclusions:
The final LEF assessment tool (CT-LEFAT) provides a standardized method for assessing critical sites that are involved by LEF. Studies to assess reliability and validity are ongoing.
Introduction
A
Due to the anatomic complexity of the head and neck region, measurement and documentation of soft tissue abnormalities, such as LEF, in this region are challenging. The problems encountered by clinicians attempting to report LEF on internal (endoscopic) and external examination have been well described. 5 Similar challenges exist with regard to imaging studies. Nonetheless, noninvasive imaging modalities (e.g., CT, MRI, and ultrasound) have the potential to provide useful information regarding soft tissue changes related to LEF. Recently published work by Akashi et al. has begun to capitalize on this potential, creating a scoring system using CT images to identify alterations in radiographic appearance of soft tissues that may be associated with LEF. 6 Historically, radiation therapy-induced changes have been characterized to distinguish them from active tumor, and changes have been reported in a cursory and predominantly descriptive manner. The careful delineation and grading of soft tissue damage itself has not been a goal of radiologic review and reporting. This may be, in part, due to the lack of recognition of the clinical importance of radiation-induced LEF, particularly as it relates to key structures. In addition, there is a lack of standardized methods for measurement and/or grading postradiation soft tissue changes. The lack of standardized reporting methods and grading systems has hampered the ability of radiographic imaging to provide meaningful information regarding this potentially severe late effect. It also hinders research efforts by limiting our capacity to accurately grade and report outcomes. Mukherji et al. attempted to systematize the reporting of soft tissue edema in the head and neck region as assessed by CT 7 using an ordinal numeric scale: 0—normal, 1—mild changes, and 2—advanced changes. While innovative, the scale lacked methods for standardization of imaging technique or anatomic landmarks for sites of evaluation.
We undertook the development of a comprehensive and standardized measurement protocol to systematize assessment of soft tissue changes visible on CT imaging in patients who have completed radiation treatment for HNC. Clinical materials were obtained from medical records of patients who participated in an R0-1 funded research project titled “The Fibrosis-Lymphedema Continuum in Head and Neck Cancer” (1-R01-CA149113-01A1). The primary results of this trial will be reported elsewhere. Herein we report results from a secondary analysis of CT scans with the objective of development and conducting preliminary testing.
Materials and Methods
Tool development
Based on clinical experience and prior literature, a preliminary tool was developed for initial application. Factors considered in the development included the following: Utility: (1) simplicity of approach to ensure wide applicability, (2) avoidance of technology that was not widely available, such as manual segmentation of region areas of interest, and (3) ease of use; Radiologic Technique: (1) standardization of window level settings, (2) developing methods that account for variability in patient position, and (3) wide applicability to different CT scanning techniques; Involved Structures: (1) standardization of anatomic sites to be assessed, (2) site selection based on clinical relevance of structures, and (3) ability of sites to be evaluable with CT scans; and Measurement Criteria: (1) numeric measurement where feasible and (2) grading systems for soft tissue abnormalities that could not be characterized by measurement.
Tool modifications
The initial tool was applied to the CT studies of 10 irradiated patients who participated in a prospective descriptive study of lymphedema in HNC patients. Using input of the pain and symptom management research team, the initial tool was then revised to a final measurement tool and reapplied to the original 10 patients' CT studies, plus an additional 10 enrolled patients. The study was approved by the institution's review boards. All patients signed informed consent before initiating any study activities. The informed consent included permission to review medical records.
Final tool assessment
Frequency distributions were used to summarize the nominal and ordinal characteristics in the sample of patients who were assessed longitudinally. Means and standard deviations summarized the continuous characteristics. Box plots (continuous) and stacked bars (ordinal category) were used to illustrate the longitudinal patterns in the CT data.
Results
Involved structures and measurement criteria
One of the most obvious CT imaging changes after radiation treatment is fat stranding, found throughout the irradiated neck.8–10 Similar to Mukherji,7,11 the final tool grades fat stranding on a scale of 0–2 in six locations: bilateral anterior and posterior cervical spaces and midline anterior neck subcutaneous fat at the level of the superior thyroid cartilage as visible on axial reconstructed images and within the submental region on sagittal reformatted images (Fig. 1). Endolaryngeal fat evaluation (pre-epiglottic, paraglottic) was dropped from the final tool because of consistently poor characterization of this fat. The final tool includes a “Not Applicable” designation for those areas where an abnormality may limit assessment, for example, postoperative changes obscure fat or an area affected by tumor directly or obscured by artifact. The picture archiving and communication system (PACS) monitor window width and center levels were set to 350 and 40 HU, respectively, for fat assessment.
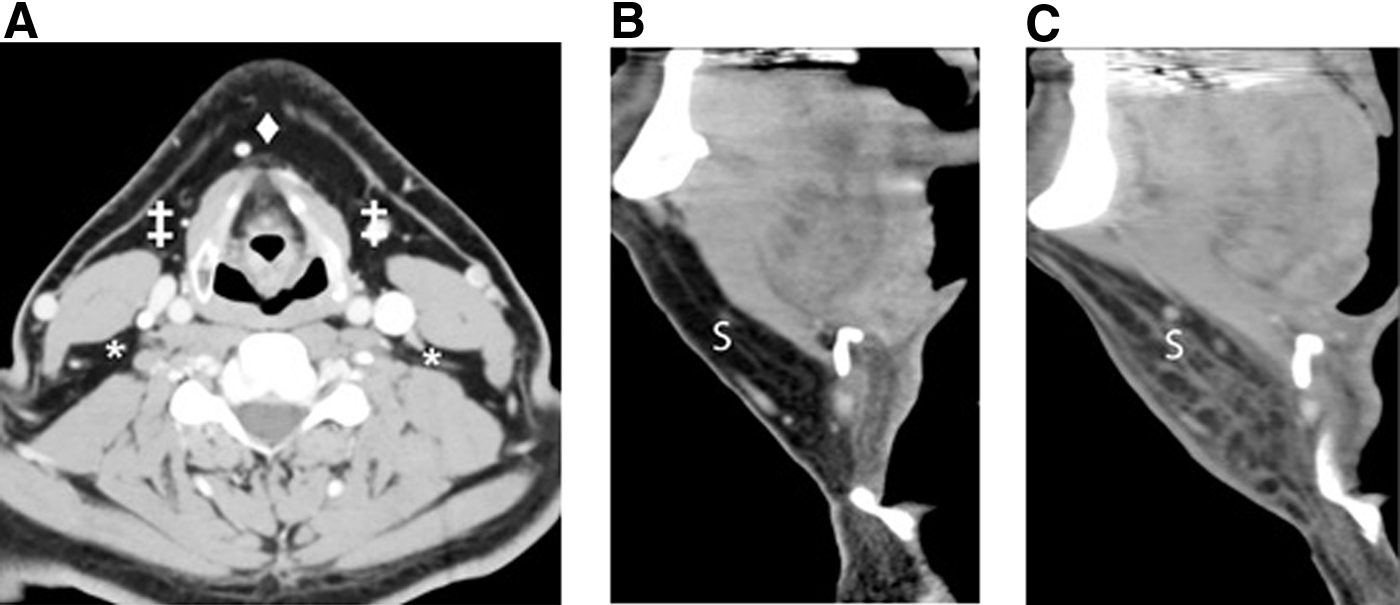
CT images showing locations of fat stranding assessment.
Submucosal edema may be present throughout the irradiated pharynx and larynx.8–10,12 Sites of evaluation were chosen based on ease and reproducibility of measurements. Epiglottic submucosal edema after radiation is common, with a resultant volume change.7,9 Our measurement tool utilizes the sagittal reformatted images to quantify epiglottis volume changes, using a midline or slight paramedian antero-posterior (AP) diameter surrogate. The AP diameter of the epiglottis is measured 8 mm from the free margin (superior extent), to the anterior surface of the epiglottis, to the closest point on the posterior surface (Fig. 2). If there is a prominent midline glossoepiglottic fold, between the two valleculae, the measurement is taken just off of midline. Our tool evaluates submucosal edema in the retropharyngeal region using the prevertebral soft tissue (PVST) thickness as a surrogate at the mid-C3 level as seen on sagittal reformatted images (Fig. 3), in the manner of Rojas et al. 13
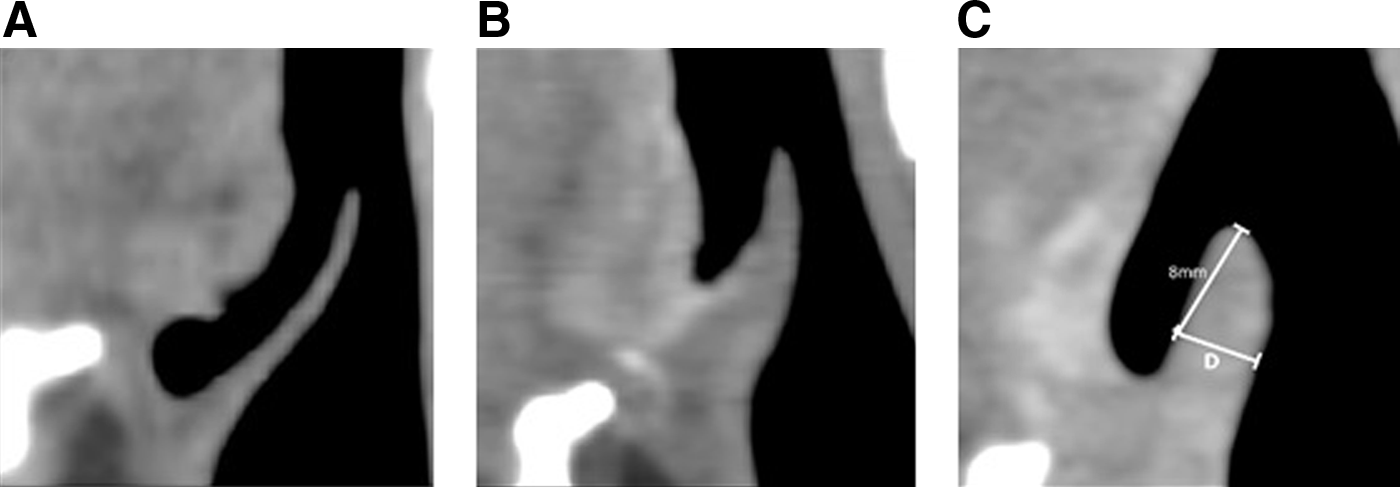
Midline sagittal reformatted CT images through the epiglottis.
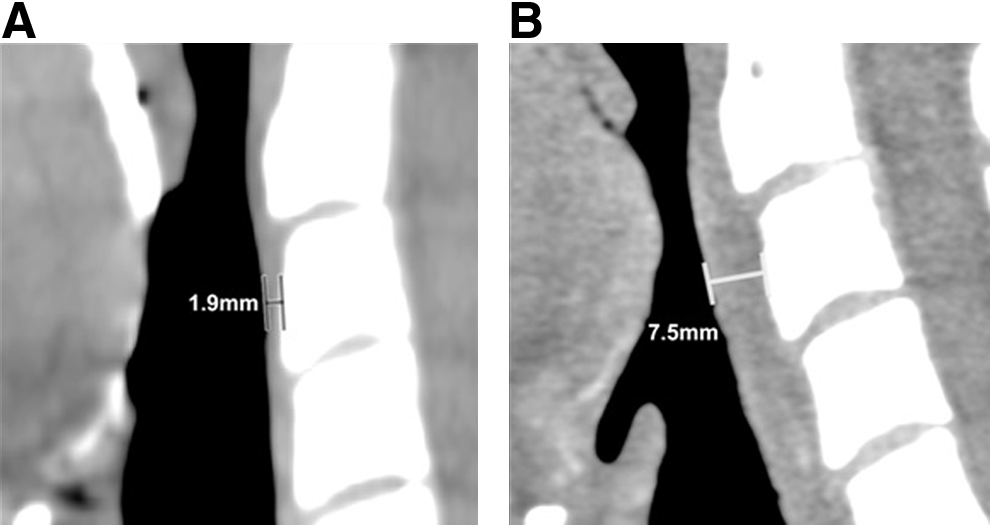
Prevertebral soft tissue thickness is measured on midline sagittal reformatted image, at the mid C3 level.
Radiation changes in muscle are well known,7,8,10 but difficult to easily quantify because of variability in patient positioning (cervical spine flexion/extension, shoulder position, head position) between examinations. The initial tool used oblique axial images reformatted parallel to the C4-5 disc space, to allow for some improvement in comparison over time, but the sternocleidomastoid muscles still varied considerably in axial cross-sectional appearance across examinations. In addition, the cross-sectional area was not a readily measurable structure without advanced imaging software. For these reasons, an initial attempt was made to objectively measure the thickness of the platysma muscle at the C4-5 level, 30 mm from the midline anterior neck on each side, with inconsistent results. Although pterygoid muscle changes are well seen by MR imaging after radiation, 10 this and other muscles (paravertebral, posterior paraspinal) are not easily measured by routine CT Neck imaging. Thus, the final measurement tool does not include measurement of muscles.
Skin thickening, a common response to radiation therapy in the head and neck,10,12 is well characterized by high-resolution ultrasound imaging. 14 It is less well measured using conventional CT neck imaging due to relatively low resolution and volume averaging. Our initial tool measured skin thickness at three locations as follows: the C4-5 level, midline anterior neck, and 30 mm off of midline on each side. Measurements of the skin and platysma are limited by voxel size and were found to be unreliable.
In the acute setting, therapeutic neck radiation results in soft tissue edema, with an increase in volume. This may result in a measurable increase in neck circumference. However, neck circumference cannot be measured accurately with routine CT Neck imaging; skin folds, elevated shoulders, and variable cervical spine and craniocervical angulation prevent this.
An essential CT scanning technique necessary for the final measurement tool is a narrow reconstruction interval (<2 mm, 1 mm preferred), as isotropic sagittal images are essential to measure the epiglottis precisely. The assessment tool is theoretically independent of contrast type, injection rate, contrast volume, cardiac ejection fraction, and scan delay to allow for variable scanning techniques.
Initial and final tool descriptions
The initial tool included grading of endolaryngeal fat stranding, measurement of midline AP neck diameter at the level of C4–C5 (as a surrogate for volume assessment), axial measurement of skin and platysma thickness parallel to the C4-5 disc (reformatted axial images) in three locations each, grading of fat stranding at the level of C4–C5 in five locations, and measurement of midline PVST thickness at the center of C3.
The final tool grades fat stranding (0–2, axial reconstruction images) at the level of the superior thyroid cartilage in five locations, measures midline PVST thickness at the mid C3 level (mm, sagittal reformatted images), measures epiglottis thickness (mm, sagittal reformatted images), and grades submental fat stranding (0–2, sagittal reformatted images).
Final tool preliminary pilot data
Longitudinal data from all 20 patients were assessed for epiglottic thickness and PVST thickness at specified time points across the treatment and recovery trajectory (Fig. 4). Both measures demonstrated increased soft tissue swelling posttreatment. This coincides with the expected trajectory of LEF. Over time, soft tissue swelling decreased for both epiglottic thickness and PVST; however, they did not return to baseline levels (Fig. 4). Similarly, fat stranding was not identified in baseline CT scans. Posttreatment, fat stranding was identified in the vast majority of patients (Fig. 5).
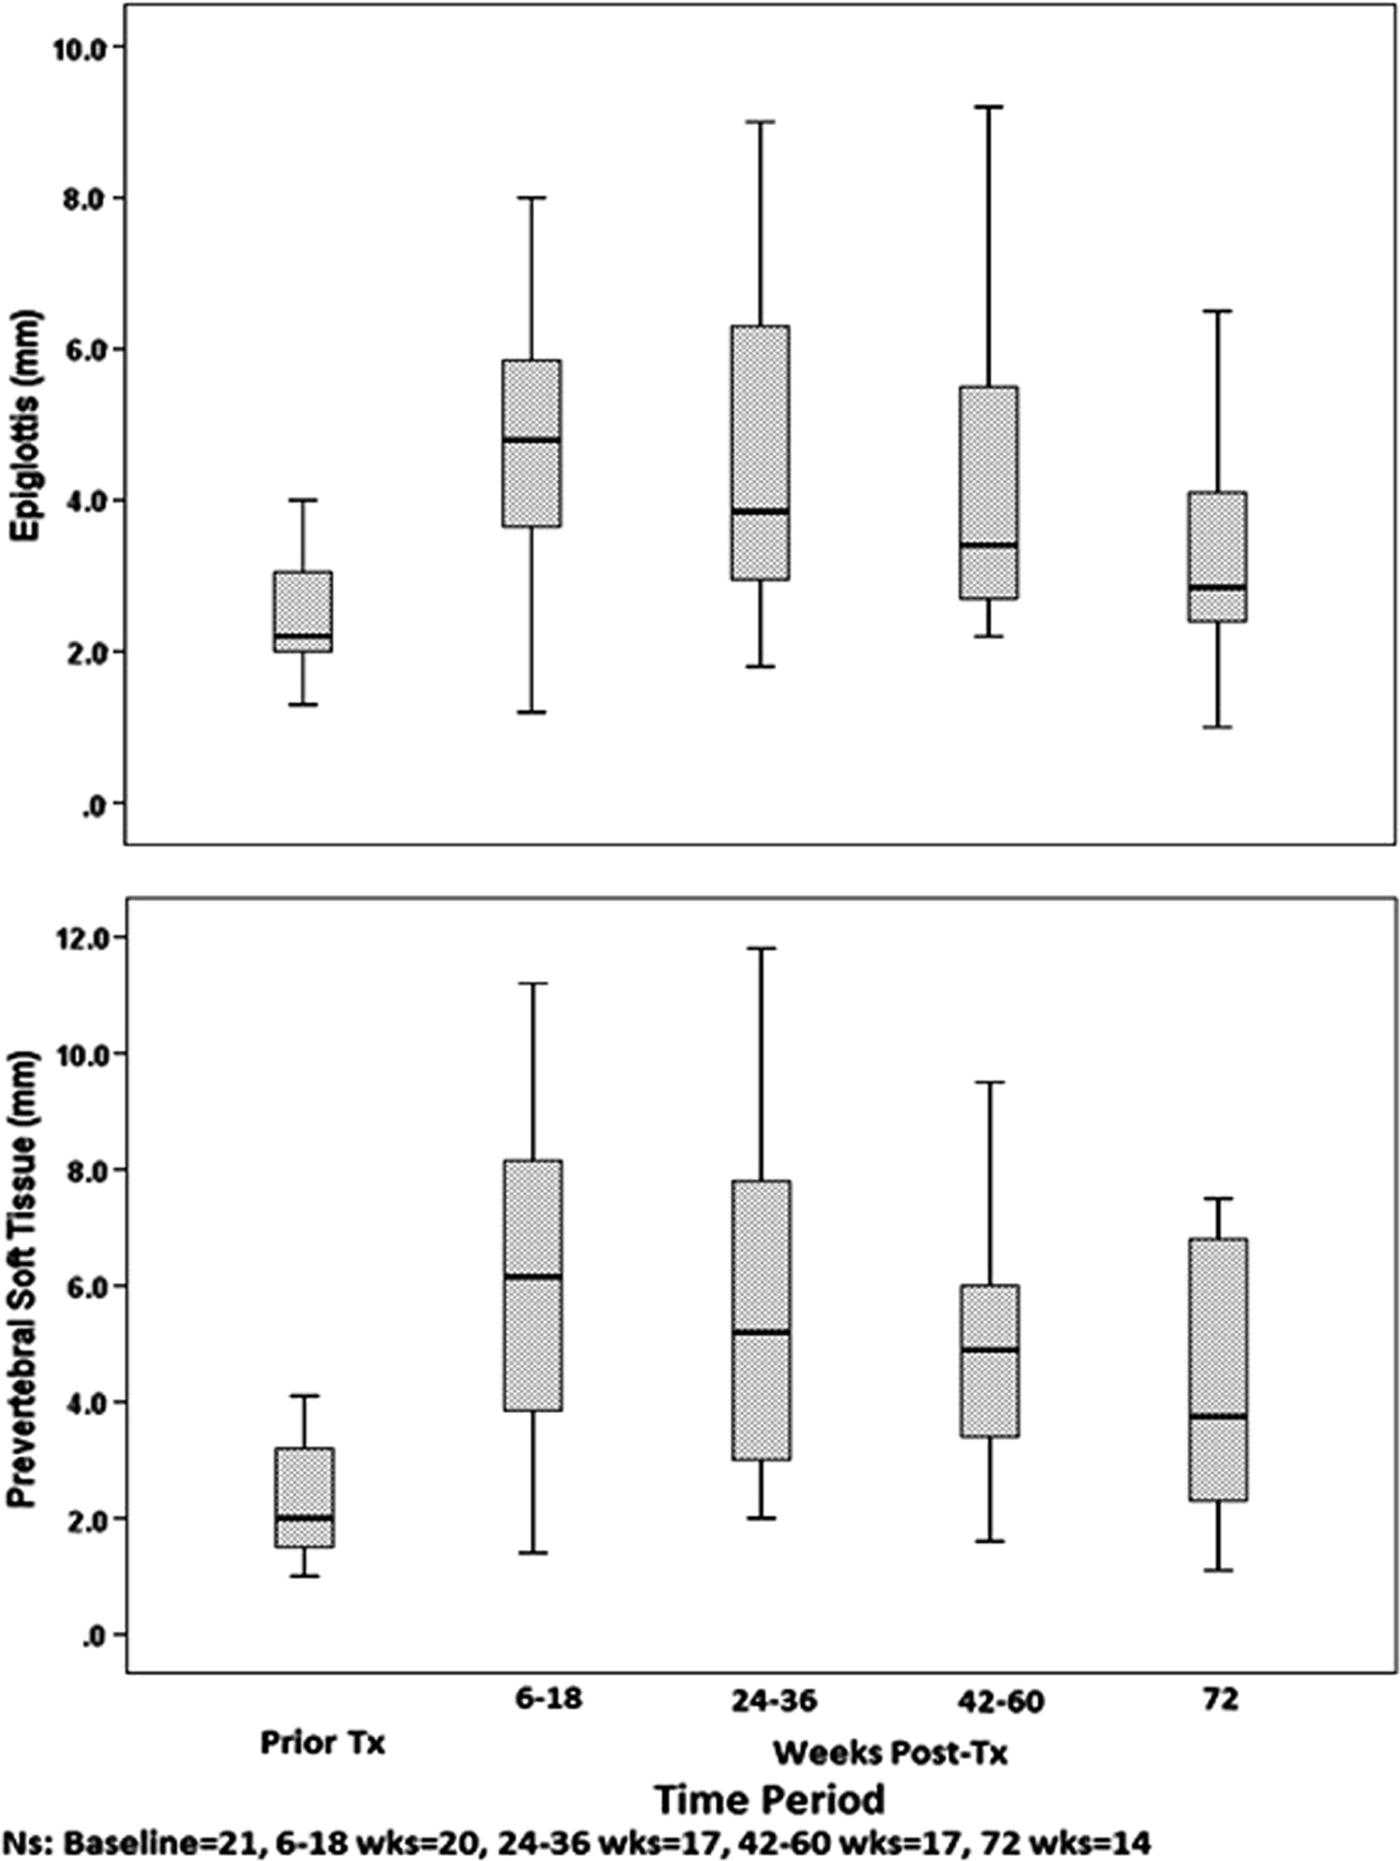
The box plots demonstrate an increase in the epiglottic and prevertebral soft tissue immediately posttreatment with a moderate degree of recovery over time.
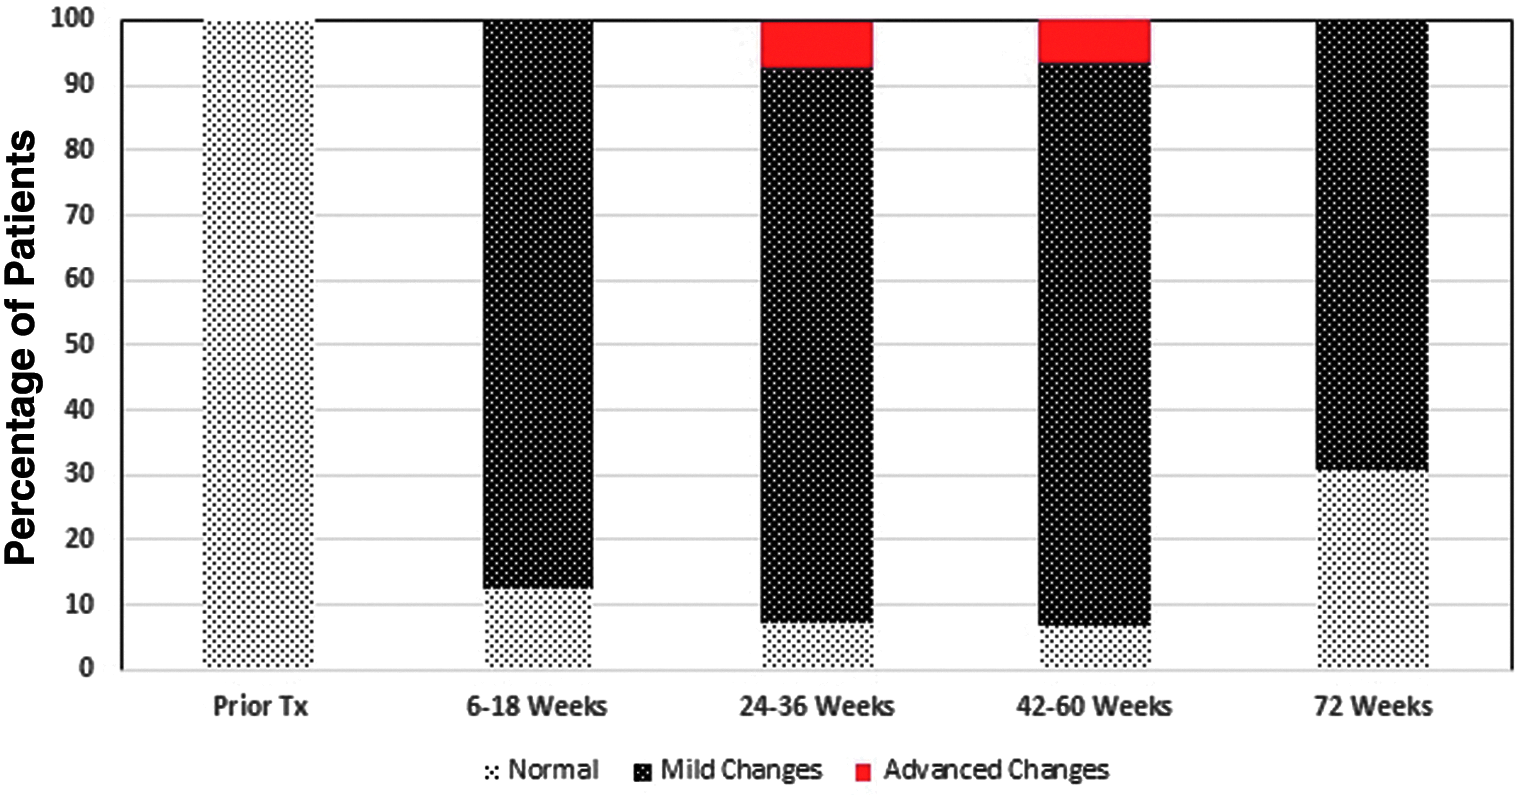
The figure depicts the development of fat stranding in the submental area over time. As noted, mild soft tissue changes are noted early after completion of treatment in the majority of patients (6–18 weeks). Between 24 and 60 weeks, a small percentage with developed advanced changes. At 72 weeks, no patients exhibit advanced changes, but a high percentage of patients retain mild soft tissue changes.
Discussion
The CT-LEF Assessment Tool (CT-LEFAT) is a brief measurement tool that assesses clinically relevant LEF associated soft tissue abnormalities that are a consequence of radiation and surgery for HNC. We began with a tool that included a comprehensive inventory of anatomic sites in the head and neck that are susceptible to LEF. Through a rigorous assessment process, sites were excluded from the measurement tool due to lack of reproducibility and consistency of measurement. Through a detailed and iterative process, the final items reflect sites that can be measured in a reproducible manner and may provide clinically relevant information to the treating physicians. Measurement of the PVST captures the soft tissue changes involving and surrounding pharyngeal muscles, which are critical for deglutition. Thus, this measure may help identify patients at risk for dysphagia or aspiration. Similarly, patients with epiglottic thickening may experience alterations in voice and airway compromise. Finally, fat stranding may identify patients with significant external LEF which untreated may result in marked decrease of neck and shoulder range of motion with resultant function loss.
The development of an objective measure of LEF may fill a needed clinical and research gap. Currently, LEF is usually assessed using patient reported and clinician reported measures. Patient reported measures center on symptoms associated with soft tissue swelling or stiffness and fibrosis. Patient reported measures can also capture unique aspects of LEF, including altered sensation such as tightness. Clinician reported measures have largely been directed at measuring swelling and fibrosis in the face, neck, and shoulders. Only one scale has been developed to assess lymphedema involving the pharynx and larynx. Clinician reported measures are limited by observer variability and training. Objective measures are clearly indicated. Imaging techniques may bridge this gap.
Assessment of LEF is challenging because of a lack of clearly defined toxicity criteria. External LEF may be characterized using the Földi scale, a grading scale that evaluates for the presence of tissue swelling or firmness that signifies LEF, respectively. 15 External digital photography augments the documentation of external lymphedema and can serve as a platform to which the Földi scale can be used. Internal lymphedema, but not fibrosis, may be assessed endoscopically and graded with the use of the Patterson scale, which grades the extent of tissue swelling.15,16 These methods each have limitations, some of which could be overcome by the use of the CT-based measurement tool described above. Of particular relevance is the ability of CT scans to assess the PVST in the sagittal plane; endoscopy and the accompanying Patterson scale lack the ability to reliably detect edema in this region, and it is suspected that edema in this region could contribute to dysphagia, 17 which can detract from both physical health and quality of life.
The focus of posttreatment imaging in HNC has been to assess for residual tumor and tumor recurrence. Little attention has been given to the assessment of the treatment-related changes. Through tools such as the one reported above, radiologists may provide clinically meaningful data pertaining to soft tissue toxicities that require either further work-up or intervention. Bringing attention to this often unrecognized late effect may improve functional outcomes and long-term quality of life.
There are a number of limitations encountered during the development and application of the CT-LEFAT. Not all CT neck examinations may be accurately evaluated with this assessment tool, particularly those lacking thin-section axial images necessary for sagittal reformatting. Specifically, FDG-PET/CT studies may be limited in this regard. Another limitation relates to the small sizes of the epiglottis, which may restrict accuracy. In addition, the presence of prominent vallecula lymphoid tissue or epiglottis swelling may obscure the anterior margin of the epiglottis, preventing accurate evaluation. Furthermore, the contour and normal variability of the epiglottis limit measurement, and dimensions may not accurately reflect changes in volume.
The results observed in this pilot study are promising. We are currently using CT scans and data from an additional 80 patients enrolled on the above R0-1 to conduct formal psychometric testing to establish the reliability and validity of this tool. To establish content validity, findings from CT scans will be compared with findings on external physical examination using the Földi scale, endoscopic examination using the Patterson scale, 16 and patient-reported outcomes relevant to lymphedema.
Conclusions
We developed a brief measurement tool, the CT-LEFAT, to objectively quantify CT changes that reflect clinically important sites of LEF in HNC patients across the trajectory of diagnosis, treatment, and recovery. Initial testing demonstrated face validity. Psychometric testing to establish reliability and content validity is ongoing.
Footnotes
Author Disclosure Statement
No competing financial interests exist.