
Abstract
Abstract
Background:
Bioimpedance spectroscopy detects unilateral lymphedema if the ratio of extracellular fluid (ECF) between arms or between legs is outside three standard deviations (SDs) of the normative mean. Detection of bilateral lymphedema, common after bilateral breast or gynecological cancer, is complicated by the unavailability of an unaffected contralateral limb. The objectives of this work were to (1) present normative values for interarm, interleg, and arm-to-leg impedance ratios of ECF and ECF normalized to intracellular fluid (ECF/ICF); (2) evaluate the influence of sex, age, and body mass index on ratios; and (3) describe the normal change in ratios within healthy individuals over time.
Methods:
Data from five studies were combined to generate a normative data set (n = 808) from which mean and SD were calculated for interarm, interleg, and arm-to-leg ratios of ECF and ECF/ICF. The influence of sex, age, and body mass index was evaluated using multiple linear regression, and normative change was calculated for participants with repeated measures by subtracting their lowest ratio from their highest ratio.
Results:
Mean (SD) interarm, interleg, dominant arm-to-leg, and nondominant arm-to-leg ratios were 0.987 (0.067), 1.005 (0.072), 1.129 (0.160), and 1.165 (0.174) for ECF ratios; and 0.957 (0.188), 1.024 (0.183), 1.194 (0.453), and 1.117 (0.367) for ECF/ICF ratios, respectively. Arm-to-leg ratios were significantly affected by sex, age, and body mass index. Mean normative change ranged from 7.2% to 14.7% for ECF ratios and from 14.7% to 67.1% for ECF/ICF ratios.
Conclusion:
These findings provide the necessary platform for extending bioimpedance-based screening beyond unilateral lymphedema.
Introduction
B
Normative data are available for the ratio of ECF between arms 4 and the ratio of ECF between legs. 5 Based on these data, lymphedema is identified if the ratio of ECF between arms or between legs is outside three standard deviations (SDs) of the normative mean (this is equivalent to falling outside approximately 99.7% of a normative sample). The feasibility and clinical utility of this method have been validated and are widely accepted for the early detection of unilateral breast cancer-related lymphedema6–8 and have shown potential for utility in the unilateral lower limb setting.5,9 However, this method is unsuitable when both arms or both legs are at-risk or affected, as is the case for bilateral breast and gynecological cancer-related lymphedemas, respectively.10–15 To address this problem, a proof-of-concept study by Ward et al. 16 investigated the potential for leg ECF/ICF ratios normalized to arm ECF/ICF ratios to detect bilateral lower limb lymphedema. The authors concluded that this approach showed promise but suggested the need for sex, age, and body mass index-related reference ranges, and for a prospective study to determine the minimum change in ratio capable of detecting lymphedema. Other studies that have focused on diagnosing lower limb lymphedema have involved small sample sizes, unilateral lymphedema cases only, or relied on the availability of pretreatment measures.5,10,12,17,18 Therefore, the objectives of this work were to (1) present normative values for interarm, interleg, and arm-to-leg ratios of ECF and ECF/ICF; (2) evaluate the influence of sex, age, and body mass index on ratios; and (3) describe the normal change in ratios within healthy individuals over time.
Materials and Methods
Study design and data sources
Data from three cross-sectional studies, designated A (n = 486), B (n = 62), and C (n = 230), and two prospective repeated-measures studies, D (n = 33) and E (n = 87), were pooled for this study. All five studies were comparable, including only consenting participants who were healthy by self-report and excluding those with a history of lymphedema, cancer, surgery, or radiotherapy to the regional lymph nodes. Appropriate ethical approvals were obtained from the relevant institutions for the conduct of all initial studies, as well as the present study (ACTRN1500001072).
Data collection
All contributing studies implemented the same, established, validated protocol, outlined by ImpediMed, 19 to measure impedance to TBF (Rinf), ICF (Ri), and ECF (R0) in arms and legs using a portable, ImpediMed SFB7, SFB3, or U400 BIS device. Differences between the SFB7 and U400 machines are esthetic, with the U400 implementing the same BIS platform utilized in the SFB7, thus generating equivalent raw impedance values. 9 SFB3 data (used for data collection in studies A and E) were converted to equivalent SFB7 data using the conversion factors provided by Ward.20–22 BIS measurements were taken with the participant lying supine with legs apart. For any given measure, two measurement electrodes were placed at either end of the arm or leg (i.e., wrist for arm measures and ankle for leg measures) with a current drive electrode placed approximately 10 cm proximal to the base of the middle finger or toe, respectively, and another placed on the ipsilateral or contralateral foot or hand, respectively. 23 Each limb segment was measured in this manner and the resistances corresponding to ECF (R0) and to TBF (Rinf) were determined. ICF impedance (Ri) was subsequently calculated with the manufacturer's software (Bioimp 4.15.0.0), which uses the formula: Ri = (R0 x Rinf)/(R0 - Rinf). Participants were routinely asked to empty their bladder within the previous hour to data collection, and to avoid a higher than normal intake of alcohol or caffeine, vigorous exercise, or more exercise than usual, in the previous 24 hours. Sex, age, height (measured to the nearest mm using a stadiometer), weight (measured to the nearest 100 g using a calibrated scale), and side of dominance were recorded for each participant. Side of dominance was defined by the dominant arm (preferred hand for writing) due to leg dominance being less easily defined and because most people (∼84%) favor the same foot as hand.24,25 Furthermore, it has previously been shown that unlike in the arms, the effect of dominance in the legs is minimal. 5
Statistical analysis
The following interlimb ratios were calculated for each participant: dominant arm/nondominant arm (R0 and Ri:R0); dominant leg/nondominant leg (R0 and Ri:R0); dominant arm/dominant leg (R0 and Ri:R0); and nondominant arm/nondominant leg (R0 and Ri:R0). For participants with repeated measures, normative change was calculated for each of the four outcomes by subtracting their lowest ratio from their highest ratio. Graphical inspection of the data revealed thirteen BIS ratios from 10 participants as extreme outliers (i.e., arm-to-leg ratios of <0.25 or >4.0; arm-to-arm or leg-to-leg ratios of <0.5 or >2.0). These values were confirmed as outliers by the generalized extreme Studentized deviate test, individually scrutinized, and then excluded due to suspected measurement error (1% of total participants). A random 10% sample of the normative data (n = 90) was retained for future validation of diagnostic criteria, leaving a total of 808 participants. BIS ratios were log-transformed to satisfy the requirements of a normal distribution for regression analyses. To test for a relationship between individuals within data sets the intraclass correlation was estimated using linear mixed-effects models for each of the outcomes with data set as a random factor and sex, age, and body mass index as fixed factors. Intraclass correlation between data sets was found to be very low ranging from 0.006 to 0.042. The mixed models were then compared with corresponding multiple linear regression models without accounting for data set (i.e., fixed models). Comparison of Akaike information criterion values indicated that multiple regression models were superior for all outcomes. Therefore, data sets were pooled for all remaining analyses, and multiple regression models and plots were used to evaluate associations between factors and ratios of R0 and Ri:R0 between limbs. Means and SDs were used to describe the normative ratios and normative change in ratios over time. Between-subject coefficient of variation values were calculated by dividing the SD by the mean for each of the outcomes. Mean normative change was presented as a percentage of the mean normative ratio. Analyses were conducted using R version 3.4.0. 26 Mixed-effects models were fit using the lme4 package. 27
Results
Characteristics of participants
The 808 participants' ages ranged between 18 and 87 years, 65% were female, 93% right-side dominant, and 51% overweight or obese (Table 1). For the 108 participants with repeated measurements, all were taken over 18 months and the number of measurements ranged from 2 to 22 (median = 3; IQR = 2–7). Participants with repeated measures were similar to the total participants in terms of age (median = 50, range = 21–83), right-side dominance (91%), and body mass index (56% overweight or obese), but consisted of a higher proportion of females (90% vs. 65%).
Characteristics of Participants in Normative Sample
N, number of participants; BMI, body mass index; SD, standard deviation; IQR, interquartile range.
Normative interlimb ratios of R0 and Ri:R0
Normative means and SDs for interlimb ratios of R0 and Ri:R0 are presented for all participants and stratified by sex (Table 2). Comparison of the between-subject coefficient of variation values between outcomes indicates there is approximately twice as much variation among arm-to-leg ratios of R0 (10.9%–14.9%) compared with arm-to-arm or leg-to-leg ratios of R0 (5.4%–7.9%). There was greater between-subject variation among Ri:R0 ratios compared to R0 values across all limb comparisons (Table 2).
Normative Interlimb Ratios of R0 (ECF) and Ri:R0 (ECF/ICF) for All Participants and Stratified by Sex
N, number of participants; CV, coefficient of variation.
Effect of sex, age, and body mass index on interlimb ratios of R0 and Ri:R0
Visual inspection of the data suggested log-transformed ratios of R0 and Ri:R0 between contralateral limbs were not influenced by sex, age, or body mass index (not shown) and multiple regression results supported this observation. Overall, none of the variances in arm-to-arm or leg-to-leg ratios of R0 or Ri:R0 was explained by the factors in these models (adjusted R squared values ranged from −0.003 to 0.003).
Figures 1 and 2 show a clear influence of sex on arm-to-leg ratios, with males having consistently lower mean ratios than females. Multiple regression results confirm a statistically significant effect of sex on arm-to-leg ratios of R0 (Dominant: coefficient = −0.113, p < 0.001; Nondominant: coefficient = −0.118, p < 0.001) and of Ri:R0 (Dominant: coefficient = −0.121, p < 0.001; Nondominant: coefficient = −0.127, p < 0.001).
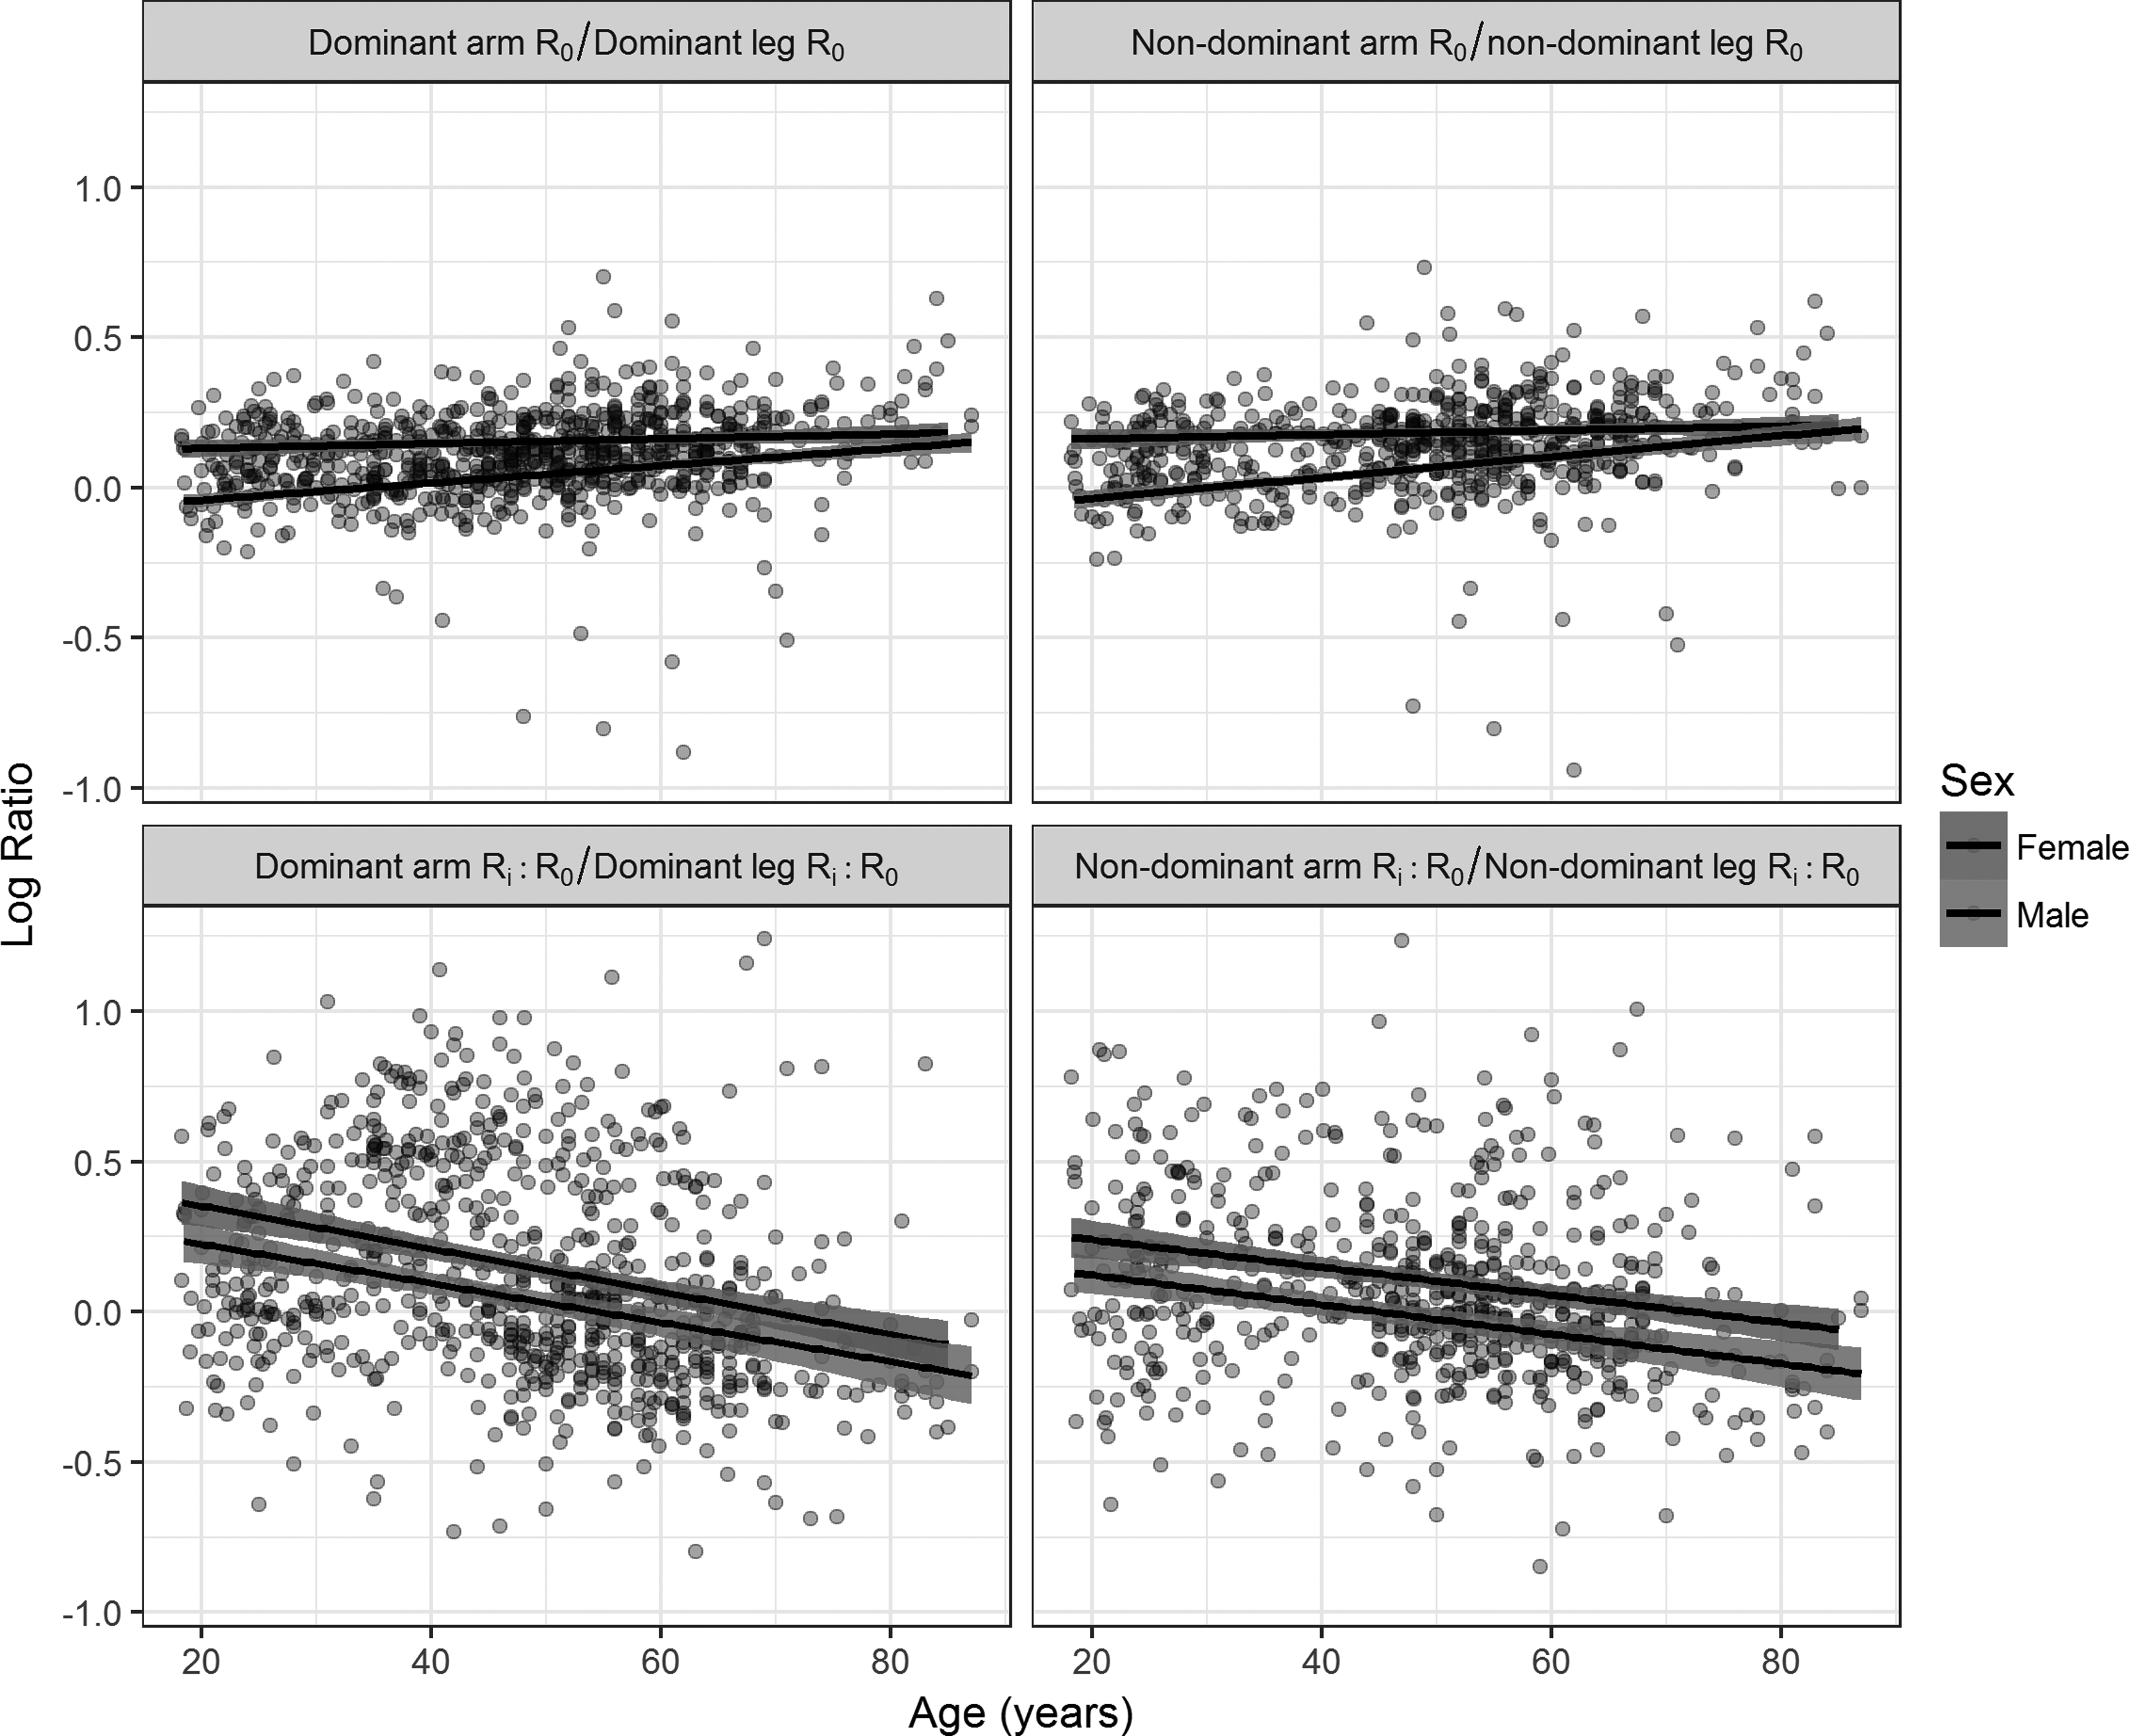
Log arm-to-leg ratios of R0 (ECF) and log Ri:R0 (ECF/ICF) by side of dominance and age. Regression lines were fit separately for males and females. ECF, extracellular fluid; ICF, intracellular fluid.
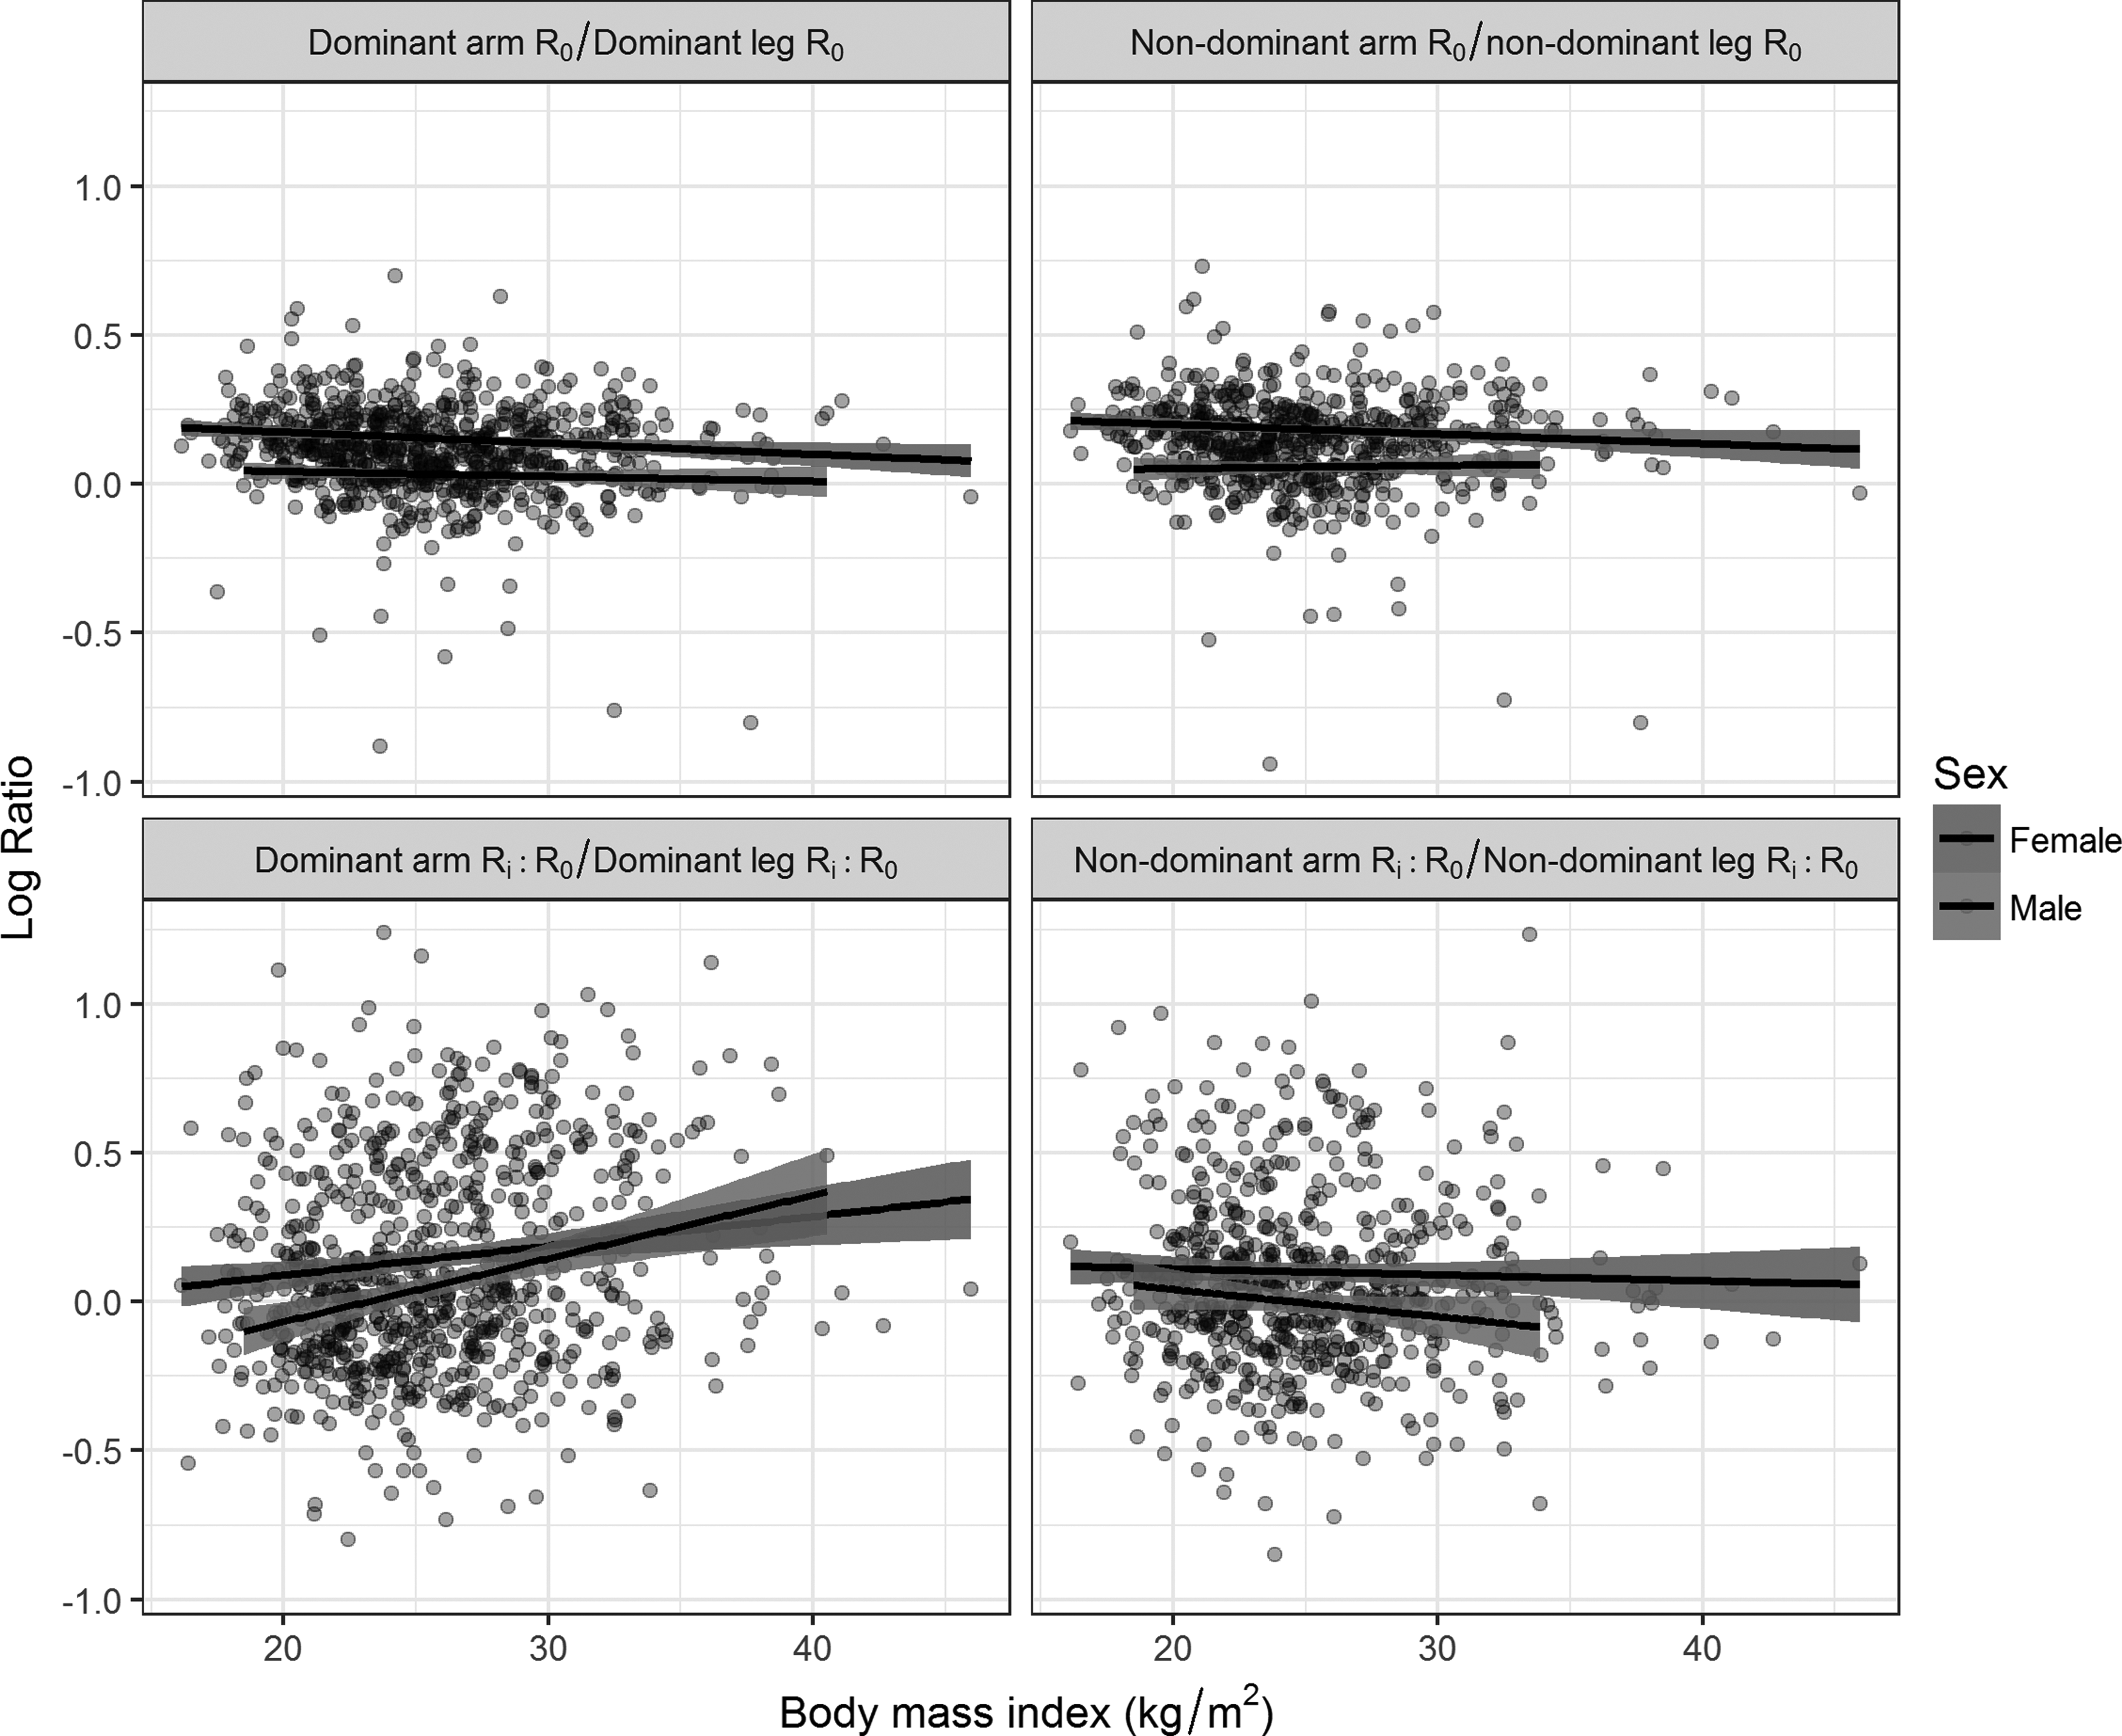
Log arm-to-leg ratios of R0 (ECF) and log Ri:R0 (ECF/ICF) by side of dominance and body mass index. Regression lines were fit separately for males and females.
Increasing age was significantly associated with higher arm-to-leg ratios of R0 (Dominant: coefficient = 0.002, p < 0.001; Nondominant: coefficient = 0.002, p < 0.001) and lower ratios of Ri:R0 (Dominant: coefficient = −0.008, p < 0.001; Nondominant: coefficient = −0.005, p < 0.001). Figure 2 suggests a stronger effect of aging on arm-to-leg ratios of R0 in males compared to females. An interaction term between sex and age was included and found to be significant on dominant (coefficient = 0.002, p = 0.002) and nondominant (coefficient = 0.003, p < 0.001) sides of the body. To investigate this difference between the sexes, regression analyses were conducted with raw values of R0 for individual limbs as the dependent variables. There was no interaction between sex and age for R0 values in arms, but there was a significant interaction between sex and age for R0 values in legs (p < 0.01), with R0 values decreasing more quickly in aging males compared to aging females. There was no sex/age interaction observed for arm-to-leg ratios of Ri:R0, arm-to-leg ratios of Ri, or for raw Ri values for individual limbs, with age being significantly associated with higher Ri values for all limbs (p < 0.001).
Increasing body mass index was associated with lower arm-to-leg ratios of R0 (Dominant: coefficient = −0.004, p < 0.001; Nondominant: coefficient = −0.004, p = 0.001) and higher ratios of Ri:R0 on the dominant side of the body (coefficient = 0.016, p < 0.001), but not on the nondominant side (coefficient = 0.001, p = 0.739).
Regression models with sex, age, and body mass index as independent variables explained 19% of the variance in arm-to-leg ratios of R0 and 9%–14% of the variance in ratios of arm-to-leg ratios of Ri:R0. Inclusion of a sex/age interaction term increased the explained variance to 20%–21% for arm-to-leg ratios of R0. Models, including sex and age, explained 18% for R0 and 9%–10% for Ri:R0; while sex alone explained 15% for R0 and 1%–3% for Ri:R0. Therefore, arm-to-leg ratios of R0 and Ri:R0 are also presented stratified by sex and age (Table 3); and by sex, age, and body mass index (Supplementary Table S1; Supplementary Data are available online at www.liebertpub.com/lrb).
Normative Arm-to-Leg Ratios of R0 (ECF) and Ri:R0 (ECF/ICF) Stratified by Sex and Age
N, number of participants.
Normative change over time in interlimb ratios of R0 and Ri:R0
Table 4 summarizes normative change over time for interlimb ratios of R0 and Ri:R0 for all participants and participants stratified by sex. The large SDs relative to means indicate high variation in terms of the amount of change measured for different participants (Table 4). Normative change as a percentage of the normative mean was similar among arm-to-arm, leg-to-leg, and arm-to-leg ratios. Ratios of R0 varied within an individual by up to 14.7% over time, while ratios of Ri:R0 varied by up to 67.1% (Table 4). Changes in arm-to-leg ratios of R0 and Ri:R0 are presented stratified by sex and age in Table 5; and by sex, age, and body mass index in Supplementary Table S2.
Normative Change Over Time in Interlimb Ratios of R0 (ECF) and Ri:R0 (ECF/ICF) for All Participants and Stratified by Sex
Mean change as a percentage of the normative mean extracted from Table 2.
N, number of participants.
Change Over Time in Arm-to-Leg Ratios of R0 (ECF) and Ri:R0 (ECF/ICF) Stratified by Sex and Age
N, number of participants.
Discussion
Diagnosis of bilateral lymphedema, which is common after bilateral breast cancer or gynecological cancer, is challenging due to the unavailability of a comparable unaffected, contralateral limb. To advance measurement precision, this study provides novel normative data for arm-to-leg ratios of ECF (R0) and ECF/ICF (Ri:R0) for comparison purposes. A key finding of this study was that interlimb ratios of Ri:R0 showed greater variation between subjects (up to 39.7%) compared with interlimb ratios of R0 (up to 14.9%). This observation builds on previous findings by Ward et al., 3 who reported greater variation in Ri:R0 values versus R0 values for arms (26.2%–27.4% vs. 12.0%–12.9%, respectively). This most likely reflects the larger error associated with estimation of Ri due to inflation of the combined errors associated with determination of R0 and Rinf. 28 Interlimb ratios of Ri:R0 also showed greater variation within individuals over time. Mean change ranged from 14.7% up to 67.1% for Ri:R0 ratios, compared with mean change of only 7.2% to 14.7% for R0 ratios. This suggests that diagnostic methods based on interlimb ratios of R0 may outperform interlimb ratios of Ri:R0.
The between-subject variation for arm-to-leg ratios was twice that for ratios between arms or between legs. Variation in arm-to-leg ratios was partially explained by the influences of sex, age, and body mass index, suggesting the need for stratified reference ranges for arm-to-leg ratios. Females had significantly higher mean ratios compared to males, revealing lower ECF in arms relative to legs compared to males. This is in line with previous research showing that females tend to have a lower proportion of their skeletal muscle mass distributed in the upper body.29,30
Increasing age was significantly associated with arm-to-leg ratios of R0. This was explained by decreasing values of R0 in the legs, indicating accumulation of ECF in legs with age. This was more pronounced in males compared to females. It has previously been shown that males experience a larger age-related reduction in arm, leg, and total skeletal muscle compared to females. 31 Together, these findings suggest that with increasing age, fluid shifts from skeletal muscle mass into the interstitial space and that this shift affects males more than females, and the legs more than the arms, most likely due to age-related vascular insufficiency. 32
Although increased body mass index was significantly associated with decreased arm-to-leg ratios of R0 on both sides of the body and increased Ri:R0 ratios on the dominant side, regression analyses suggest that BMI is less important than sex or age (Figs. 1 and 2). Based on these results, we suggest comparing data derived from at-risk populations to reference values stratified by sex and age (e.g., <40 years, 40–59 years, 60+ years).
Interarm ratios were not influenced by sex, age, or body mass index, suggesting that stratification for these factors is unnecessary in the assessment of unilateral upper limb lymphedema. This is in line with current clinical practice. Furthermore, the interarm ratios of R0 for females presented here (0.989 ± 0.069) are similar to those published previously (0.986 ± 0.040 and 0.964 ± 0.034). 3 However, sex was found to be associated with interleg ratios, with being male associated with lower R0 ratios (0.996 ± 0.054) compared to females (1.009 ± 0.080). A significant association between sex and interleg ratios was also reported by Ward et al., 5 who have previously published mean interleg ratios of R0 for males (0.994 ± 0.050) and females (0.999 ± 0.056). Despite both studies finding a significant effect of sex, the difference in means between females and males was small, equating to 1.3% for the current work and 0.5% for Ward et al. 5 making it unclear whether stratification by sex is necessary for interleg ratios. Nevertheless, given that comparing ECF between contralateral limbs is unsuitable for assessing bilateral lymphedema, which occurs in two-thirds of lower limb lymphedema cases,10–13 we predict that the use of arm-to-leg ratios will be more appropriate in the lower limb setting.
Future studies are required to compare the stratified normative data presented here with comparable data from a cohort of lymphedema cases to optimize diagnostic criteria. In addition to testing cutoffs based on the mean and SD calculated from stratified normative data, future research should investigate whether multivariable logistic regression or network-based discrimination methods can improve diagnostic accuracy. Furthermore, if routine bioimpedance assessment is extended to at-risk populations beyond the breast cancer clinic, information on whether a subject's change from baseline (or earliest measurement) exceeds normative change (e.g., 13.0%–14.3% for arm-to-leg ratios dependent on sex and dominance) could be used to further improve diagnostic accuracy.
Although the five studies all recruited healthy volunteers, samples were a mixture of population-based and convenience samples. Volunteers who come forward for a lymphedema-related study may differ from the general population. Another limitation of this study was the small sample size available for assessment of normative change, especially for males. It was not possible to investigate the effects of ethnicity or mixed laterality (e.g., right handed and left footed) on ratios in this study due to these data not being collected in all of the included studies.
In conclusion, this study has described the influence of sex, age, and body mass index on interlimb ratios of ECF and ECF/ICF, and presented stratified normative data and normative change data according to those factors. These findings provide the necessary platform for future research seeking to optimize early diagnosis of bilateral lymphedema and to extend bioimpedance-based screening beyond unilateral, cancer-related, upper limb lymphedema.
Footnotes
Acknowledgments
We thank and acknowledge the following organizations for contribution of funds that enabled this work to be completed: ImpediMed Limited (funds supported the data analysis for this body of work but not the original data collection studies); Cancer Council Queensland (SH fellowship and RB grant), National Health and Medical Research Council (MJ fellowship), Department of Health and Aging (RB grant), Fonterra Co-operative Group, and the New Zealand Ministry for Primary Industries (funds supported the New Zealand Primary Growth Partnership Post-Farm Gate Dairy Programme). Funding received had no influence over data analysis and reporting.
Author Disclosure Statement
No competing financial interests exist. LW provides consultancy services to ImpediMed Limited. ImpediMed Limited donated dual-tab electrodes to SG. SDP holds the Fonterra Chair in Human Nutrition at the University of Auckland. AR is an employee of Fonterra Co-operative Group. A.O. is the founder and managing director of SurgicalPerformance Pty Ltd., an Australian, private company that provides surgeons with a platform for collection of surgical outcome audit data; A.O. received travel grants from the O.R. Company (formerly Tyco Healthcare) and is a consultant for Covidien, NSW, Australia.
References
Supplementary Material
Please find the following supplemental material available below.
For Open Access articles published under a Creative Commons License, all supplemental material carries the same license as the article it is associated with.
For non-Open Access articles published, all supplemental material carries a non-exclusive license, and permission requests for re-use of supplemental material or any part of supplemental material shall be sent directly to the copyright owner as specified in the copyright notice associated with the article.