
Abstract
Abstract
Background:
Prospective lymphedema screening is recommended for breast cancer patients. We observed interoperator variation in perometer-acquired arm volume measurements (P-AVMs) due to patient instability during measurements. We hypothesized that improved positioning during perometry would reduce P-AVM variability.
Methods and Results:
Each arm was measured three times by each operator using a perometer. With the original configuration, P-AVM was performed by 2 operators in 30 patients and four cohorts of 5 to 6 operators in 5 volunteers. Repeatability, reproducibility, and gage precision/tolerance (P/T) ratio were calculated. A customized handlebar was installed to optimize patient positioning. P-AVMs were performed in 20 patients with both configurations. Student's t-test was used to compare variation. With the new configuration, P-AVMs were performed by three operators in five volunteers and five operators in three volunteers. Repeatability, reproducibility, and gage P/T ratio were calculated. For the original configuration, gage P/T ratio was 19.9% for two operators and 35.9% for four cohorts of five to six operators. One operator using the new handlebar decreased P-AVM variability by 28% (p = 0.02). For the new configuration, gage P/T ratio was 6.5% for three operators and 18.7% for five operators.
Conclusions:
Optimizing patient setup improved P-AVM accuracy. P-AVM accuracy is critical as lack of accuracy results in either overdiagnosis or underdiagnosis of lymphedema, which in turn results in either over- or undertreatment of this dreaded condition. A higher number of operators were associated with greater P-AVM variability.
Introduction
With advances in breast cancer treatments, recognition of treatment-associated complications has increased.1,2 For breast cancer survivors, lymphedema is one of the most dreaded complications of surgery, radiation therapy, and even some chemotherapeutics. This buildup of extracellular fluid within the upper extremity often results in swelling and may result in chronic skin changes, fibrosis, loss of sensation, deformity of the affected region of the body, and pain. 3 In addition, lymphedema has been demonstrated to have a negative impact on quality of life, body image, activities of daily living, and financial stress.4,5 Some have described the burden of living with lymphedema as greater than the burden of living with the cancer itself. 6 Lymphedema rates vary by local treatment. A recent literature review revealed a 6.3% rate (range 0%–23%) of lymphedema after sentinel lymph node biopsy and a 22.3% rate (range 11%–57%) after axillary lymph node dissection. 7
The diagnosis of lymphedema in breast cancer patients remains a significant challenge due to the lack of both a standard criteria and standard detection methods. The perometer, a device utilizing optoelectronic technology to quantify limb volume, has been adopted for use by many centers due to its simplicity of use and high intrarater reliability.8,9
Observation of perometer use at our center revealed significant measurement variability, resulting in concerns regarding both overdiagnosis and underdiagnosis of lymphedema. Observation suggested that the primary source of variation was unstable positioning of subjects. The perometer manufacturer recommends that patients place their arms in an upright position, perpendicular to the ground. For many, particularly those undergoing arm volume measurement after breast surgery, holding the arm upright is a challenge, which may result in variation from one measurement to the next due to arm positioning. We designed stability devices to assist staff with proper patient positioning during perometer measurements. In this study, we tested the hypothesis that improving patient positioning would reduce variability in the perometer-acquired arm volume measurement (P-AVM) and thereby reduce both underdiagnosis and overdiagnosis of lymphedema. Our secondary hypothesis evaluated the impact of multiple operators on P-AVM. The gage precision/tolerance (P/T) ratio was chosen due to our interest in the variability of the machine itself as the gage P/T ratio has been used in industry to test the interaction between operators and machines.
Materials and Methods
Measurement system analysis
Measurement system analysis (MSA) is a quality management tool originally used in the automotive industry and is part of Lean Six Sigma. 10 As a part of MSA, the reliability of measurements, in particular the precision and accuracy of measurements, is calculated. Gage P/T ratio is used to quantify the precision and accuracy of a measurement procedure (Fig. 1). 11 The gage P/T ratio is divided into three components, repeatability, reproducibility, and part-to-part variability, each of which contributes to the overall gage P/T ratio. Repeatability is a measure of the likelihood of the same operator using the same measurement tool on the same product obtaining the same output value at multiple instances. Reproducibility is a measure of the likelihood of distinct operators using the same measurement tool on the same product obtaining the same output value. Part-to-part variability is the variability between each patient. The variation of a given measurement is the sum of the variation due to the operator (σrepeatability), variation due to error (σreproducibility), and variability in the object being measured (patient-to-patient variability in the case of medical applications). An analysis of variance calculation is performed for each of these three sources of variation. The gage P/T ratio is defined as follows:
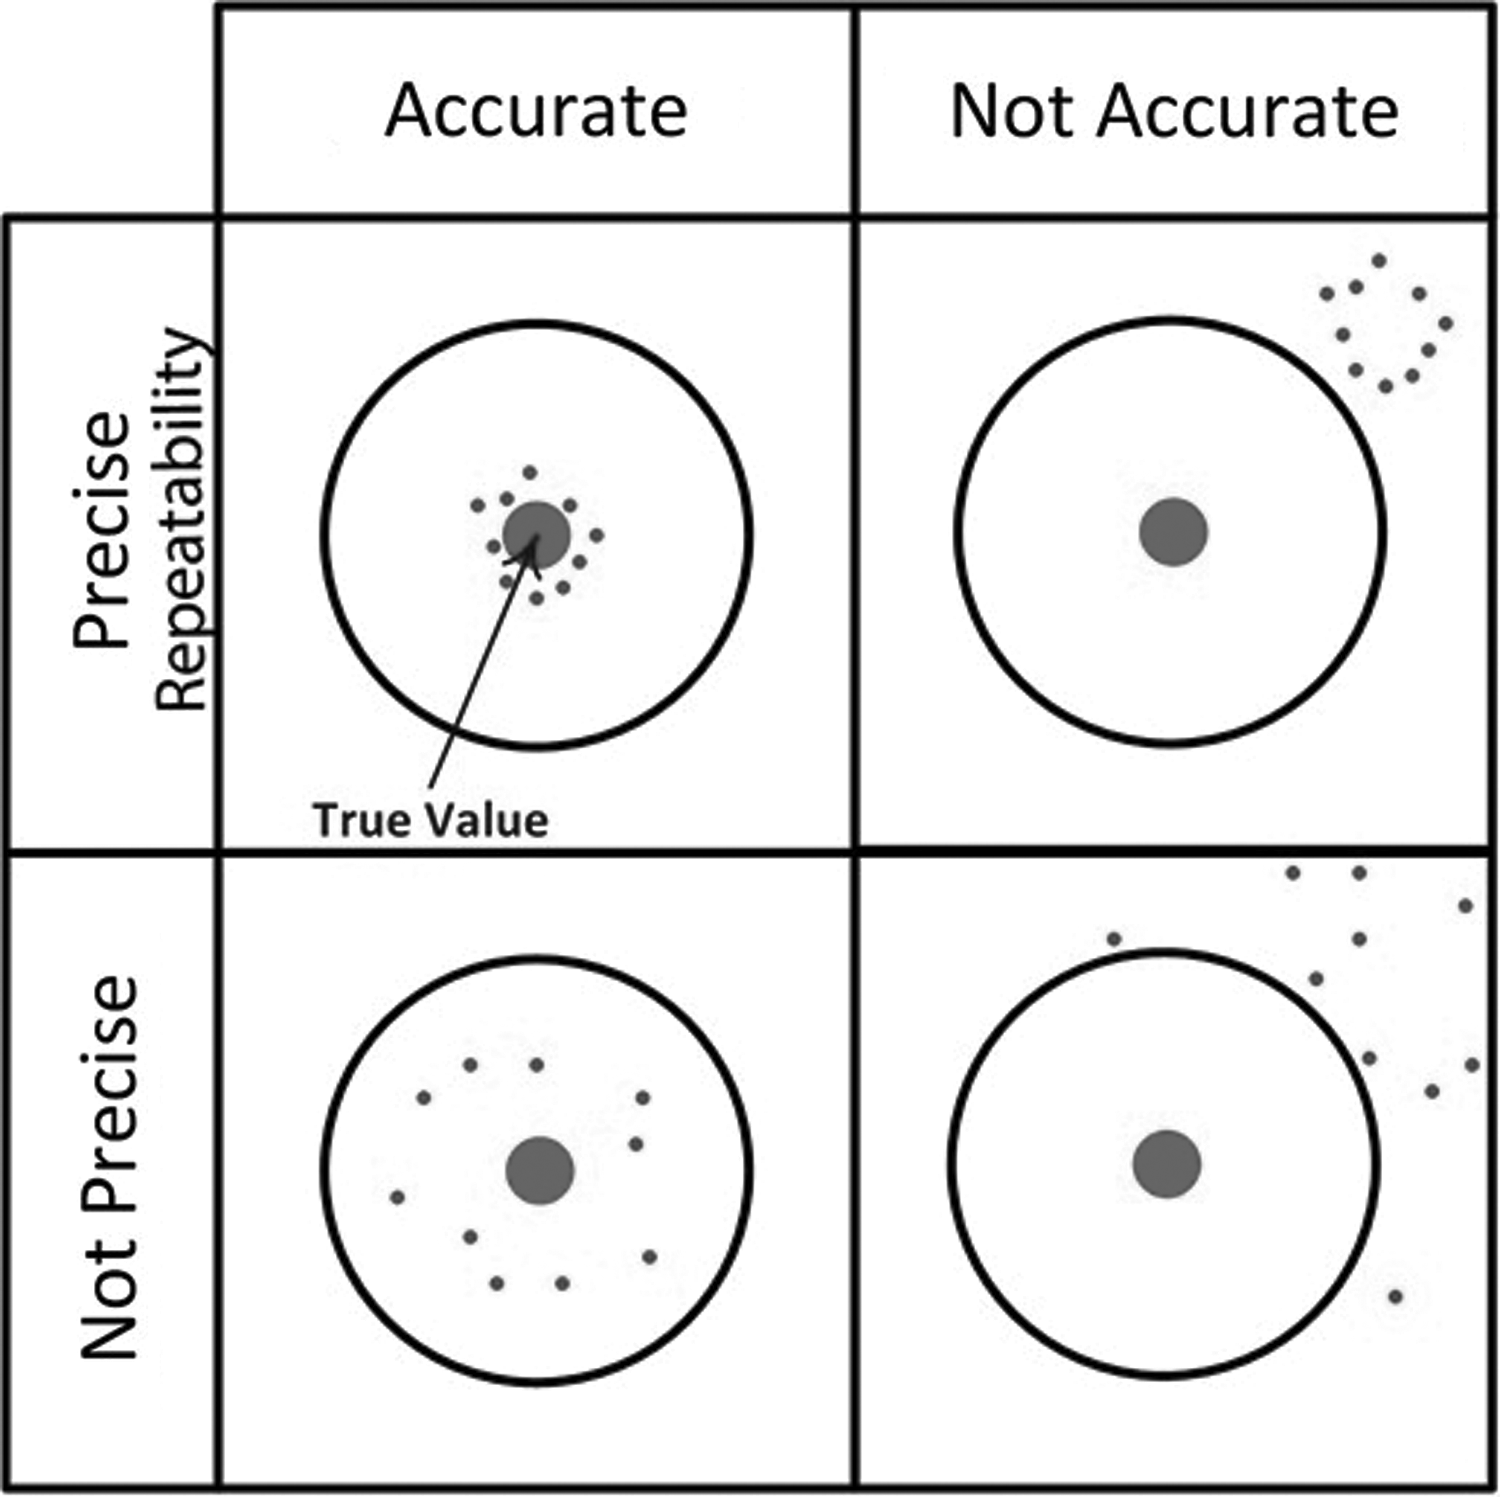
The gage R&R provides a quantification of the precision (or repeatability) of a measurement when multiple operators are utilizing a given measurement tool. The gage R&R also quantifies accuracy, the proximity of the measurements obtained to the true value.
Possible values of P/T ratio range from 0% to 100%. Per industry standards, a gage P/T ratio of <10.0% indicates that a measurement procedure is acceptable for use, 10.0% to 30.0% indicates that a measurement procedure is acceptable for use with caution, and >30.0% indicates that a measurement procedure is unacceptable. An important caveat is that acceptance of a measurement system should always include an analysis of the broader context in which these measures are obtained.11,12
Institutional perometry procedure
At our institution, for breast cancer patients, a Perometer 400NT (Perosystem) is used to quantify arm volume to enable assessment of lymphedema. Patients sit on an adjustable stool with their arm exposed and grip a manufacturer-provided handlebar next to the stool while holding their arm perpendicular to the machine (Fig. 2). To ensure that a consistent length of the arm is used for each measurement, an elastic band with an adjustable bead is placed around the patient's arm with the bead positioned at the ulnar styloid. The volume of the arm from the level of the bead to a point either 35 or 40 cm proximal to the bead is then measured, with the length chosen on the basis of the length of the arm and the patient's comfort. The same segment of arm was measured for all measurements in the same patient. Perometers have an open frame that is moved around the extremity to create an image of the extremity and calculate volume. The operator lifts the frame of the perometer from the floor to the axilla without touching the patient and then returns the frame to the ground. PeroPlus software is used to generate a visual image of the arm (Fig. 2), and the operator determines the start and stop points for the volume measurements based on this pictograph.
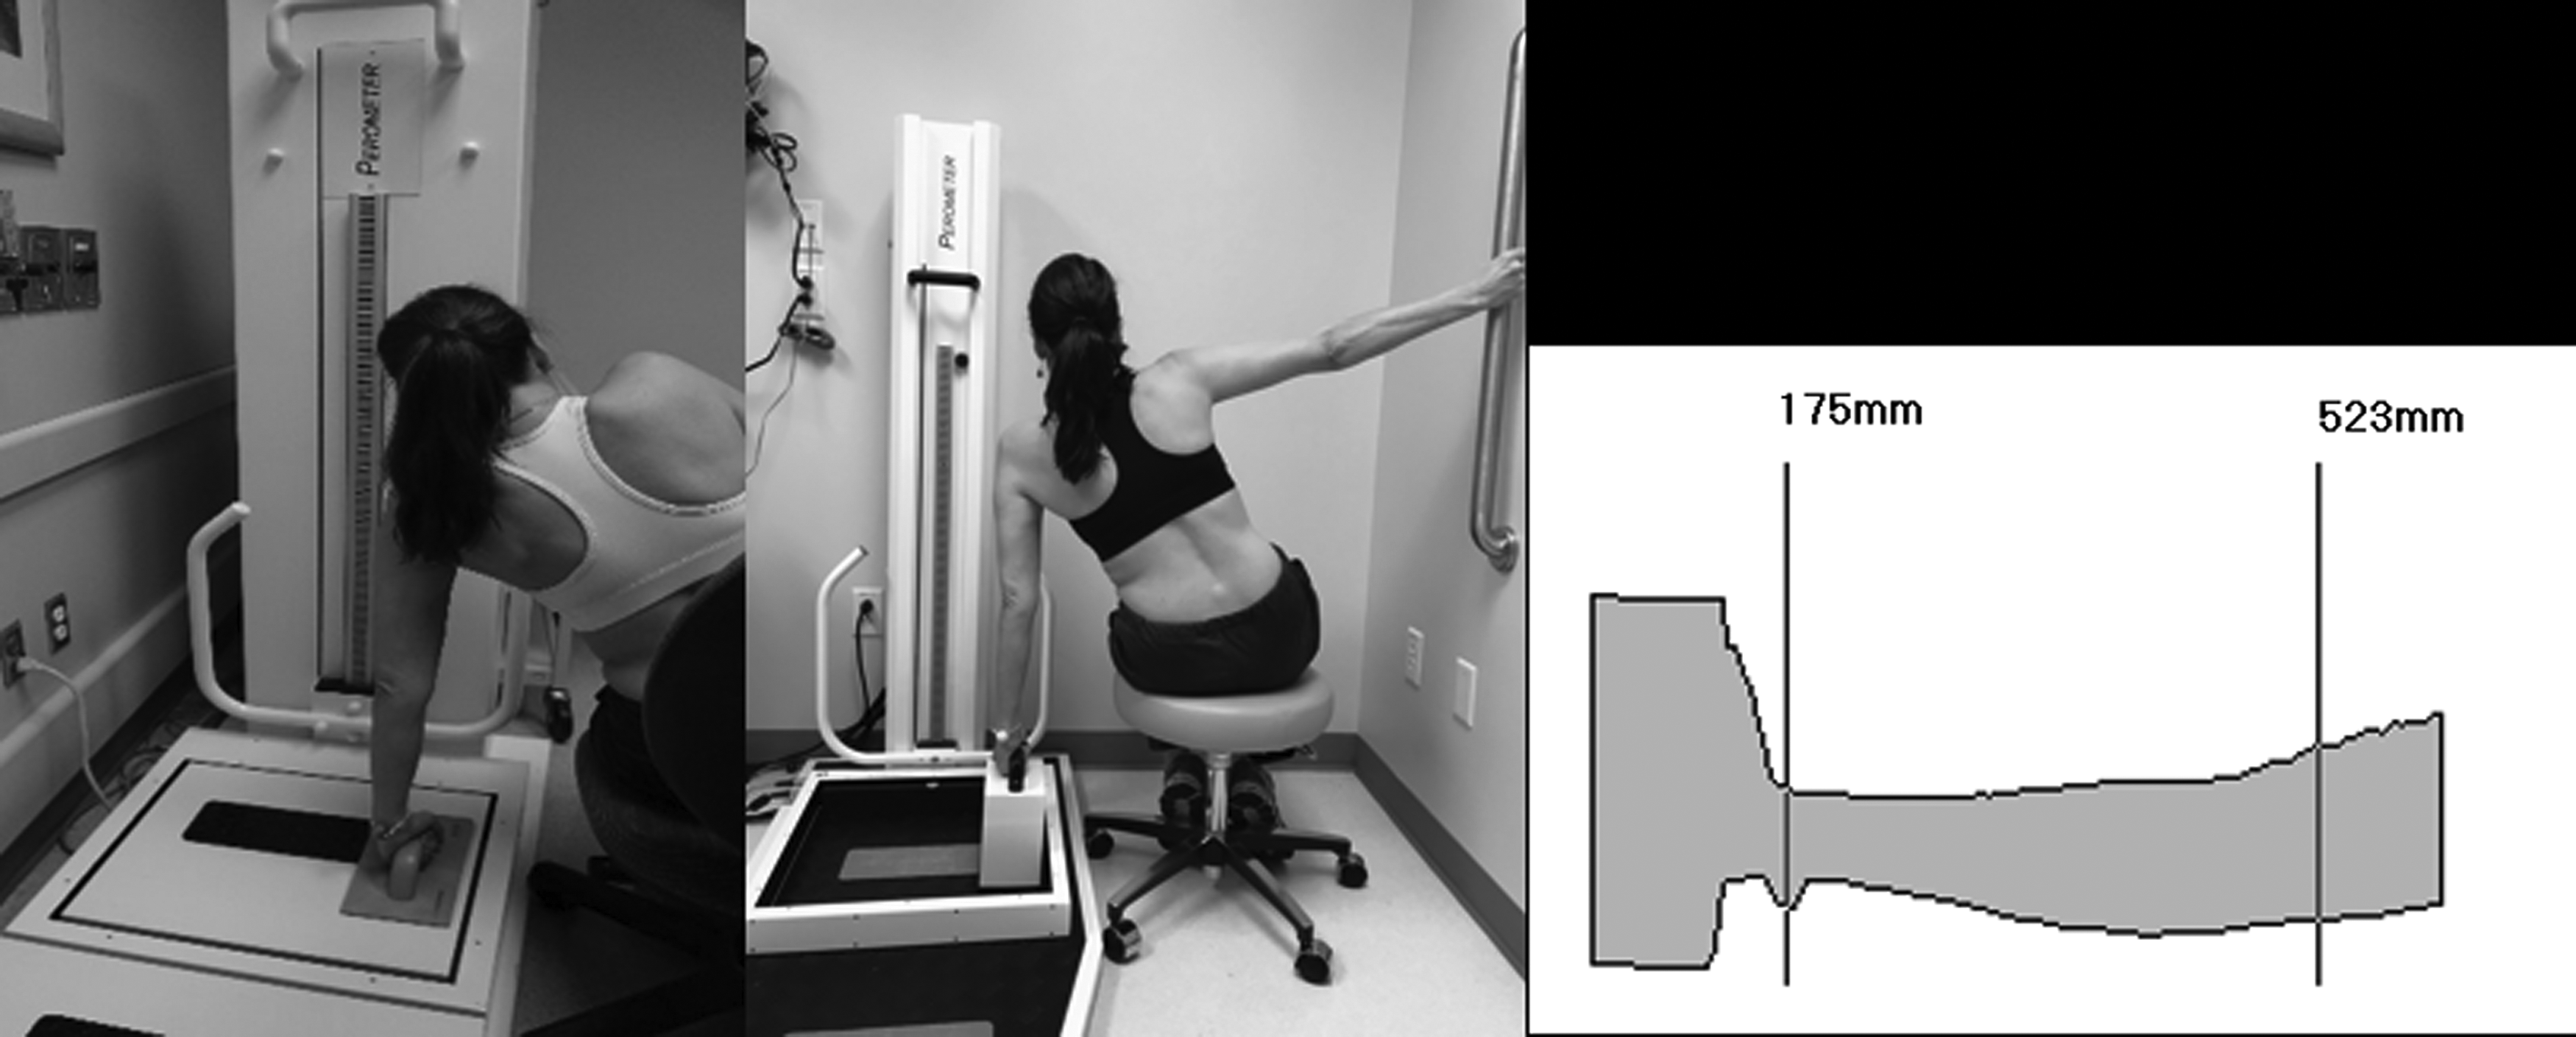
Left image: Original patient setup for measurement using the manufacturer provided handlebar. Middle image: Revised patient configuration using higher handlebars and a wall mounted bar. Right image: selection of the length of the arm to be measured in the volume output of the perometer.
At our institution, seven upright perometers and one horizontal perometer are available at seven different clinic and hospital locations for limb volume measurements. The upright perometers can easily measure both upper and lower limb volumes, whereas the horizontal perometer is primarily used to measure upper limb volume. A total of 23 therapists, 2 medical assistants, and 3 research staff have been trained to measure arm volume. All users were trained by a lymphedema-certified senior physical therapist (M.L.T.) and undergo annual assessment of their techniques. The work outlined was approved by the Quality Improvement Assessment Board of The University of Texas MD Anderson Cancer Center.
Baseline calibration
First, P-AVMs were obtained in patients gripping the manufacturer-provided handlebar during perometry. Thirty patients were measured by two operators using a single upright perometer. In each patient, each operator obtained three volume measurements per arm (n = 360). Lymphedema was defined as a volume difference of 10% or more between the arm on the side without breast surgery and the arm on the side with breast surgery. Repeatability, reproducibility, and gage P/T ratio were calculated. Regression analysis was applied to determine any association between patient body mass index, height, or weight and variability in measurements. Type I (overdiagnosis) and type II (underdiagnosis) errors were calculated by knowing the standard deviation of our measurement system through the gage P/T results and assuming a normal distribution for the measurement results.
Linearity and bias
We also measured the accuracy of P-AVMs across a range of arm volumes (“linearity”). We obtained five tubes of known diameter (33.4, 48, 60.1, 88.7, and 113.6 mm, measured using calipers) made of polyvinyl chloride and measured the volume of each tube 10 times in the perometer. Volume was calculated using the formula for calculating the volume of a cylinder.
We also measured bias, a quantification of how a measurement compares with a reference value. A single polyvinyl chloride tube 113.6 mm in diameter was maintained in a stable position within the perometer and measured 30 times. The tube was then moved to a distinct location within the perometer and maintained in a stable position and measured 30 more times.
Larger group assessment
To examine the impact of number of operators on variability in arm volume measurements, we next analyzed variability when perometry was performed by more operators. Twenty-three therapists of mixed skill level (physical therapists, occupational therapists, and physical therapy assistants) were divided into four cohorts of five to six therapists each. Using a single upright perometer, each cohort measured five healthy volunteers of different body mass index (normal, overweight, and obese). Type I (overdiagnosis) and type II (underdiagnosis) errors were calculated for each of the four operator cohorts.
Optimization of patient positioning
Next, three new handlebars of various heights and a wallbar were created and installed (Fig. 2). One operator measured each arm of 20 patients three times using both this new configuration and the original configuration (the manufacturer-provided handlebar and no wallbar). For perometry with the new configuration, the operator and patient jointly selected the new handlebar that optimized patient comfort and arm position perpendicular to the ground. Variation was calculated as the standard deviation of the three arm measurements divided by the average of the mean of the three arm measurements. Variation was calculated for each of the two positioning configurations and compared using Student's t-test.
Perometry with the new configuration
To determine whether this novel patient setup reduced variability in a larger group of operators, we next examined whether this novel setup reduced error in a larger group of operators. With this new configuration, three therapists measured five volunteers three times each. Then a group of five therapists of mixed skill level measured three volunteers of different body mass index three times each. Type I (overdiagnosis) and type II (underdiagnosis) errors were again quantified.
Application to arm measurement with a tape measure
Because perometers are not widely utilized in the United States to measure arm volume, we calculated the variability associated with arm measurement using a tape measure. We defined variability for both tape circumference measurement of the arm and associated arm volume calculations derived from the circumference measures. Four therapists measured the arm circumference of three volunteers at five points along the upper extremity three times for each measurement. Gage P/T ratio was calculated for (1) arm circumference measurement using a 2 cm circumference difference threshold to define lymphedema and (2) arm volume calculations using a 10% volume difference threshold with the formula derived from a cone using the arm circumference measurements.
Results
Baseline calibration
When 2 operators measured 30 patients with the original configuration, the gage P/T ratio was 19.9%, which was acceptable with reservation by industry standards, repeatability was 65.0%, and reproducibility was 19.0%. This resulted in overdiagnosis and underdiagnosis rates of 3.5% and 2.3%, respectively, based on a 10% volume difference threshold and 18.2% and 17.0%, respectively, based on a 5% volume difference threshold (Fig. 3). Univariate analysis was performed for variability with the following factors: body mass index, height, and weight, which were all individually significant (p < 0.001, p = 0.003, and p < 0.001, respectively). We then calculated multiple regression analyses and found that the model including only height and body mass index had the highest R-squared value (R 2 = 16.27) (Table 1).
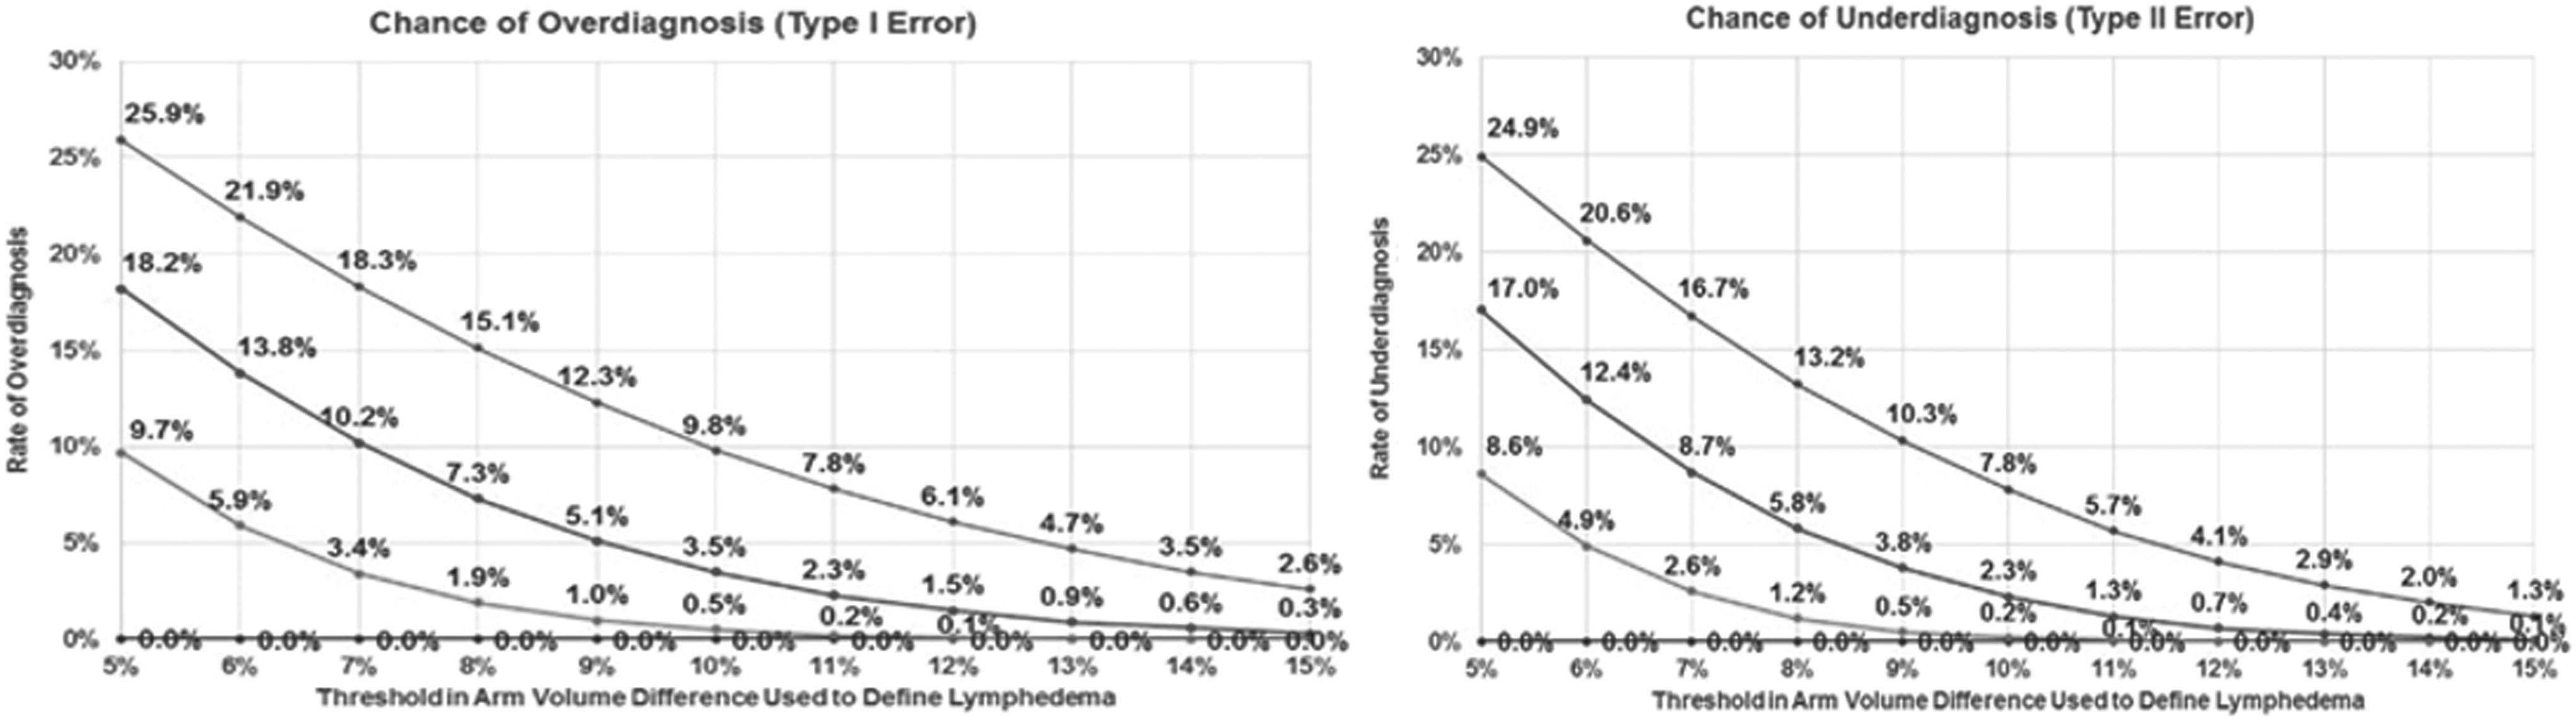
Initial rate of overdiagnosis and underdiagnosis by varying arm volume thresholds.
Regression Analysis for Analysis of Variance
DF, degrees of freedom; Adj SS, adjusted sums of squares; Adj MS, adjusted mean squares.
When four cohorts of five to six therapists measured five volunteers with the original configuration, overdiagnosis and underdiagnosis rates were 9.8% and 7.8%, respectively, based on a 10% volume difference threshold and 25.9% and 24.9%, respectively, based on a 5% volume difference threshold.
Optimization
When 1 operator measured 20 patients with the original configuration and again with the new configuration, the results showed that the new configuration reduced the variation in limb volume by 28% (p = 0.02) (Fig. 4).
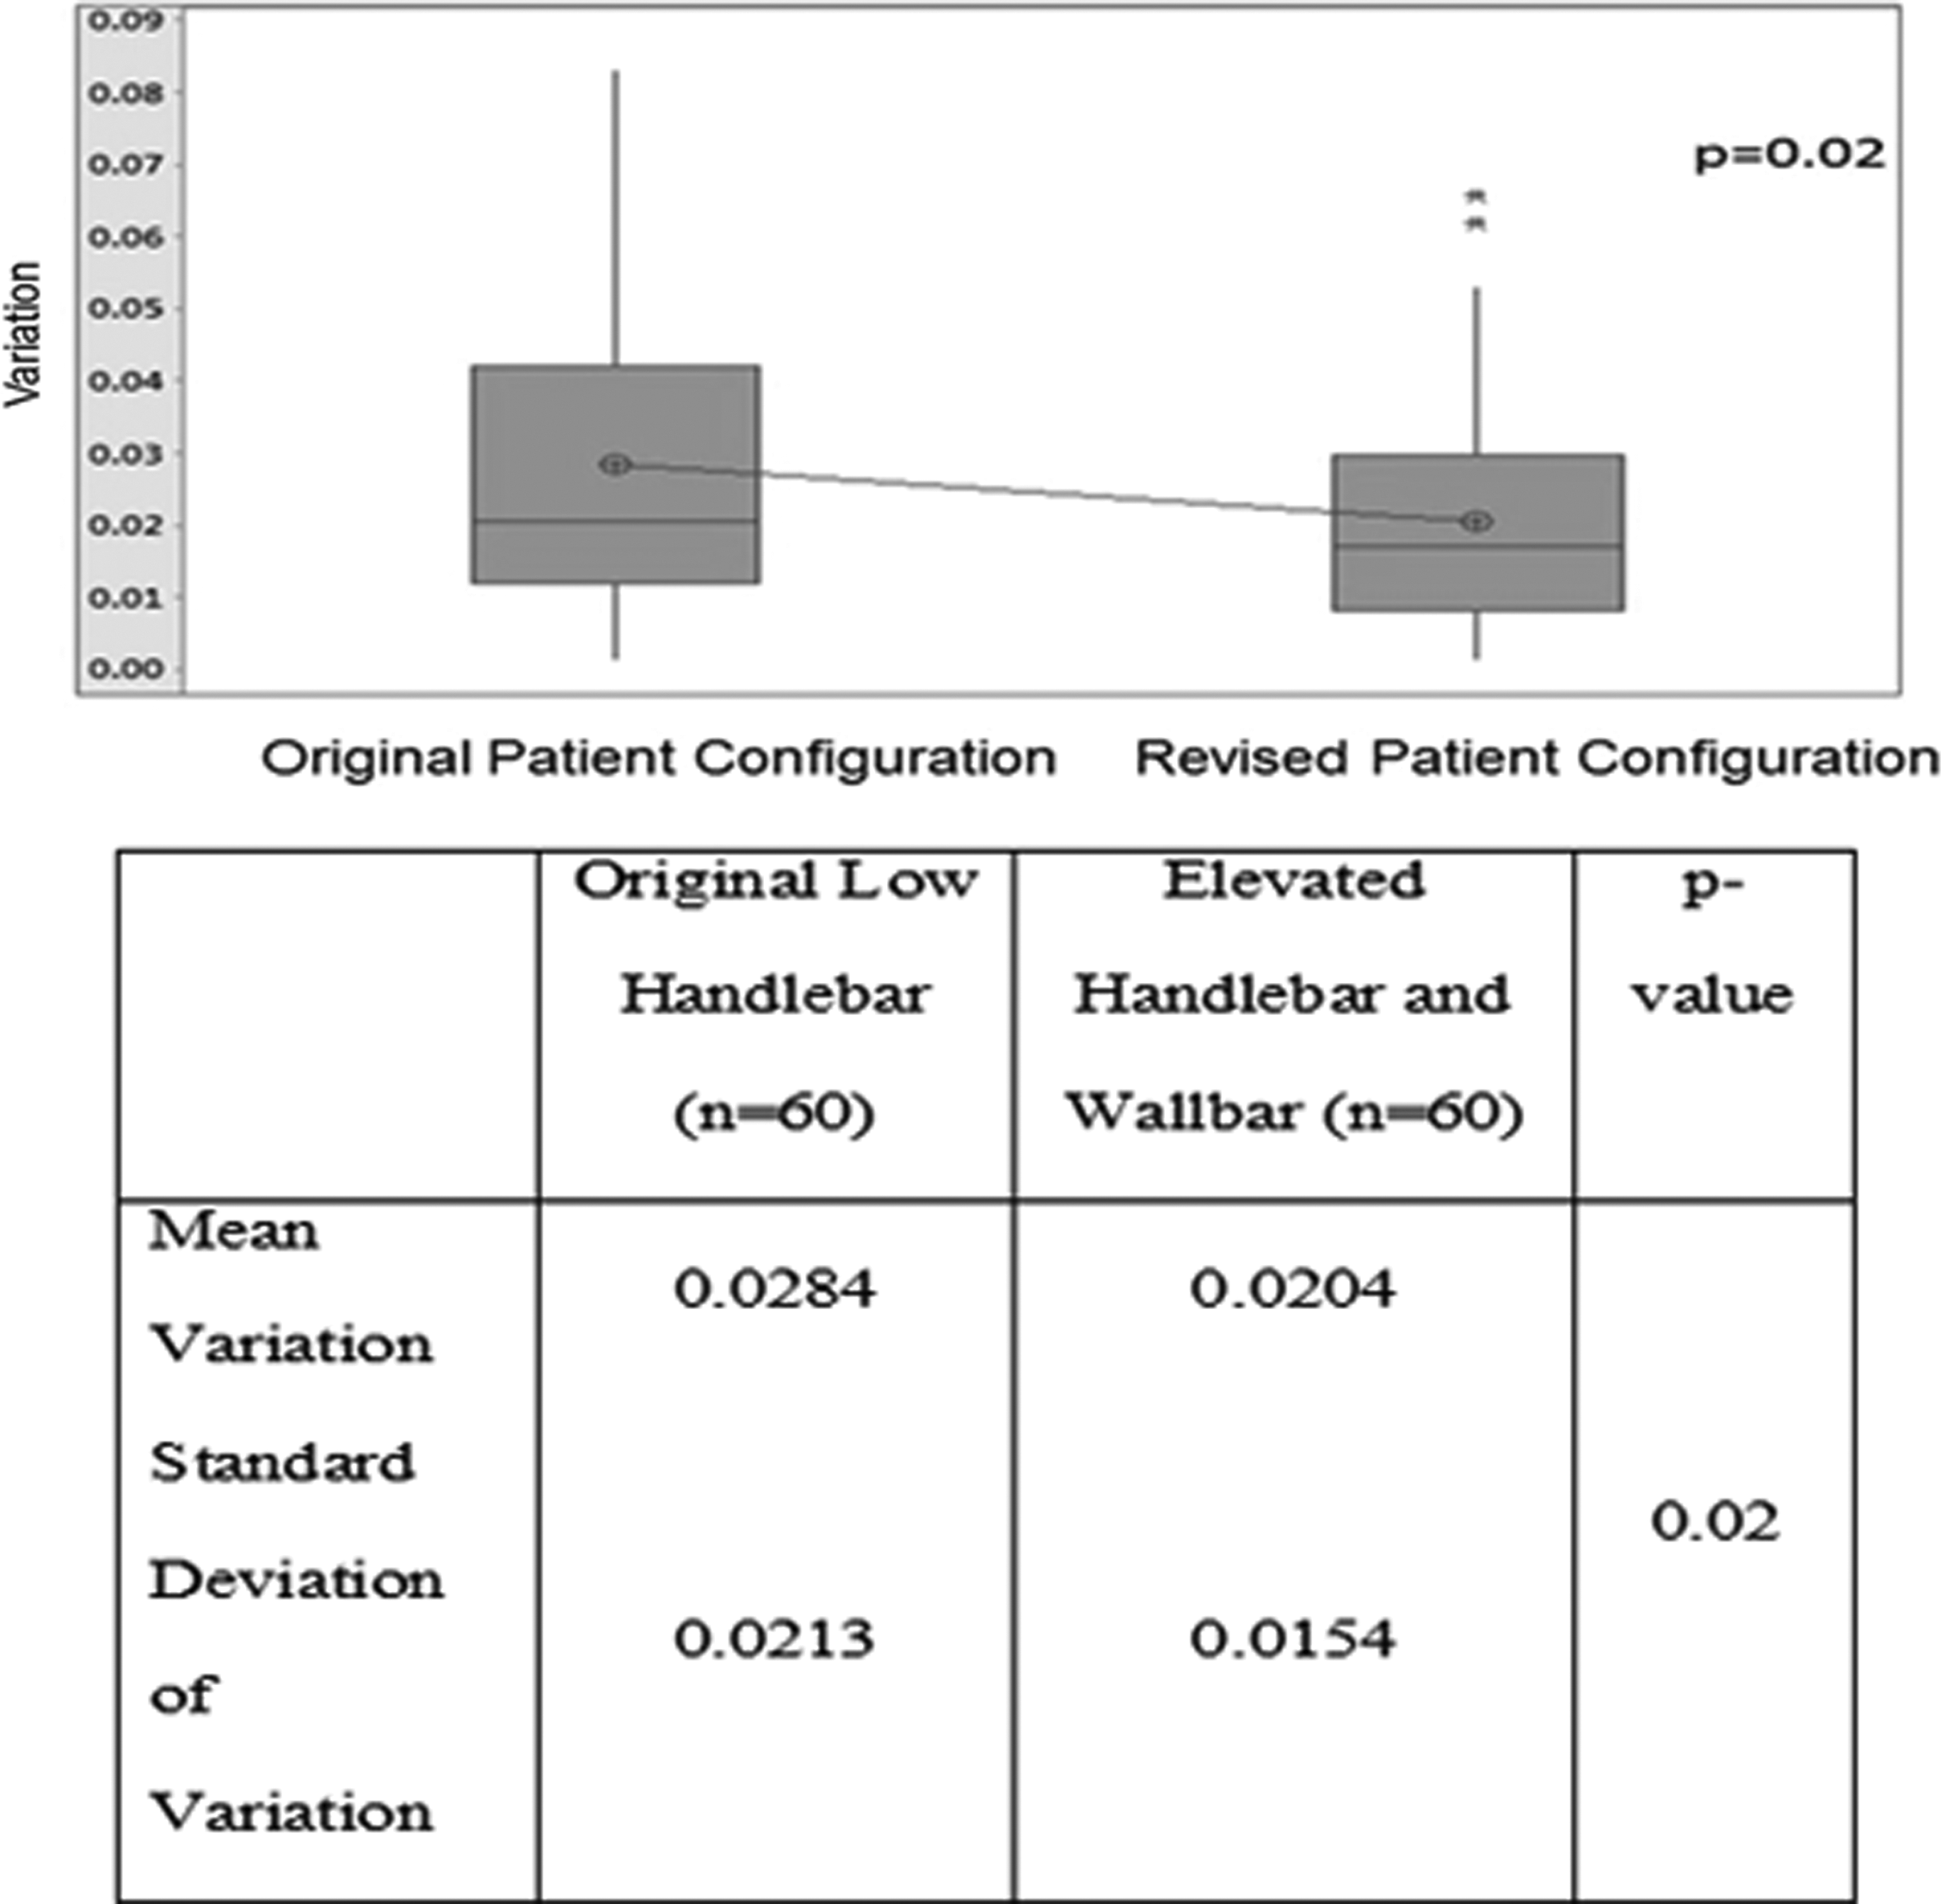
Boxplot of the variation in arm volume measurements (mean variation and standard deviation of the mean) with the original and revised patient setup configuration.
Perometry with the new configuration
When three therapists measured five volunteers with the new configuration, the gage P/T ratio was 6.5%, repeatability was 2.4%, and reproducibility was 6.1%. The overdiagnosis and underdiagnosis rates were 0.00% and 0.00%, respectively, based on a 10% volume difference threshold and 0.04% and 0.02%, respectively, based on a 5% volume difference threshold.
When five therapists measured three volunteers with the new configuration, the gage P/T ratio was 18.7%, repeatability was 15.0%, and reproducibility was 11.0%. The overdiagnosis and underdiagnosis rates are shown in Figure 3.
Linearity and bias
Of the total gage variability, 0.17% was due to linearity and 2.0% (p < 0.0001) was due to bias. This implies that neither gross measurement of a still object by the perometer nor the variability in the measurement acquired over a range of sizes of what is being measured (in our clinical case, arm volume) contributed to a large extent to the process variation.
Tape measure-based calculations
Examining arm circumference measurements, looking at a single point of measure, for 10 cm above the elbow and 10 cm below the elbow, the gage P/T values were 14.0% and 17.0%, respectively. Volume calculations of the arm derived from the circumference measurements using the formula of a truncated cone revealed a gage P/T ratio of 9.7%.
Conclusions
Quantification of process variability is an important first step to implement initiatives aimed at ensuring quality lymphedema assessments. Our study revealed that use of a higher perometer handlebar as well as a wallbar decreased P-AVMs with an upright perometer by 28%. Although rates of both underdiagnosis and overdiagnosis were higher at a 5% volume difference threshold than at a 10% volume difference threshold, both were reduced with the use of both a higher handlebar and a wallbar. As a result of our study, the perometers at our institution have been equipped with both a higher handlebar on the perometer and a wallbar to achieve the most accurate P-AVMs. Our study results also highlight the increased variability in arm P-AVMs when performed by multiple operators. Notably, we also found that a traditional method of quantifying lymphedema, circumferential tape measure, contained variability with multiple operators. This variability was decreased when multiple circumferential tape measurements were incorporated into a truncated cone formula, whereas a single arm circumference measurement was not found to have robustness in terms of repeatability and reproducibility.
Variability in health care
To date, there has been only limited use of MSA tools to assess the quality of measurements in health care, a trend we anticipate may change with increasing focus on quality improvement as exemplified by the American Society of Clinical Oncology Quality Care Symposium Training Program. To date, gage P/T tools have been implemented to evaluate repeatability and reproducibility of laboratory tests examining coagulation body temperature evaluation, corneal thickness measurements, and blood pressure measurements using a sphygmomanometer.13–16 There remains significant room for growth of awareness in the medical community that the tests upon which we rely for clinical decision making may have greater variability than providers realize. Lean Six Sigma methodologies also have the potential to improve efficiencies and accuracies in health care processes.
Advances in measuring lymphedema
Recently, the National Comprehensive Cancer Network Breast Cancer Panel adopted guidelines for breast cancer survivors that emphasized the importance of standard monitoring for lymphedema and, if necessary, initiation of treatment. 17 Perometers have been demonstrated to be both efficient and hygienic. However, the cost of perometers as well as the large footprint required for these machines may limit their availability in many centers.
Although there have been increased lymphedema education efforts, the development of lymphedema continues to be a feared result of breast cancer treatments. 18 Previously, patients at risk for lymphedema were provided with a list of don'ts for the at-risk arm, including avoiding venipunctures, injections, intravenous line placement, blood pressure measurement, and lifting with the at risk arm. Although newer prospectively collected data have refuted that these events result in an increased risk of lymphedema for at-risk patents, most will adopt between four and five behaviors perceived to reduce their risk.18,19 This demonstrates the strong desire of patients to avoid this complication.
Underdiagnosis of lymphedema has multiple consequences for patients. Certainly, delayed diagnosis of lymphedema results in a delay in treatment. Studies have demonstrated that early detection and treatment allow for less intensive treatment and ultimately improve outcomes.20–23 Patients with lymphedema who go untreated may have symptoms of lymphedema. It is known that symptoms resulting from lymphedema are greater predictors of reduced quality of life than limb volume changes.24–26 In addition, patients with prolonged symptoms of lymphedema are at risk for decreased quality of life due to depression, decreased activity, and decline in body image.24,27,28 Comparison of the cost of prospective lymphedema surveillance with treatment of early stage lymphedema to a traditional model of detection with treatment of late-stage lymphedema found that treating patients with early stage lymphedema costs significantly less ($636.19 per year) than treating those with late-stage lymphedema ($3124.92 per year). 29 This highlights the fiscal importance of both early detection and timely treatment for patients with lymphedema.
Overdiagnosis of lymphedema also has a significant impact on patients. Patients who are inaccurately diagnosed with lymphedema may be subjected to unnecessary treatments that are both costly and time consuming. In addition, the recommendation to wear a compression garment may result in self-consciousness about the diagnosis and its visible treatment. It is also known that patients with lymphedema incur significantly higher health care costs, with outpatient care representing the majority of this cost with an annual cost estimated at $2243 per patient, decreasing by 18% after pneumatic compression device utilization.30,31 This implies that adequate diagnosis and treatment are effective in decreasing lymphedema-related health care costs.
Our findings have important implications for trials utilizing lymphedema as an end point. A recent literature review revealed a wide range of lymphedema rates across studies: 6.3% (range, 0%–23%) after sentinel lymph node biopsy and 22.3% (range, 11%–57%) after axillary lymph node dissection. 7 Reported lymphedema rates have been widely variable for a variety of reasons, including differing definitions of lymphedema, lack of standardized measurement techniques, and even variability within the utilized technique.32–35 At our institution, the perometer is utilized to obtain arm volume measurements. Owing to the large footprint required for this machine as well as the high upfront cost, perometry may not be feasible for other institutions to utilize for obtaining arm volume measurements. However, there is a critical need to ensure that, regardless of the technique utilized, measurements are obtained in a standardized manner with a focus on minimizing variability. This is of particular importance for multicenter trials utilizing arm volume measurements as an end point.
There is a critical need to accurately measure arm volumes in patients at risk for lymphedema. Our study demonstrates the importance of maintaining stable patient positioning during perometer measurements and the need to quantify variability in arm volume measurements. For centers using multiple operators, attention should be paid to the impact this might have on measurement reliability and reproducibility.
Footnotes
Author Disclosure Statement
Dr. S.M.D. is The University of Texas MD Anderson Cancer Center Principal Investigator for research funding distributed to her institution from Impedimed. All other authors have no competing financial interests.