
Abstract
Background:
Primary lymphedema is genetically heterogeneous. Two of the most common forms of primary lymphedema are Milroy disease (MD) and lymphedema-distichiasis syndrome (LDS). This study aims to look further into the pathogenesis of the two conditions by analyzing the lymphoscintigram images from affected individuals to ascertain if it is a useful diagnostic tool.
Methods and Results:
The lymphoscintigrams of patients with MD and LDS were analyzed, comparing the images and transport parameters of the two genotypes against a control population. Lymphoscintigrams were available for 12 MD and 16 LDS patients (all genetically proven diagnoses). Eight of the 12 (67%) lymph scans performed on patients with MD demonstrated little or no uptake from the initial lymphatics and poor visualization of the inguinal lymph nodes. These changes were consistent with a “functional aplasia,” that is, the lymphatic vessels were present but appeared to be ineffective in absorbing the interstitial fluid into the lymphatic system. In patients with LDS the lymphoscintigraphic appearances were different. In 12 of the 16 scans (75%), the lymph scans were highly suggestive of lymphatic collector reflux. Quantification revealed a significantly reduced uptake of tracer within the inguinal lymph nodes and a higher residual activity in the feet at 2 hours in MD compared with LDS and compared with controls.
Conclusion:
Lymphoscintigraphic imaging and quantification can be characteristic in specific genetic forms of primary lymphedema and may be useful as an additional tool for in-depth phenotyping, leading to a more accurate diagnosis and providing insight into the underlying mechanism of disease.
Introduction
The primary function of the lymphatic vasculature is to absorb the protein-rich fluid that is filtered from blood capillaries into the interstitial spaces. This fluid is absorbed in the first instance by the initial lymphatic vessels and then transported through larger collecting lymphatic vessels to the thoracic duct through lymph nodes, and ultimately to the cardiovascular circulation. Collecting lymphatic vessels possess valves that prevent lymphatic backflow when the smooth muscle cells in the walls of the vessels systematically contract to pump the lymph proximally. 1
Primary lymphedema is caused by a developmental defect in the lymphatic system and leads to chronic swelling, which most often occurs in the lower limbs. Two of the most frequent genetic forms of primary lymphedema are Milroy disease (MD; OMIM 153100) and lymphedema-distichiasis syndrome (LDS; OMIM 153400). Both show autosomal dominant inheritance and causative genes have been identified for each condition.
MD is caused by pathogenic variants in the FLT4 (VEGFR3) gene on chromosome 5, which codes for vascular endothelial growth factor receptor 3 (VEGFR3).2,3 All pathogenic variants to date have been located in the tyrosine kinase domain.4,5 Patients usually present with lower limb swelling at birth, most often the dorsum of the feet (Fig. 1a). The swelling is almost always distal to the knee. Common features include marked pedal edema, deep interphalangeal creases of the toes and small dysplastic nails (Fig. 1b). In many patients, the lower limb veins are of large caliber indicating venous involvement. 6 One third of affected males are born with, or will develop, hydroceles. 7 The swelling of the dorsum of the feet can sometimes be seen in utero on antenatal ultrasound examination.
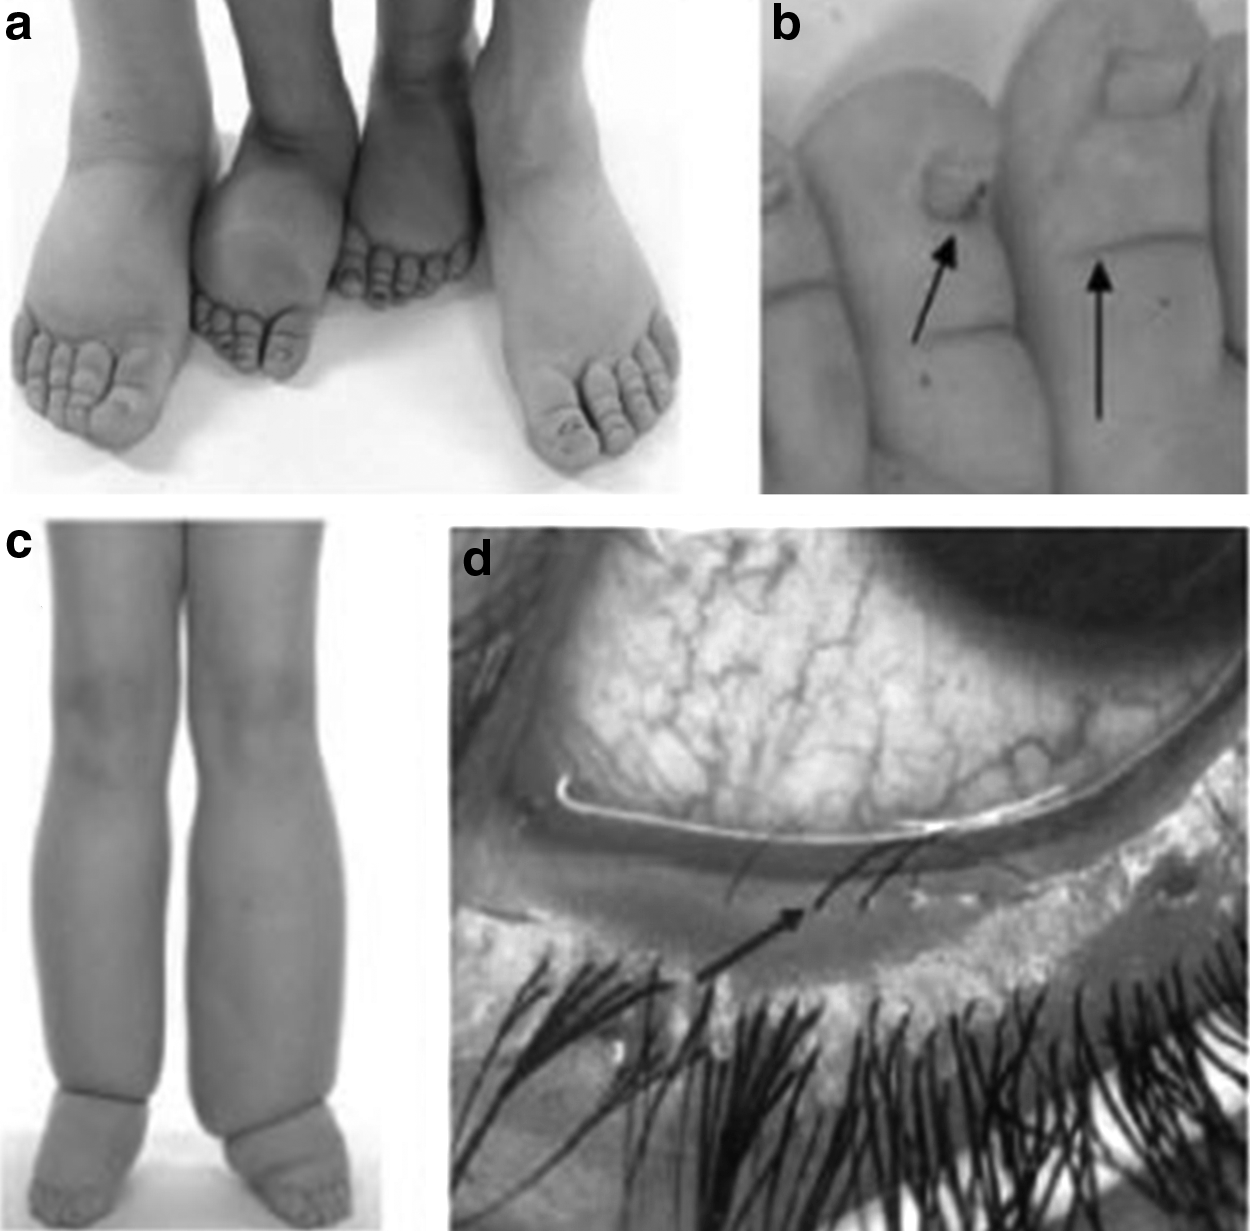
Phenotypic features observed in MD and LDS.
Until recently, MD was thought to be due to aplasia of the initial lymphatic vessels. Mice with a heterozygous, inactivating Vegfr3 mutation and swelling of the limbs are lacking subcutaneous lymphatic vessels. 8 However, analysis of skin biopsies from patients with FLT4 (VEGFR3) mutations showed that dermal lymphatic vessels were not absent, but that their density was reduced by 51%–61% in the foot and 26%–33% in the forearm. 6 This study demonstrated that the lymphatic vessels in the feet of patients with MD have profound functional failure as lymphatic filling was reduced by 86%–91% compared with controls. Despite a reduction of the number of lymphatics in the forearm, there was no reduction in function. Furthermore, 9 out of the 10 patients studied exhibited saphenous vein reflux. The presence of venous reflux indicates that FLT4 (VEGFR3) has a role in venous development as well as lymphatic development. 6
LDS is caused by heterozygous, loss of function, pathogenic variants in the forkhead box transcription factor C2 gene (FOXC2).9,10 Phenotypic features of LDS include late onset swelling of the lower limbs (Fig. 1c) typically around puberty but can be as late as the fifth decade. Other features include distichiasis (aberrant eyelashes growing from the meibomian glands in the inner eyelids) (Fig. 1d), a high incidence of varicose veins, ptosis, congenital heart disease, and cleft palate. 11
FOXC2 is expressed in lymphatic and venous valves. Defective valves and abnormal recruitment of smooth muscle cells around lymphatics have been demonstrated. Valve failure is thought to give rise to lymph and venous reflux in the erect posture. 12
Early diagnosis of both conditions is important for appropriate management. Access to diagnostic genetic testing may not be available in many lymphedema clinics. However, the majority of radiology departments should be able to undertake lymphoscintigraphy. Lymphoscintigraphy has been established as a gold-standard investigation for lymphedema.13,14 A representative image of the lymph drainage pathways may be produced using a gamma camera after an interdigital injection (e.g., in the web space between the toes) of a radiolabeled tracer (e.g., colloidal albumin labeled with technetium-99m [99mTc]) (Fig. 2). If applying a standardized protocol, reproducible imaging can be obtained, 15 and it is recommended that compression stockings be removed before injection and for all subsequent imaging. 16 Lymphoscintigraphy has predominantly been used as a qualitative measure, evaluating the appearance and number of lymph nodes in the axilla or groin, but quantitative measures can also be given17,18 and can prove to be a more sensitive approach to the diagnosis. 19 In this study, we describe the lymphoscintigraphy findings in patients with pathogenic variants in either the VEGFR3 or FOXC2 gene.

Lower limb lymphoscintigraphy in an unaffected subject showing symmetrical migration of radionuclide (technetium-99) through discrete lymph vessels up into the inguinal lymph nodes 2 hours after injection.
Materials and Methods
Design
A retrospective analysis of records of patients seen in the specialist Primary and Pediatric Lymphedema Clinic at St George's University Hospitals NHS Foundation Trust was carried out. Using the Primary Lymphedema Register, all patients with pathogenic variants in FLT4 (VEGFR3) (MD) and FOXC2 (LDS) were identified. All genetic testing was performed in the DNA laboratory at the SW Thames Regional Genetics Service. Those who had undergone lymphoscintigraphy were identified and their scans evaluated.
Participants (affected individuals)
A total of 169 patients were identified, 104 patients had a pathogenic variant in FLT4 (VEGFR3) (NM_182925) and 65 had a pathogenic variant in FOXC2 (NM_005251). Patients who did not have lymphoscintigrams were excluded (n = 140). One lymphoscintigram was excluded, as there were no quantification values. Twelve patients with MD and 16 patients with LDS were molecularly proven and had had lymphoscintigraphy with quantification and were, therefore, included in this study.
Control participants
Twenty-two suitable participants were included as a comparison control group on the basis that both lower limbs were clinically and lymphoscintigraphically normal. The lymphoscintigram scans were identified from the radiology department, St George's NHS Foundation Trust.
Lymphoscintigraphy
Lower limb lymphoscintigraphy was performed according to standard local procedure. 99mTc-Nanocoll (0.2 mL, 25 MBq; GE Healthcare, Little Chalfont, Buckinghamshire, UK) was injected subcutaneously into the web space between the first and second metatarsophalangeal joints of the toes of each foot. Imaging was performed using a single head Argus Epic gamma camera (MIC Ltd., Fleet, Hampshire, UK; 128 × 128 matrix, low-energy general purpose collimator). Participants were supine for all examinations. No exercise was performed.
Images were taken at 15 minutes and 2 hours postinjection to demonstrate the lymphatic drainage pathways and uptake of the tracer into the inguinal lymph nodes (Fig. 2). All lymphoscintigrams were reviewed by clinicians with expertise in reading lymphoscintigraphy (P.S.M., S.M., K.G., and S.D.H.). Scans were reported independently by at least two clinicians who were blinded to the diagnosis/genotype.
Abnormal morphological features were identified as
reduced regional node and lymphatic collector imaging (delay), including functional aplasia (no uptake within lymphatic collectors and nodes) or functional hypoplasia (reduced activity within lymphatic collectors and nodes) at 2 hours;
i) imaged popliteal nodes, indicating lymph diversion through the subfascial (deep muscle) system; and
ii) dermal backflow (rerouting through the skin).
These outcome measures were considered the most discriminating and in line with recently published criteria. 20
Quantification of uptake of tracer within a region of interest over the ilioinguinal lymph nodes, and activity overlying the foot depot at 2 hours postinjection, were calculated. Lymphatic transport was determined by calculating the percentage of tracer, relative to amount injected, accumulating in regional lymph nodes after 2 hours. Uptake of >8% within the ilioinguinal nodes was considered normal, but uptake of <8% was considered indicative of lymphatic impairment. Thresholds were obtained from normative patient data, which are used in lymph scan assessment at St George's Hospital and elsewhere. 20 Quantification values of the tracer retention rate and tracer uptake in the lymph nodes (left and right) were compared across the three groups (MD, LDS, and controls) and tested for significance using a nonparametric Kruskal–Wallis test. To measure any difference between the affected participant groups, LDS and MD, the retention rate as well as lymph node uptake were tested for significance using the nonparametric Mann–Whitney U test. All statistical tests were performed using the SPSS v25 software package (IBM).
Results
Twelve scans from patients with pathogenic variants in FLT4 (VEGFR3), 9 (75%) female, 3 (25%) male, and 16 scans from patients with pathogenic variants in FOXC2, 8 (50%) female, 8 (50%) male, were analyzed (Table 1). The mean age of the patients at the time of their scan was 30 (±standard deviation [SD] 16.0) years for MD and 27 (±SD 14.9) years for LDS. Available control group scan data, based on 22 individuals, 13 (59%) female and 9 (41%) male, with a mean age of 43 (±SD 14.5) years (at the time of the scan), were used as a comparison group (Table 1).
Demographic Data
Number of males and females (%) within each group, mean age (±SD) per group and total data set. Mean retention rate (±SD) of contrast agent at 2 hours per leg, mean inguinal nodal uptake (±SD) at 2 hours per leg was compared across the three groups and tested for significance using the nonparametric Kruskal–Wallis test.
LDS, lymphedema-distichiasis syndrome; MD, Milroy disease; SD, standard deviation.
Lymphoscintigraphy images for MD
Eight of 12 scans for the individuals with MD clearly demonstrated minimal or no uptake of tracer into the lymphatic collectors or inguinal lymph nodes at 2 hours and a high level of tracer retention in the feet (i.e., a pattern of “functional aplasia,” interpreted as initial lymphatic vessels present but not working) (Table 2).
Lymphoscintigraphy Imaging of Typical Milroy Disease
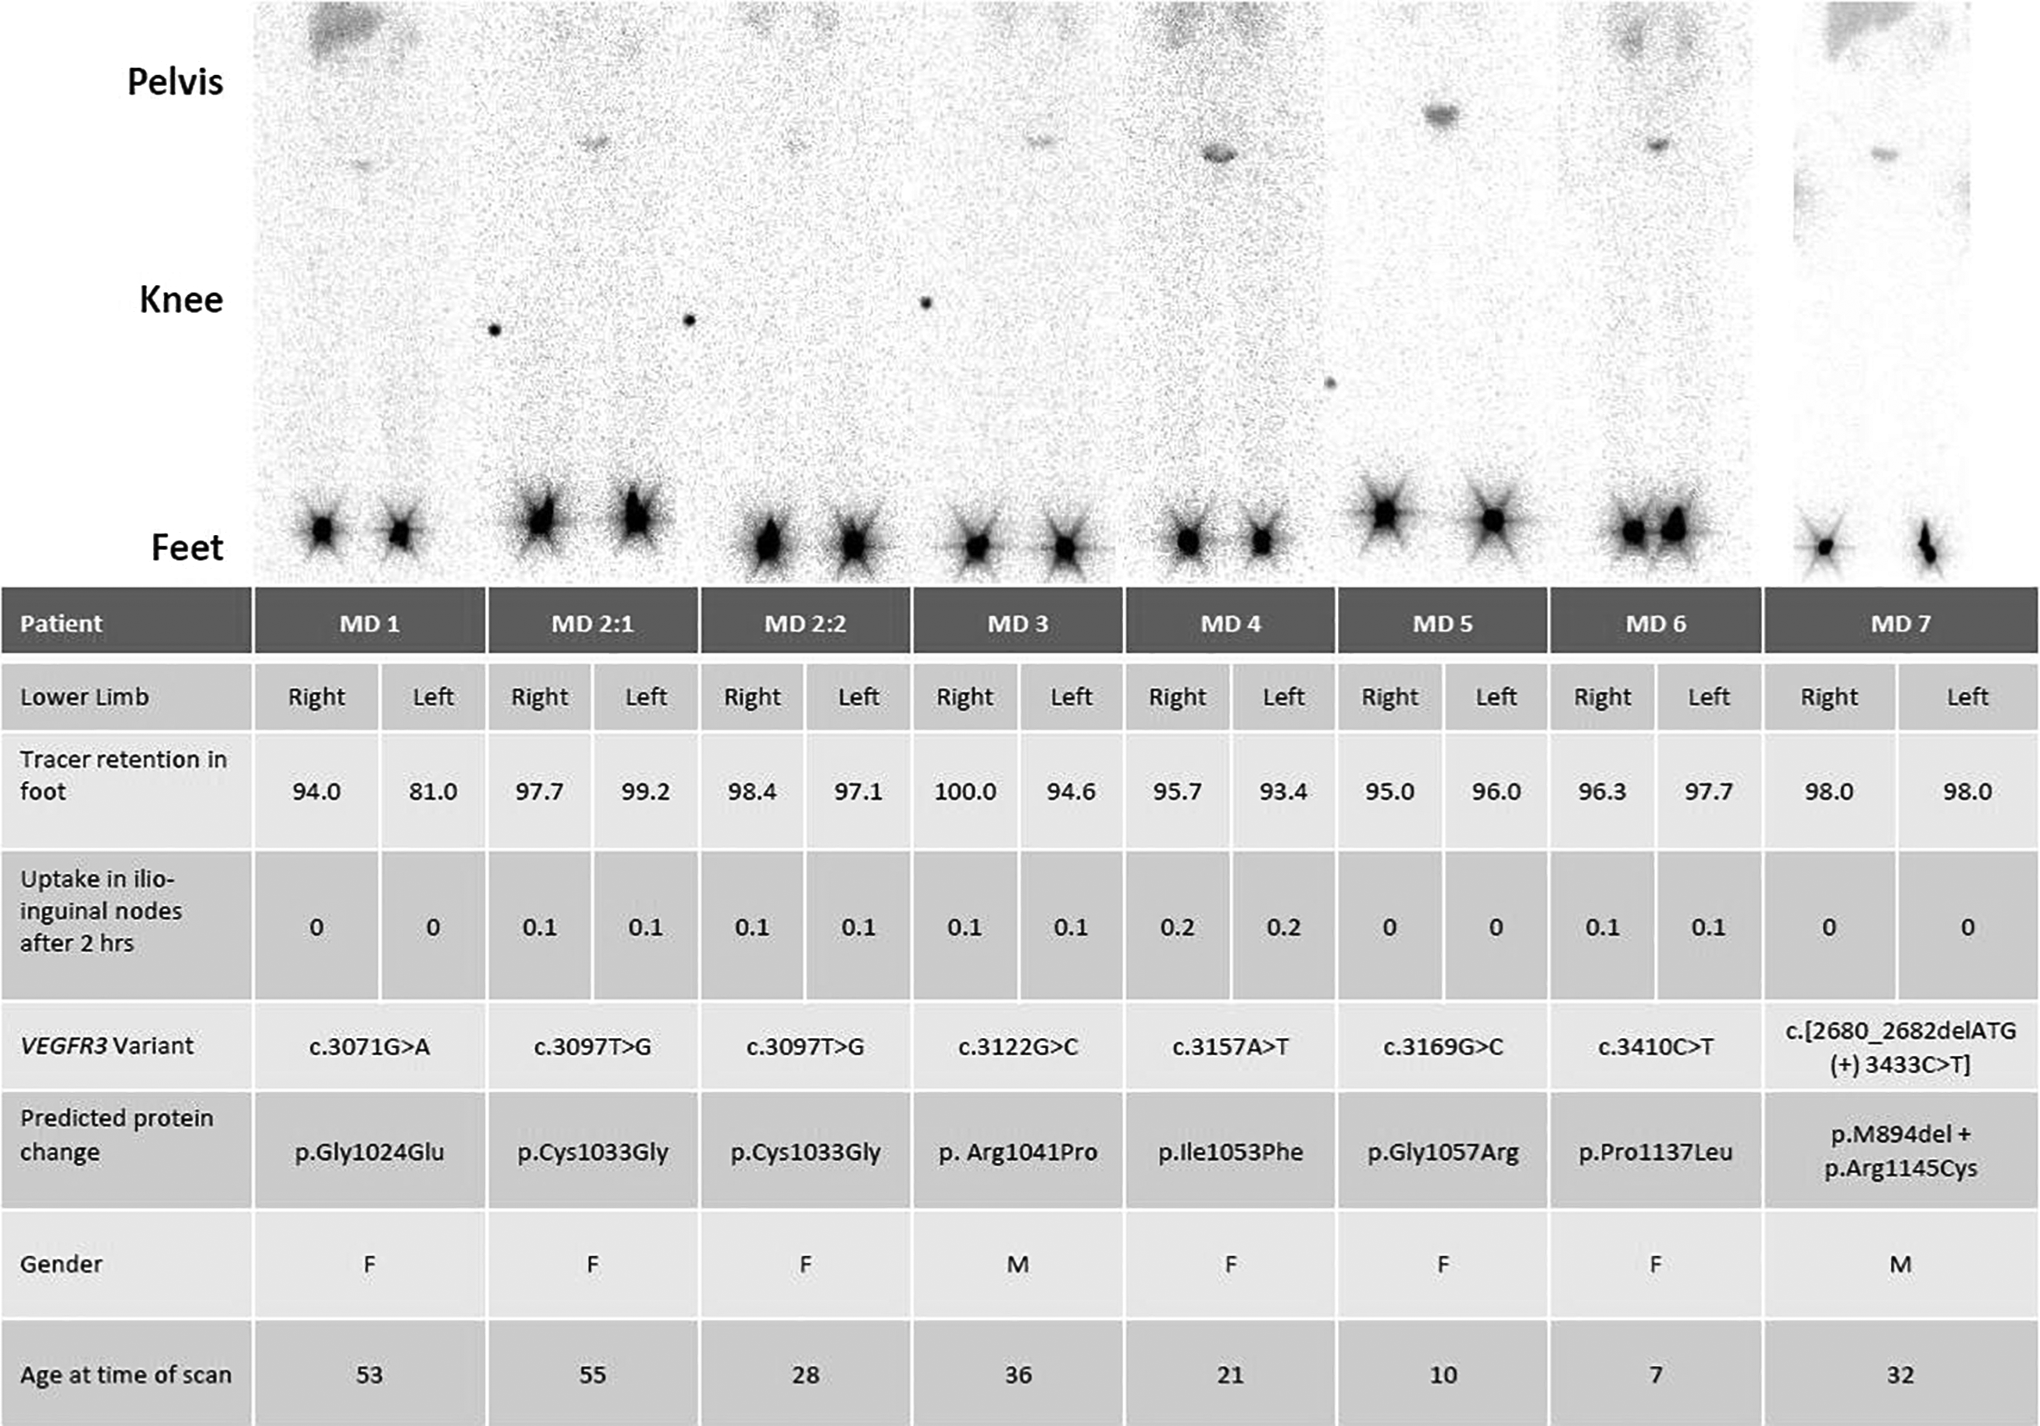
All lower limb scans are given as anterior view. Quantification figures 2 hours postinjection are given as % of tracer retention in right and left foot and tracer uptake in the ilioinguinal nodes. Genetic variant and predicted protein change are also shown. Patients MD2:1 and MD2:2 are related. The black dot in MD2:1, MD2:2, MD3, and MD5 is the orientation marker.
F, female; M, male.
Four of the lymphoscintigrams were atypical (Table 3). Two of the scans (MD8 and MD9) demonstrated unilateral abnormalities. In both, the right lower limb was characteristic of MD with functional aplasia, but in MD8 there was normal lymphatic drainage in the left lower limb with clearly visualized inguinal lymph nodes. MD9 showed some dermal backflow of tracer around the left ankle. In MD10, the retention and uptake figures are indicative of MD, but the scan is atypical as a tortuous appearance of the lymphatic channels is observed with bilateral dermal backflow, suggestive of superficial rerouting of tracer. A faint popliteal lymph node was seen in the calf area, suggesting a degree of rerouting of tracer through the deep lymphatic system. MD11 showed a level of uptake, which is unusual for MD. In addition, popliteal lymph nodes were seen in the calf and thigh area of the right leg.
Lymphoscintigraphy Imaging of Atypical Milroy Disease

All lower limb scans are given as anterior view. Quantification figures 2 hours postinjection are given as percentage of tracer retention in right and left foot and tracer uptake in the ilioinguinal nodes. Genetic variant and predicted protein change are also shown. Orientation marker in MD8 indicating the right-hand side of the scan. However, black dots seen in the right and left calf area of MD10, and right calf and thigh of MD11 are popliteal nodes.
Lymphoscintigraphy images for LDS
The lymphoscintigrams for the individuals with LDS showed a very different picture from those of MD and from normal. Twelve of the 16 lymphoscintigrams demonstrated very similar features that were considered to be characteristic of LDS (Table 4), namely, widened and tortuous lymphatic channels with an accumulation of tracer activity in the skin and subcutis of the distal portion of the lower limbs creating an outline of the lower leg (“profiling of the leg”). There often appeared to be increased uptake of tracer within the inguinal lymph nodes, which appeared increased in number, and the deeper popliteal nodes were clearly visualized (Table 4; e.g., knee area of LDS17 and LDS20:1).
Lymphoscintigraphy Imaging of Typical Lymphedema-Distichiasis Syndrome
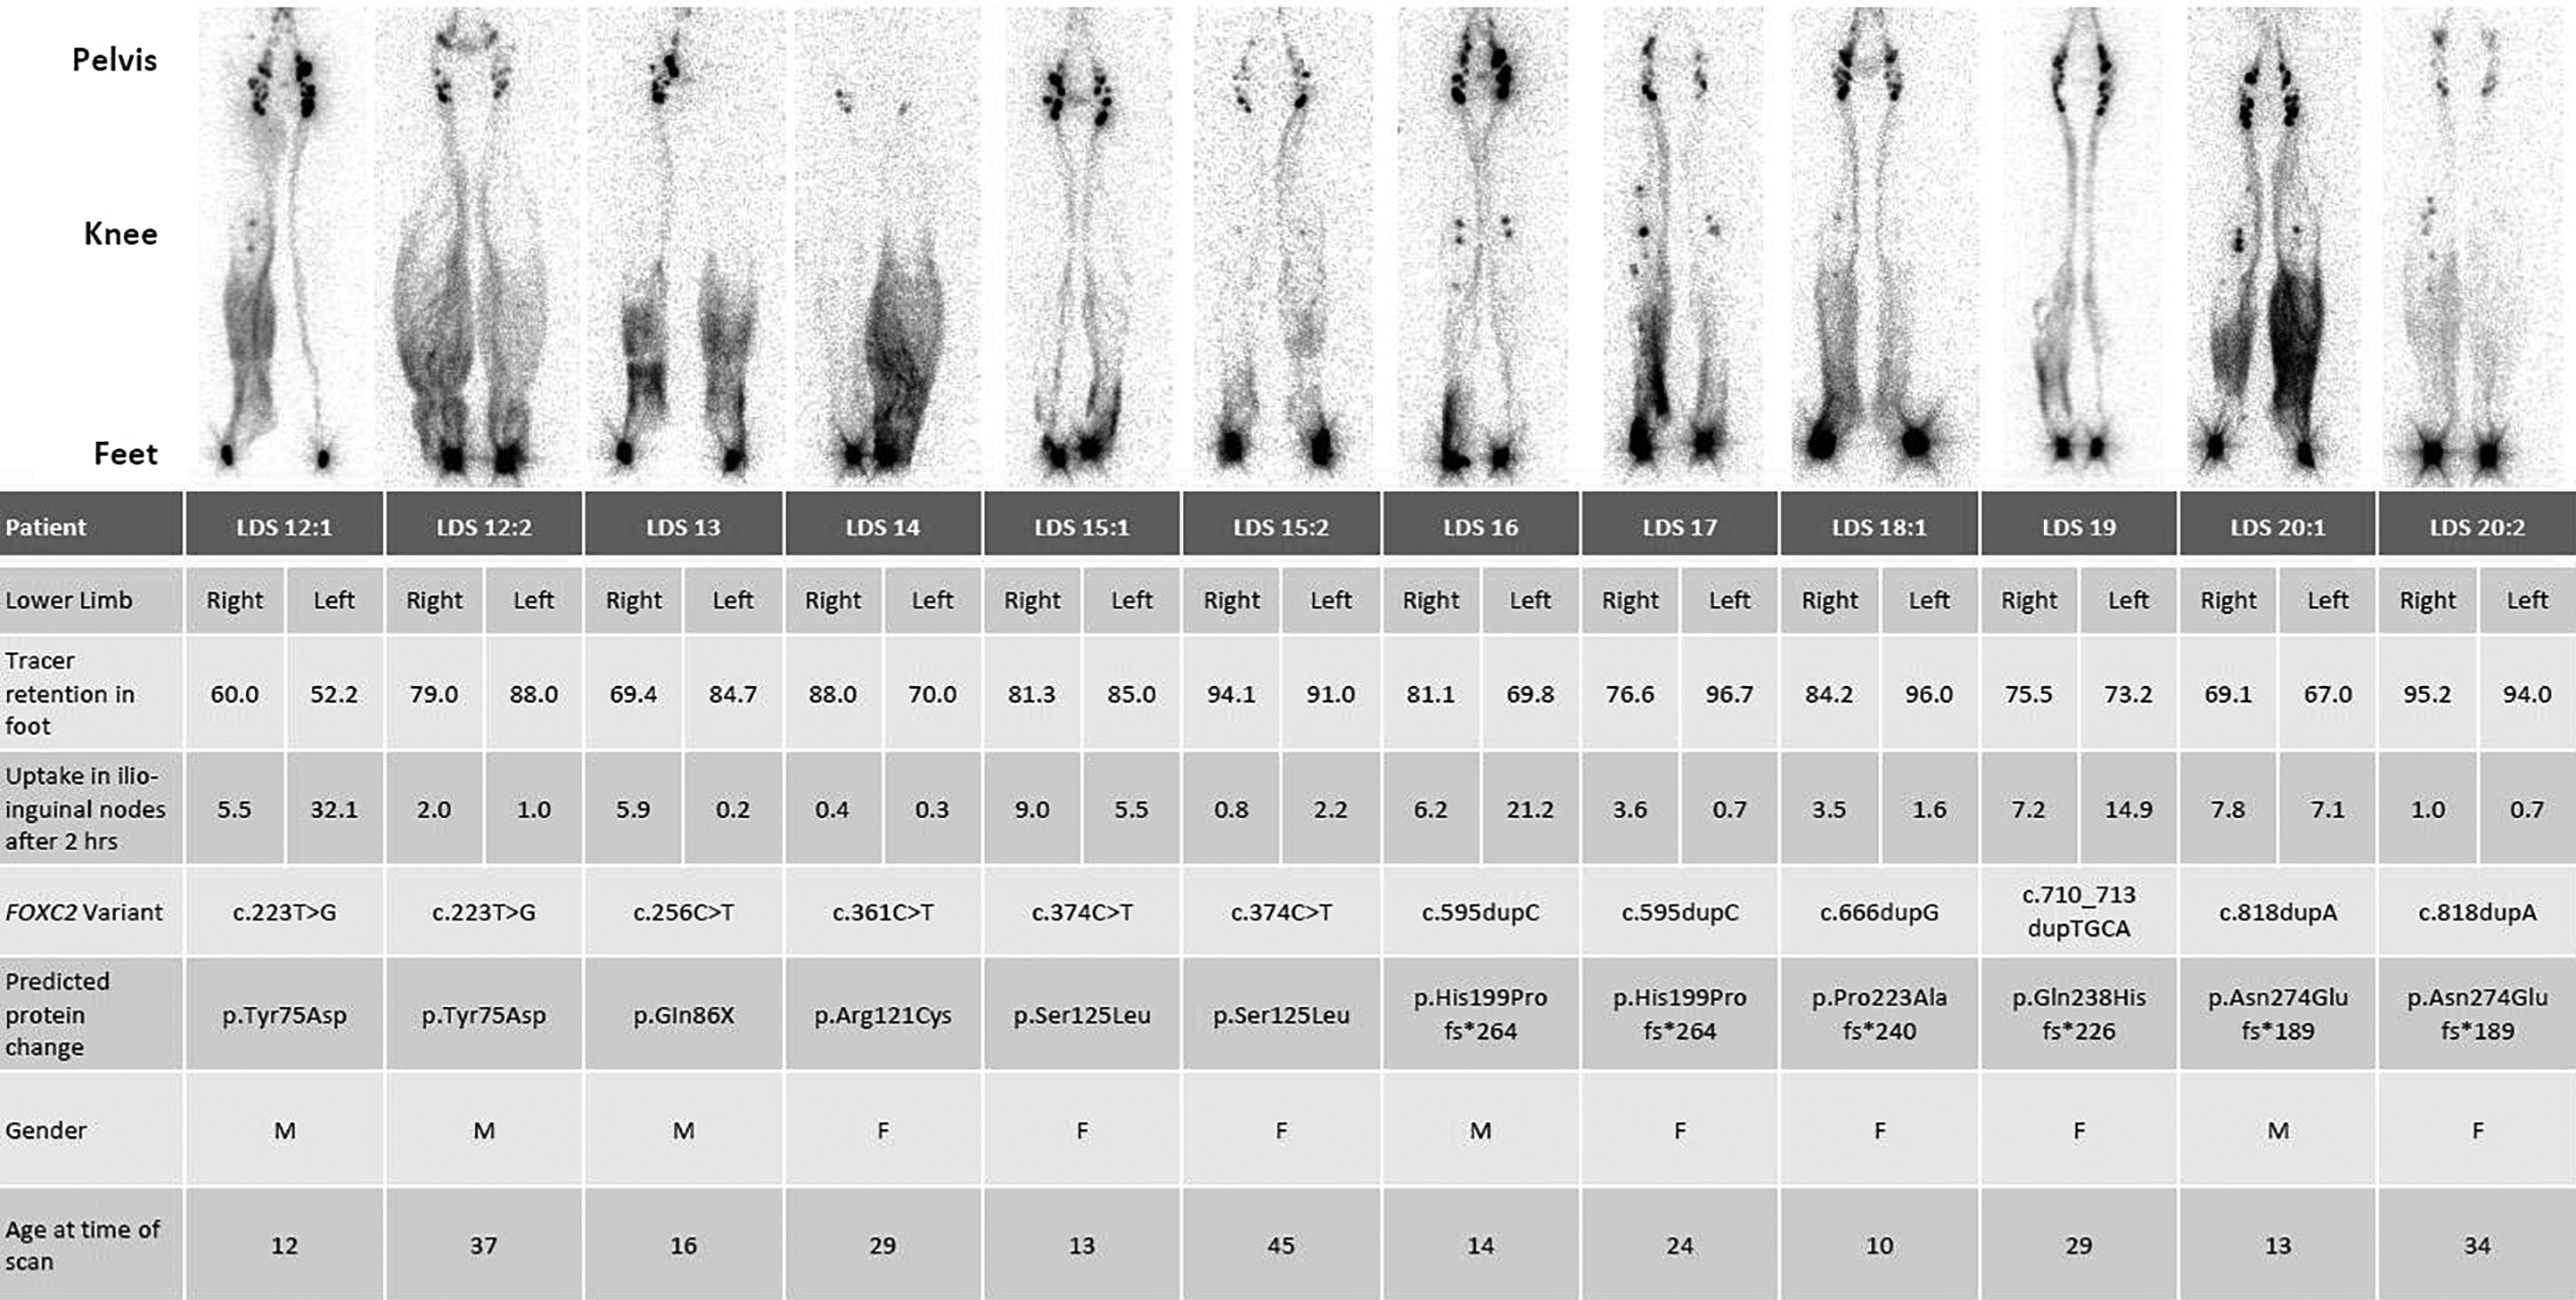
All lower limb scans are given as anterior view. Quantification figures 2 hours postinjection are given as percentage of tracer retention in right and left foot and tracer uptake in the ilioinguinal nodes. Genetic variant and predicted protein change are also shown. Patients LDS12:1 and LDS12:2 are related, so are LDS15:1 and LDS15:2, and LDS20:1 and LDS20:2 LDS18:1 is related to LDS18:2 in Table 5.
Lymphoscintigraphy Imaging of Atypical Lymphedema-Distichiasis Syndrome
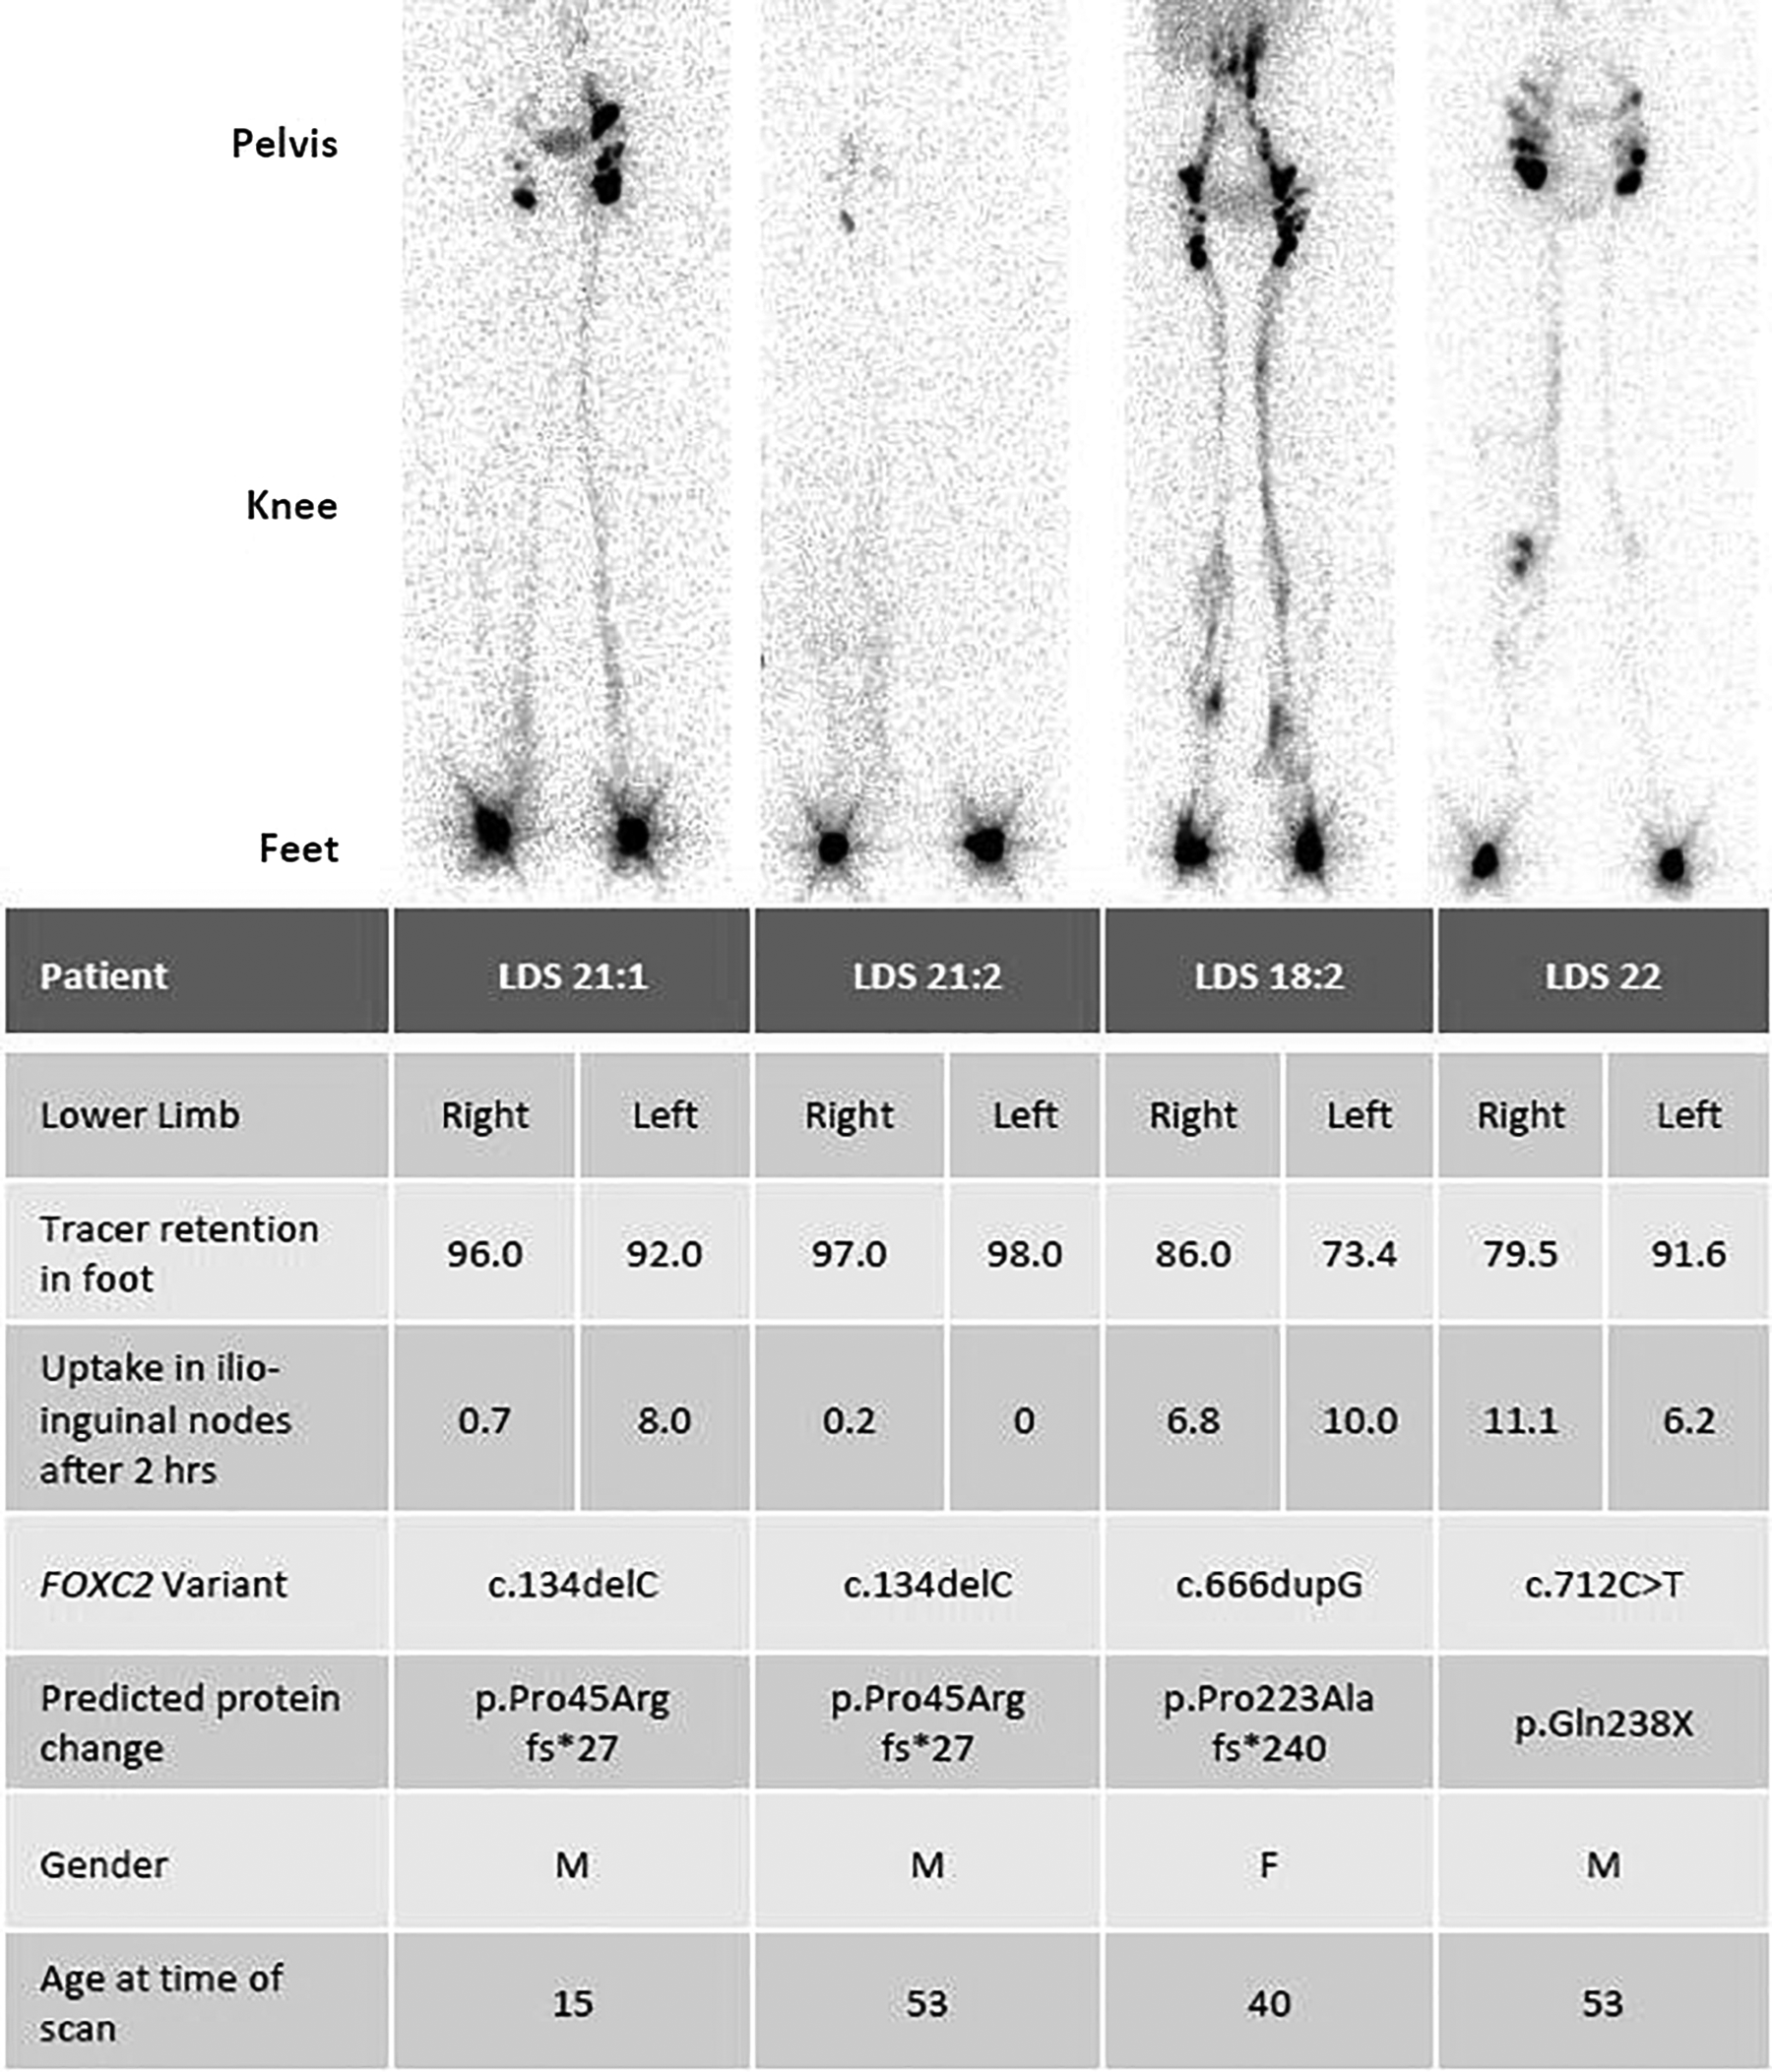
All lower limb scans are given as anterior view. Quantification figures 2 hours postinjection are given as percentage of tracer retention in right and left foot and tracer uptake in the ilioinguinal nodes. Genetic variant and predicted protein change are also shown. Patients LDS21:1 and LDS21:2 are related. Patient LDS18:2 is related to patient LDS18:1 in Table 4.
Four of the lymphoscintigrams were less characteristic of LDS (Table 5). LDS21:1 demonstrated unilateral changes; uptake on the left was within the normal range. On the right, the changes were consistent with functional hypoplasia, with no profiling of the limb. The scan for LDS21:2 was more comparable with the functional aplasia seen in the MD cases with high retention values in the feet and very little uptake of tracer in the legs or groins at 2 hours. There was a subtle profiling, indicating dermal backflow, in the right limb. LDS18:2 showed there was evidence of dermal backflow above the left ankle but insufficient to create profiling of the leg. LDS22 showed scrotal dermal backflow, probably indicating reflux of tracer, in addition to popliteal node uptake on the right and dermal backflow/rerouting in the thighs and legs.
Lymph transport quantification
Normal controls: Lymphoscintigraphy had previously been performed on unaffected individuals for comparison (for another study). Twenty-two participants had normal imaging and quantification of both lower limbs (44 limbs). The mean retention rate at the injection site of both legs was nearly identical with a mean of 71.1% in the right leg and 70.7% in the left leg (Table 1). Similarly, the mean nodal uptake of the right leg and left leg was reported as 17.3% and 16.3%, respectively.
MD: Of the 24 limbs scanned in patients with MD, 18 had >93% of tracer retained at the site of the injection at 2 hours (Tables 2 and 3), with a mean value of 95.6% in right leg and 88.5% in left leg (Table 1). Eighteen of the 24 limbs showed nodal uptake figures of <0.2% in the groin at 2 hours (Tables 2 and 3) with a median value of 0.1% uptake for both legs (Tables 2 and 3). Statistical analysis using the nonparametric Kruskal–Wallis test for the quantification figures (foot retention and nodal uptake) for all MD cases (including atypical scans in Table 3) was significantly different from those of the LDS and control groups (Table 1).
LDS: In terms of quantification, the LDS scans showed more variability than those for MD. The injection depot site retention figures ranged from 52% (which is considered normal) to 98% (which indicates impaired uptake) (Tables 4 and 5) with a mean of 82.0% retention in the right leg and 82.6% in the left leg (Table 1). Of the 32 limbs scanned, 13 limbs showed a normal uptake from the depot in the foot (i.e., retention figures of <80%). The quantification figures for uptake of tracer in the groin area after 2 hours was also variable and ranged from 0% (which indicates impaired uptake) to 32.1% (which is considered high and might suggest coexistent venous disease) with mean values of 4.5% and 7.0% in the right and left legs, respectively (Table 1).
The difference between the injection depot site retention (in percentage) and the lymph node tracer uptake (in percentage) in the right and left leg at 2 hours in MD, LDS, and controls is evident (Fig. 3).
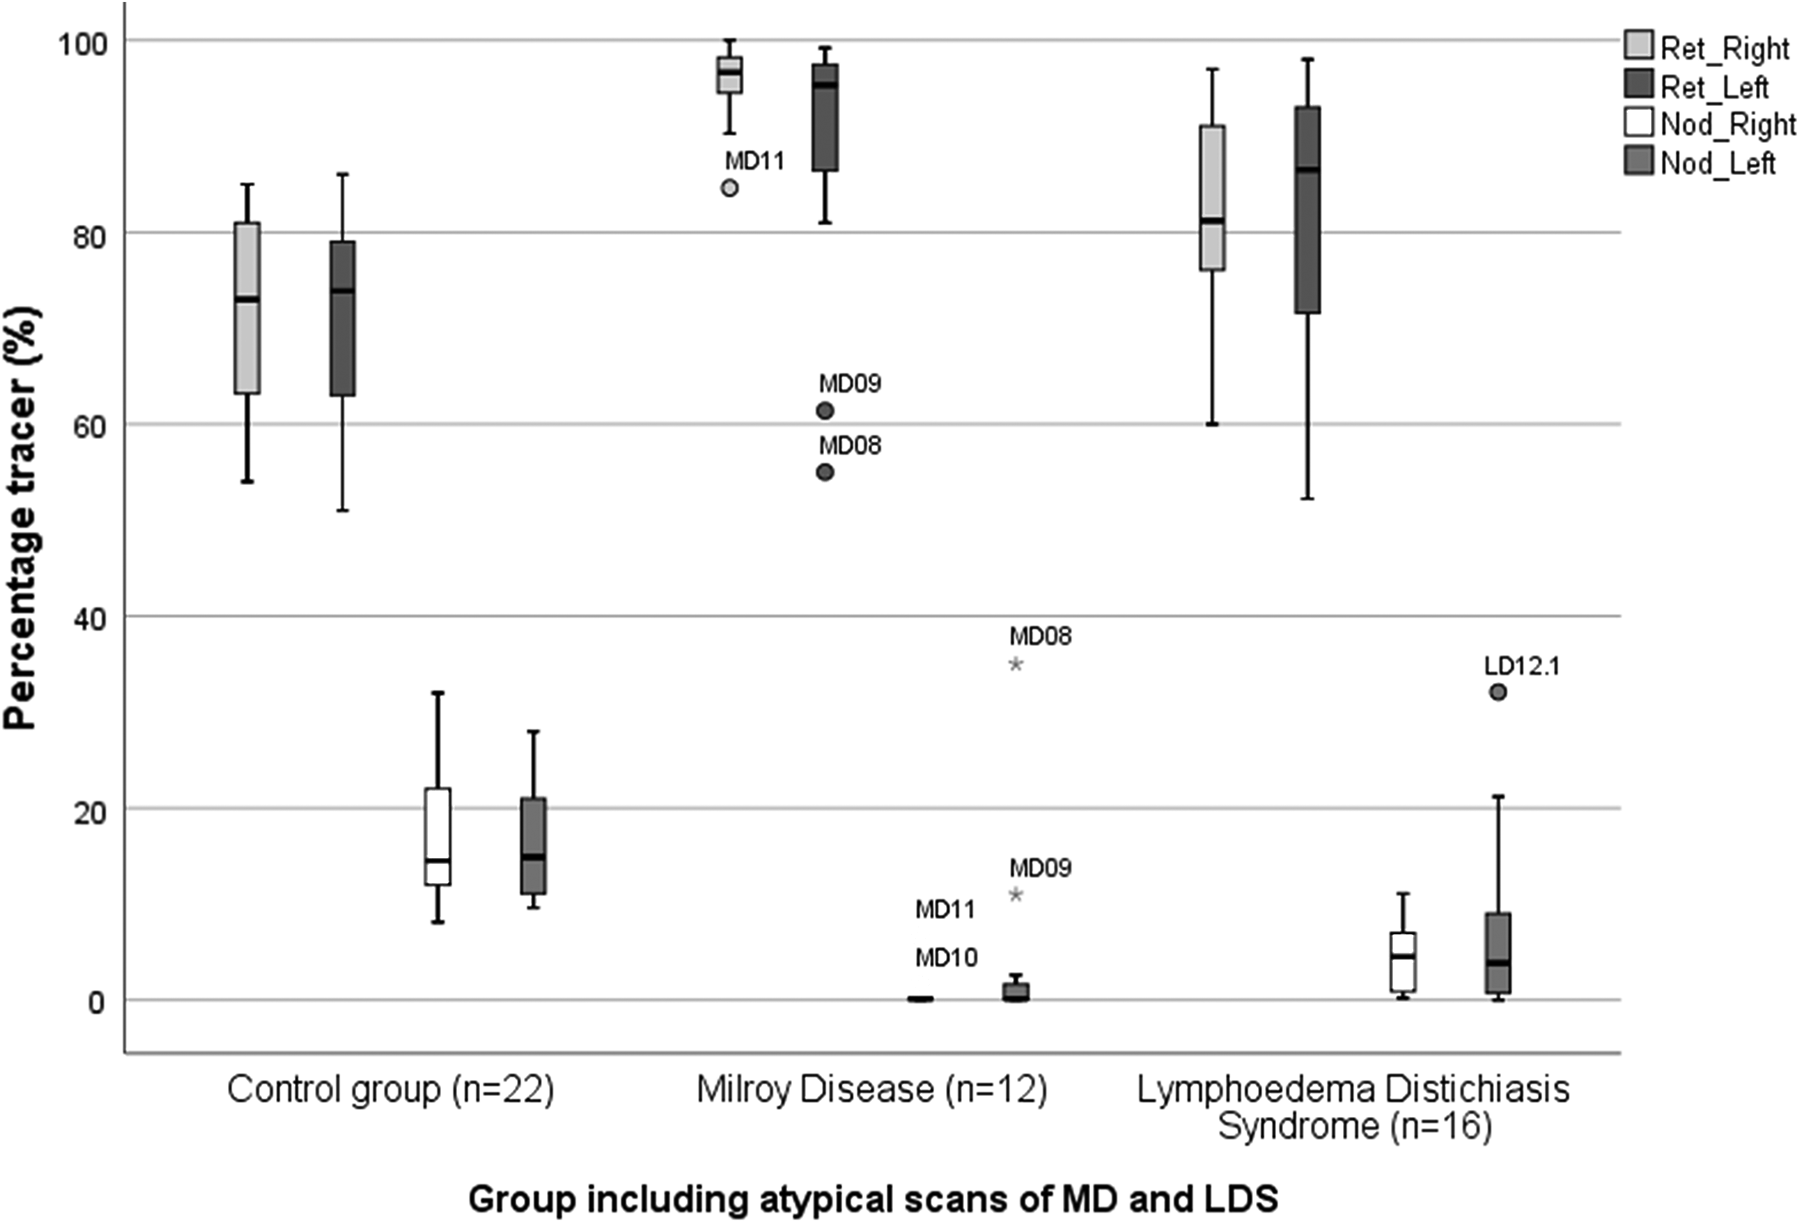
Boxplot showing the percentage retention rate and the lymph node uptake in the right and left leg at 2 hours of the control group, MD and LDS. Outliers are identified by patient ID number. Ret_Right, retention rate right leg; Ret_Left, retention rate left leg; Nod_Right, lymph node uptake right leg; Nod_Left, lymph node uptake left leg.
Additional tests for significance specifically between MD and LDS were performed, including all scans (Supplementary Table S1) and including only the typical scans of both groups (Supplementary Table S2) using the nonparametric Mann–Whitney U test. This confirmed a statistically significant difference of the mean retention at depot of the right leg and mean inguinal nodal uptake of the right leg between all patients with MD and LDS; the left leg also showed a difference although it did not reach statistical significance. A statistical difference between the two groups was reached for both lower limbs if only the “typical” scans were considered (Supplementary Table S2).
Discussion
MD and LDS are two of the most frequent genetic causes of primary lymphedema. There are often marked differences between MD, LDS, and other types of primary lymphedema in their clinical presentation. One of the problems with making a clinical diagnosis only is that many clinicians will diagnose every type of primary lymphedema as MD. The identification of causal genes for primary lymphedema allows for genetic testing and a specific diagnosis according to genotype can be made. Genetic testing may not always be available and, if tested, variants of unknown significance in these genes may be identified making molecular diagnosis difficult. The clinical assessment of the patient is essential for making an accurate diagnosis, targeting the genetic test and interpretation of the result. This study investigated whether lymphoscintigraphy in primary lymphedema can provide characteristic features that are diagnostically specific and, therefore, helpful in phenotyping and genotyping.
In a normal lymphoscintigram using a bipedal depot injection (Fig. 2) the radioactive isotope is taken up symmetrically from the feet, and the main lymphatic tracts and inguinal lymph nodes are clearly visualized 2 hours after injection. MD typically demonstrated a “functional aplasia” whereby tracer did not appear to be absorbed by initial lymphatics and consequently little tracer drainage was seen in the legs with little or no uptake (and, therefore, no visualization) in ilioinguinal lymph glands and a high level of retention at the depot at 2 hours postinjection. Given that previous studies in humans have revealed the histological presence of dermal initial lymphatic vessels, 6 the interpretation is that the lymph vessels, although present, are not working, hence the term “functional aplasia.” The analysis of tracer retention at the injection depot and lymph node uptake were found to be useful in supporting the image findings with statistically significant differences between MD, LDS, and controls. MD demonstrated a high injection site retention of tracer and no, or little, drainage to, or accumulation within, the ilioinguinal nodes.
In contrast, in LDS, the lymph scan images were clearly different and demonstrated what was interpreted as collector vessel reflux. This was because typical scans showed superficial rerouting of the lymph drainage, with the tracer imaged within the skin and subcutis of the legs (dermal backflow) so giving an appearance of the legs seen in profile. Furthermore, the fact that tracer accumulation within the skin was usually highest in the vicinity of the lower leg and ankle supported a mechanism of reflux. The idea of lymph reflux as the mechanism for LDS is not without precedent. Mutations in FOXC2 are known to interfere with lymphatic valve development 1 and reflux was suggested in traditional radio contrast lymphography. 21 Despite the reflux and inefficient drainage, the bulk of imaged nodes could be profound. This was interpreted as indicating the hyperplasia of ilioinguinal nodes as seen on traditional lymphography. 21 There could be some retention of the tracer at the injection depot and a reduction of uptake in the groin, but it was nowhere near as striking as in MD. Previous studies in mice and humans with FOXC2 mutations have demonstrated that both the lymphatics and veins have small, dysplastic, and leaky valves with abnormal recruitment of smooth muscle. 1 The finding that lymph drainage in LDS is influenced by orthostasis (effects of gravity) also support the mechanism of reflux. 12
There was some inevitable variability in the lymphoscintigraphy results for both genotypes as demonstrated in Tables 3 and 5. This is independent of the type of mutation, with intrafamilial variation. These differences are difficult to explain but may depend on other factors, for example, the age of the patient at the time of the scan, or damage after episodes of cellulitis.
This report demonstrates a significant difference in the quantification between the two conditions reflecting differing underlying mechanisms (Table 1). In MD, there is limited absorption of interstitial fluid into the initial lymphatic vessels and, in the main, very poor transport and uptake in the ilioinguinal nodes. In LDS, the lymphatic vessels are able to absorb interstitial fluid and there are measurable levels of transport of tracer to the ilioinguinal lymph glands but substantial amounts of lymphatic backflow down the leg, due to defective lymphatic valves unable to oppose the gravitational forces working against lymphatic flow. The popliteal nodes are frequently visualized. Tracer administered around the lateral foot and ankle, as given for sentinel lymph node identification, may drain through the deep route, but tracer administered into the web spaces, under normal circumstances, follows an epifascial route. Popliteal node visualization after subcutaneous foot web space injection is an important sign of abnormal lymphatic function in patients with clinical lymphedema of the lower extremities. 22 The visualization of popliteal lymph nodes on imaging, therefore, indicates that reflux also occurs into the deeper drainage systems.
In conclusion, lymphoscintigraphic imaging and quantification can be characteristic in both MD and LDS, and so be useful as an additional tool for in-depth phenotyping, leading to a more accurate diagnosis and providing insight into the underlying mechanism.
Footnotes
Acknowledgments
We extend our thanks to the patients and their families. We also thank Mehmet Sarica for his help with the formatting of images.
Author Disclosure Statement
The authors declare no conflict of interest and have no competing financial interests.
Ethical Approval
Ethical approval for this study was obtained from the South West London Research Ethics Committee (REC Ref: 05/Q0803/257).
Funding Information
No funding was received for this study.
References
Supplementary Material
Please find the following supplemental material available below.
For Open Access articles published under a Creative Commons License, all supplemental material carries the same license as the article it is associated with.
For non-Open Access articles published, all supplemental material carries a non-exclusive license, and permission requests for re-use of supplemental material or any part of supplemental material shall be sent directly to the copyright owner as specified in the copyright notice associated with the article.