
Abstract
Background:
There are many techniques of monitoring leg lymphedema during physical therapy. Taking volumetric measurements with a tape measure is among the most common clinically, and changes in volume are typically used to measure therapy efficacy. This study shows how the Kinect infrared (IR) sensor with custom algorithms can assess leg circumferences and volumes comparable with tape measurements taken by a trained therapist while exploring regional leg changes to determine uniformity of change.
Methods and Results:
Leg volumes were measured in 38 lymphedema patients using the tape measure circumference method and the Kinect IR system. Changes in circumferences in various leg regions over the course of therapy were analyzed in 23 patients. The leg circumferences (R2 = 0.9522) and volumes ( R2 = 0.9847) strongly correlated between the two methods. The Bland–Altman analysis indicated a circumference percent different bias of 1.6 (6.2%), requiring a minor correction factor between the two methods. Over the course of therapy, patients with a reduction in leg volume, defined as a change >6.5% have greater reduction most distal to the body.
Conclusion:
The Kinect IR system explored can be used clinically for leg volume measurements to monitor leg lymphedema patients over the course of their therapy. Implementing analysis of regional leg changes can better inform physical therapy to improve efficacy of treatment.
Introduction
When the human lymphatics system is unable to maintain and regulate fluid balance in the tissue space, lymphedema may develop. Lymphedema can be defined as an abnormal accumulation of protein-rich fluid built up in the superficial tissue. 1 This onset leads to physical changes in appearance and in function in the affected regions. Lower limb lymphedema may be a permanent and debilitating disease that severely impacts one's quality of life.2,3
There are various methods of clinically diagnosing and measuring lower limb lymphedema, but the most common is taking a volumetric measurement 4 or assessing signs or symptoms.5,6 A common tool used to measure leg volume is with a tape measurement taking the circumferences along the leg at evenly spaced intervals. 7 This technique is time and labor intensive. Although the “gold standard” for volumetric measurement is water displacement, the challenges regarding hygiene has limited to no use in clinics. 8 Various systems have been developed for upper extremity lymphedema using infrared (IR) technologies that require different number of sensors or rotation in scan acquisitions, which can be difficult to implement in clinics.9–15 The commercially available Perometer is available in a horizontal and vertical version; whereas the vertical model aids in the consistency of leg measurements, the frame size of 47 cm limits the size of leg lymphedema that can be measured.
Traditional assessment of lymphedema treatment outcomes has been measured by some reduction in volume, and details like circumferential changes over time have not been used. 16 Volume measurement alone is a generalization of the lower limb and does not assess the uniformity of reduction or lack thereof. Recently, a study assessed the treatment of intermittent pneumatic compression by comparing lower limb circumferences over time at five specific levels along the leg. 17 More granularity would provide more details but the five segments are a good start to understand where the volume reduction occurs.
This study aims to show how a single stationary Kinect IR sensor with a custom image-processing algorithm can be a tool implemented in a clinical setting to measure changes in response to therapy of lower limb volume of leg lymphedema patients with the requisite clinical accuracy. The system is easy to use, has a small footprint, is noninvasive, and is quicker than the traditional tools used for circumferential measurements. A larger number of circumferential measurements within a limb can be obtained without the extra time that would be involved with using standard methods such as the tape measurer. This inexpensive alternative reduces not only cost but also time and has a small physical system footprint in the clinical space.
Methods
Participants
Men and women who suffer from various stages of lymphedema and are undergoing physical therapy at BenchMark Rehab Partners, LLC, were recruited for this study. The inclusion criteria required the participant to be able to stand on their own for at least 1 minute and to possess all four limbs. Although all adults were eligible, no minors (<18 years old) were recruited for this study. Patients receiving physical therapy treatment at BenchMark were recruited for this study by the therapist at the center based on the criteria. Before participating in the study, all interested patients provided written informed consent.
Physical therapy
Lymphedema treatment is varied among each patient depending on diagnosis and treatment needs. There are a few consistent components that each patient can use for treatment: education, compression, skin care, exercise, manual therapy, and volumetric measurements. Each patient is measured at the beginning of therapy for baseline volume of affected and unaffected extremity. The involved extremity is then measured weekly to determine differences in volume and changes in size. The patient is then treated with compression bandaging of the leg from distal to proximal, to increase the effectiveness of the efficiency of veins and lymphatics for volume reduction. Patients then begin exercises that will increase muscle pump action and hypertrophy of muscles to push against the bandages. 18 Manual therapy is also applied to those to further increase lymph volume uptake. Volumetric measurements are performed only on affected leg after the first week, but if both are affected then both are measured each time. When the volume has reached a plateau or has clinically reduced to normal or near normal, the patient is then measured for appropriate compression garments.
Measurement procedures
Recruited patients were measured at each visit upon consent by a certified therapist with the tape measure (the clinic's standard method of measurement) and the Kinect IR system. This study was approved by the Institutional Review Board at the Georgia Institute of Technology (IRB H15203). Single point and longitudinal measurements were gathered at BenchMark. The patients were asked to remove socks, shoes, and pants that would obscure the leg measurements; ankle socks were permitted.
For the Kinect IR system measurements, the patient was asked to walk to the delineated spot on the ground (∼1.8 m in front of the sensor). The feet were spaced about shoulder width apart to ensure separation of the legs as given in Figure 1. When in the correct positioning, the software interface visually indicated this correct positioning by painting the cartooned version of the patient blue. In the background, there were parameters built-in to ensure that the legs were fully separated, although actual separation becomes more difficult to achieve with larger volume legs. When in an incorrect positioning, the cartooned patient in the software display would be painted red. The patient was scanned from the front (Fig. 1A), left side (Fig. 1B), back (Fig. 1C), and right side (Fig. 1D) in this body positioning for ∼30 seconds per side. Ten frames per side were used to calculate leg volumes post hoc, and the process is further described in the section “Leg volume calculations.”
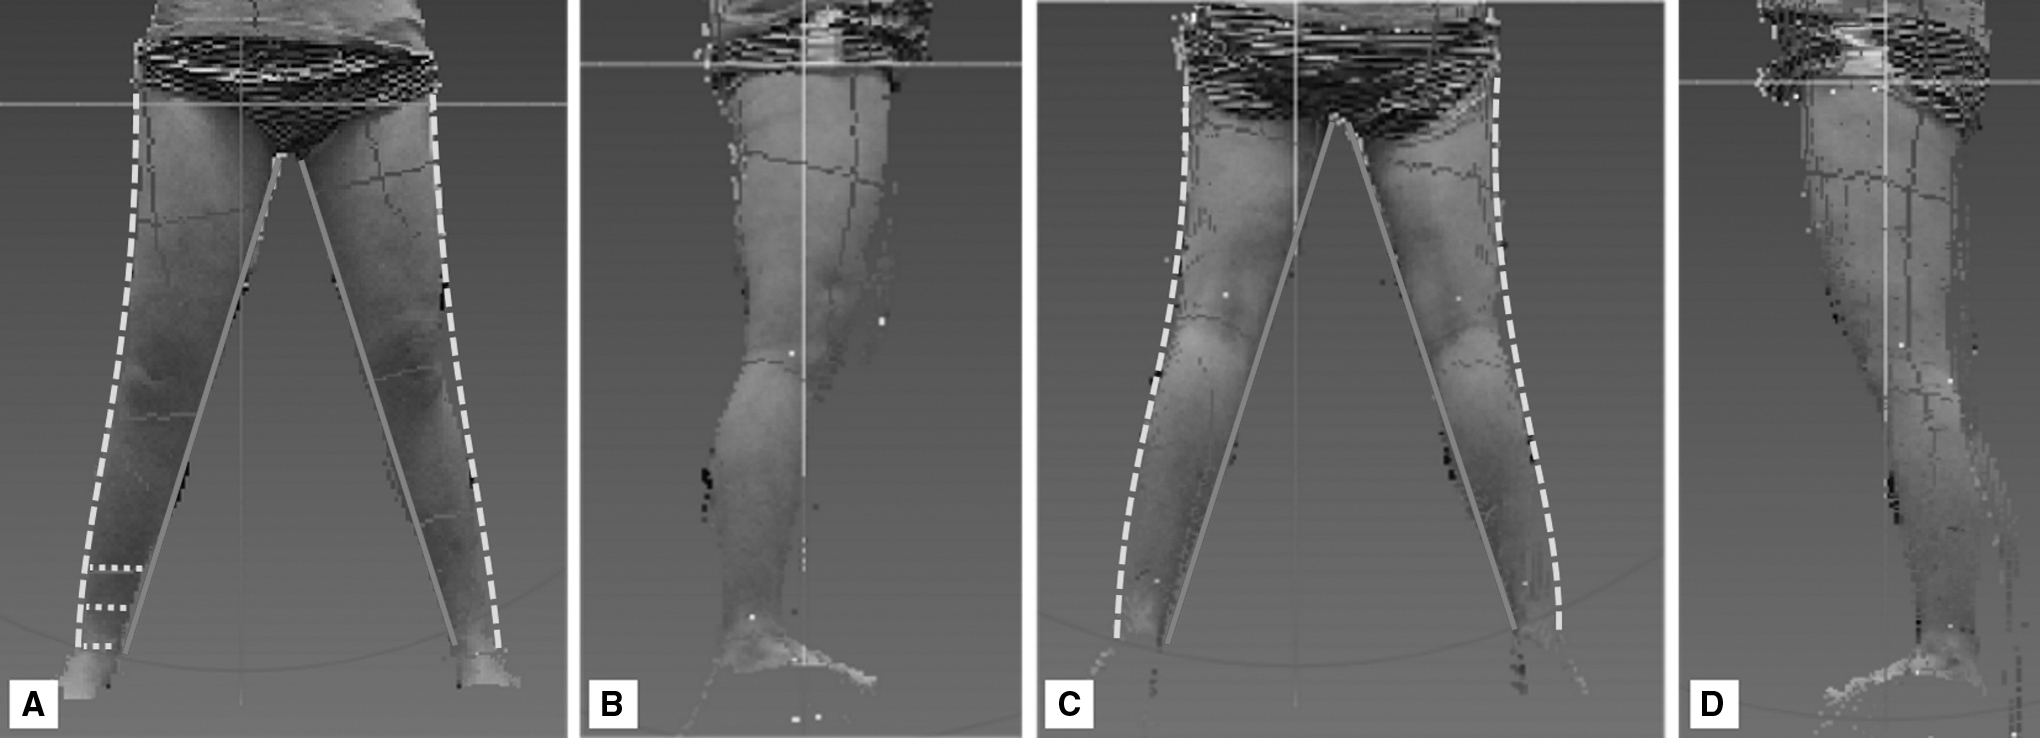
Point cloud of the legs from the following points of view
When taking measurements with a tape measure, the patient was positioned on a table, where the trained therapist could take circumference measurements every 4 cm along the leg, starting at the ankle.
Leg volume calculations
Kinect IR system
Leg volumes were calculated from the point clouds gathered by the Kinect IR system (Fig. 1A–D). To compare the volumes calculated with the Kinect IR system with the volume from the tape measure measurements, the leg of the IR scan was truncated so that the length of the leg matched the length determined by the therapist measurements. First, the right and left legs were segmented in the front and back scans with customized code. More specifically, the code identified the location where the legs anatomically meet and isolated the left leg and right leg in each of the front and back scans. If the leg length captured with the tape measurements was longer than the scan's leg length, then the code produced an error message, because it was assumed that there was not enough separation between the legs during the scan to enable complete isolation of the legs. In such an instance, the legs were manually isolated by visually determining the boundary between the two legs.
Once the right and left legs were segmented, the legs were truncated to match the leg length defined by the tape measure method. First, the legs were truncated at the ankle, set at 10 cm from the ground to match the tape measurement protocol, and then up the leg at the y-coordinate equal to the sum of 0.1 m and the tape measure leg length. The boundary points of the individual legs were identified and were smoothed using a five-point moving average filter, resulting in a point cloud of the right and the left leg from the front and back scans.
Once the left and right legs were segmented and truncated in the front and back scans, the diameters (represented by the dotted yellow lines in Fig. 1) were calculated by taking the difference of the x-coordinate of inner and outer boundaries (represented by the solid red and dashed green lines, respectively, in Fig. 1) of each leg at every 1-cm interval along the leg. The average of the diameter calculated from the front, dfront, and back, dback, scans was used to determine the major axis of the ellipse used to calculate the circumference at each axial location on the leg. The diameter from the left and right leg scans, dside, were used to determine the minor axis of the respective leg. These diameters were calculated by finding the distance between the front and back boundary along the leg. The ellipse circumference formula (Equation 1) uses the radius of the major and minor axes to calculate the circumference of the leg at each location, i, along the leg.
To compare the tape measure method, the disk method was used to calculate the volume at 4-cm intervals using the circumferences calculated previously. Subsequently, percent volume difference and volume difference were calculated based on the right and left leg volumes.
Tape measure
The leg volume was calculated from the circumference measurements taken with the tape measure, starting 10 cm up from the ground and at 4-cm intervals by a trained therapist. Circumference values were input into software by Academy of Lymphatic Studies (ACOLS) to calculate the volume, which is based on the disk method, and the resulting percent difference in volume and volume difference.
Other clinical measures
Clinical metrics used are percent volume difference and volume difference. The ACOLS software calculates these metrics based on the affected side in unilateral cases and the larger side in bilateral cases. For better comparisons with the Kinect IR system, we recalculated these metrics. Volume difference was the right leg volume subtracted by the left leg volumes, and the percent volume difference is the volume difference divided by the right leg volume multiplied by 100%.
Leg change over time
To assess how volume changed along the leg in response to routine treatment, changes in volume were tracked from one visit to the next using both modalities. We calculated the average absolute percent error of volumes, which was 6.5%, between the tape measure method and the Kinect IR system. Based on this threshold, each leg was classified as having undergone (1) no change or <6.5% change in either direction, (2) increased in volume by 6.5%, or (3) reduction in volume by 6.5% over the course of therapy. Then, the change in circumference was calculated between the initial and last therapy visit. Using the measurements taken with the Kinect, change in circumference was calculated as the difference in circumferences measured at the first and last visit, divided by the circumferences in the initial visit, and multiplied by 100%:
where x represents the position along the leg, circ i represents the circumference at the last visit and circ1 represents the circumference at the initial visit.
Statistical data analysis
Linear regression analyses were performed to compare the degree of correlation between the Kinect IR system and the tape measure for leg circumference, leg volume, percent volume difference, and volume difference. To assess the agreement of the two methods, a Bland–Altman plot was created for circumference and volume. This plot is composed of the percent difference in either circumference or volume ([tape measure − Kinect IR system]/average volume) over average circumference or volume of the two modalities, respectively. To evaluate circumferential changes along the leg, the Wilcoxon matched-pairs signed rank test with a Bonferroni correction was performed on positions with three or more samples to determine whether statistically significant changes in circumferences occurred across the patient population. For patients with a reduction in leg volume, the modified alpha was 0.0011, and for those with an increase in leg volume, the modified alpha was 0.0005. All the analyses were performed using Prism 8 for Windows (version 8.0.2; GraphPad Software).
Results
Thirty-eight patients at a range of time points of postlymphedema onset had leg lymphedema and participated in the study (Table 1). The patients were composed of 12 men and 26 women. Of the participants, 7 were unilateral cases and 31 were bilateral cases. Fifteen participants had a single visit, and 23 participants had >1 visit, averaging 3.9 visits over the duration of 25 days (3.5 weeks).
Participants (n = 38)
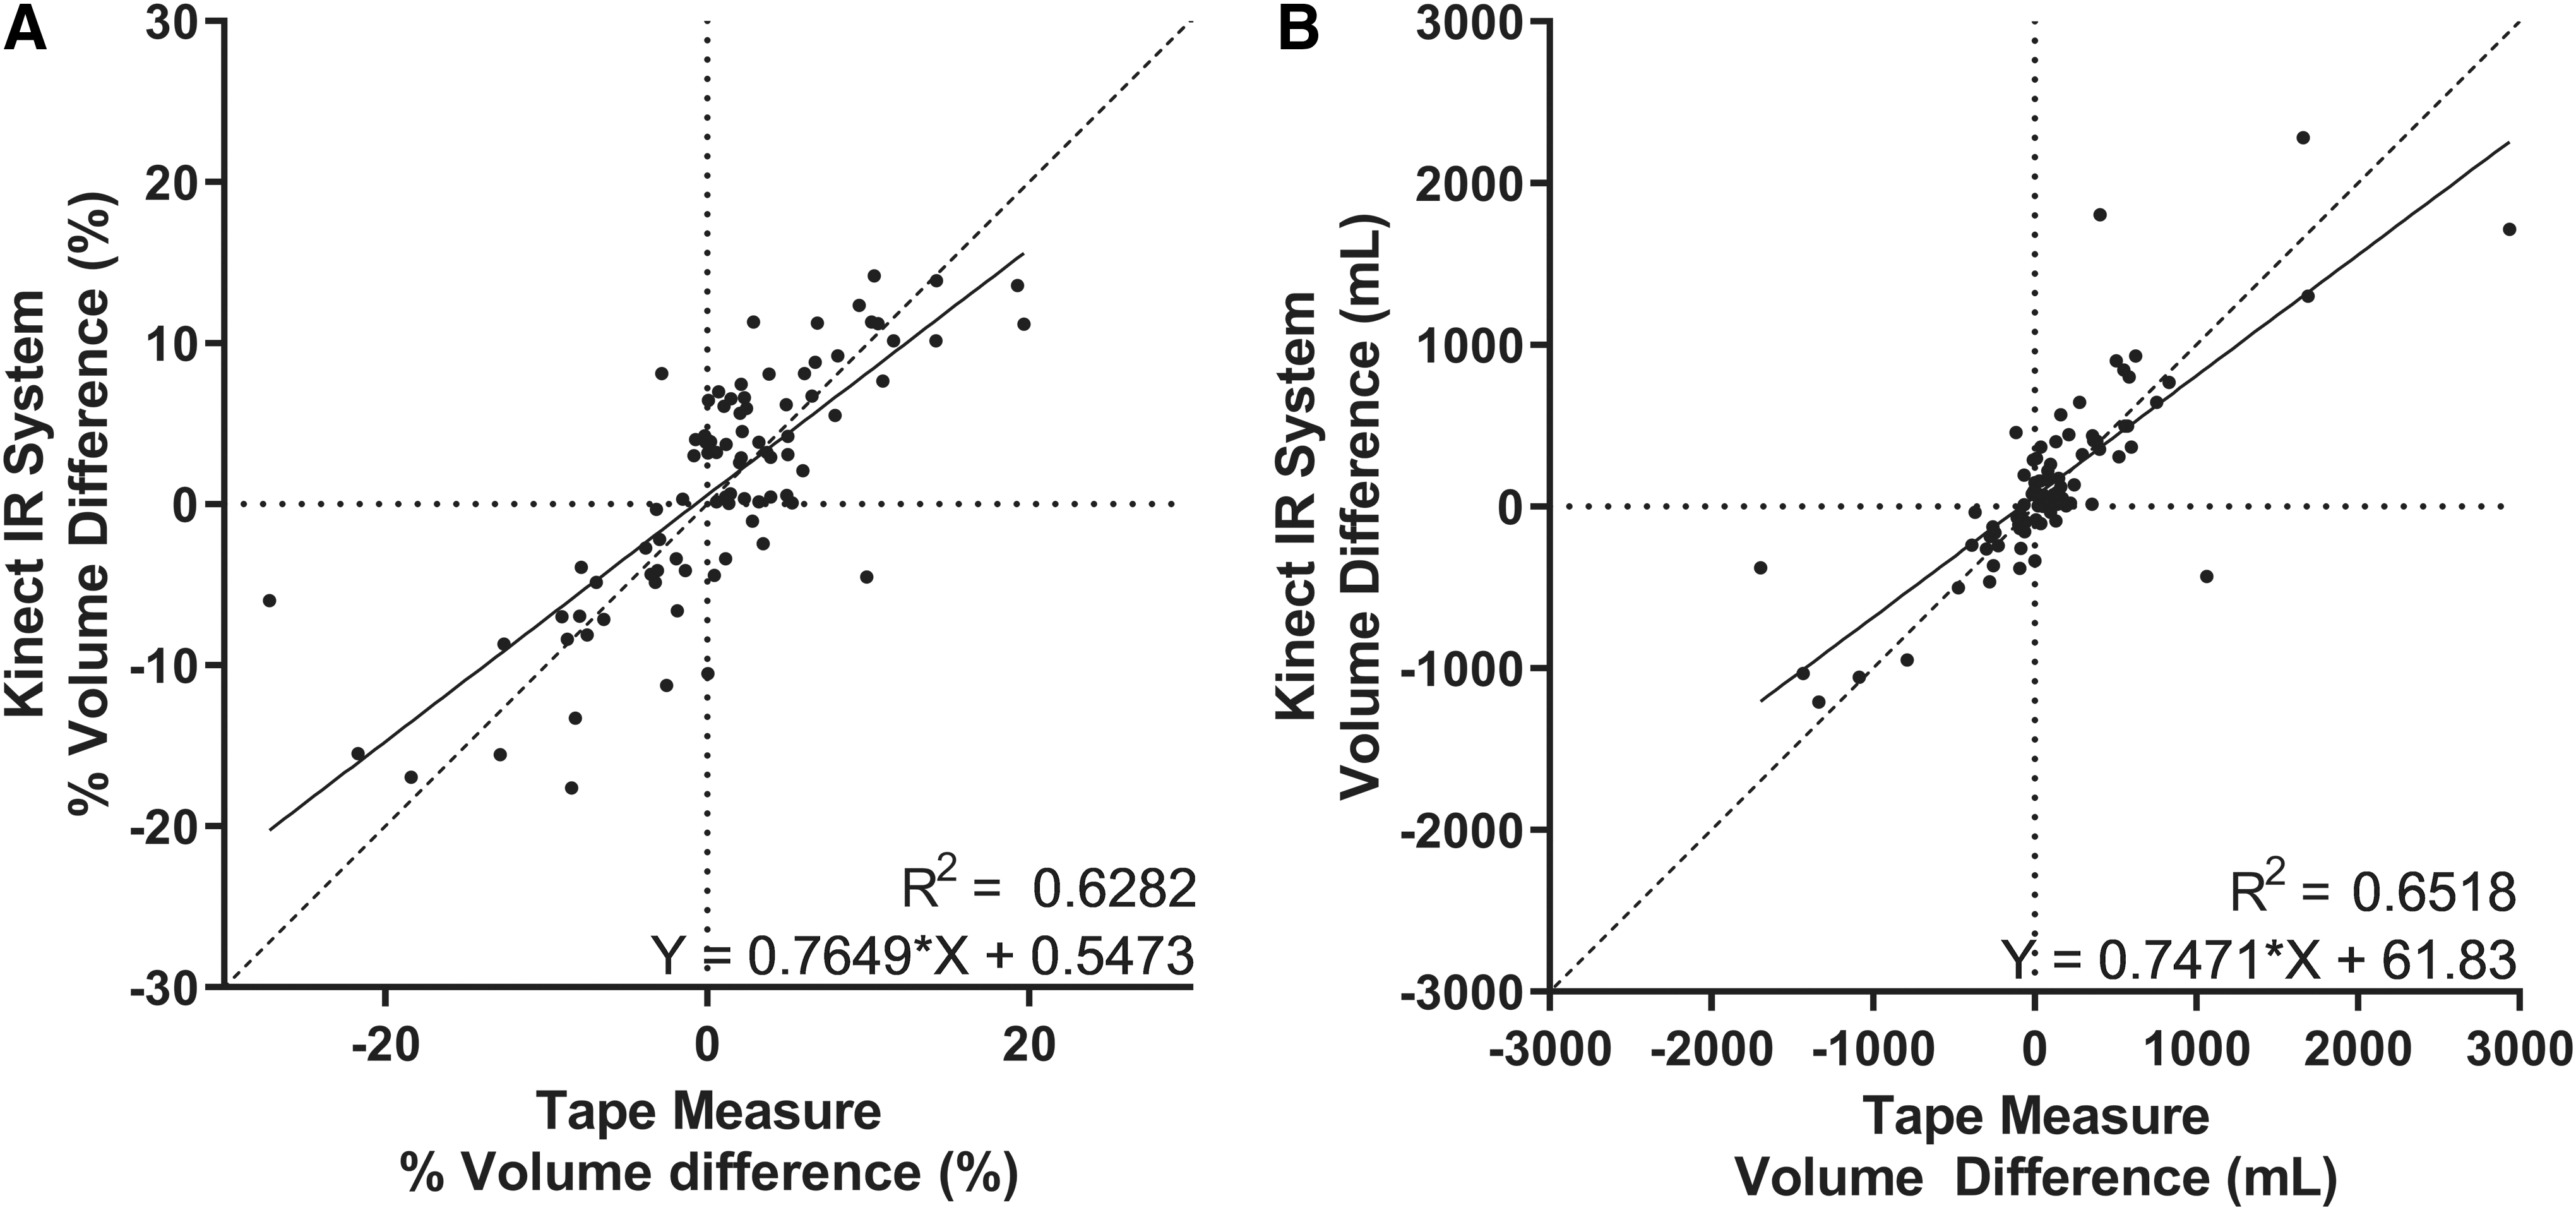
The standard tape measure circumference measurement method and the Kinect IR system were compared. The correlations of leg circumferences and volumes along the leg between the two modalities was strong with an R2 = 0.9522 (Fig. 2A) and R2 = 0.9847 (Fig. 2B), respectively. The linear regression coefficients comparing circumferences and volumes from the two modalities were 1.028 and 1.067, respectively. A R2 value of 1.000 indicated perfect correlation between the tape measure and the Kinect IR system, and a coefficient of 1 with an intercept of 0 indicated perfect agreement. The agreement analysis resulted in a circumference percent difference bias of 1.5% (6.3%) or 0.397 cm (2.601 cm) (Fig. 3A) and a volume percent difference bias of 3.6% (7.9%) or 50.39 mL (518.2 mL) (Fig. 3B) between the tape measure and Kinect IR system. A bias of 0.000 indicated perfect agreement between the two modalities. In addition, we assessed the correlation of clinically relevant metrics such as percent volume difference and volume difference. The analysis resulted in fair correlations for percent volume difference with an R2 = 0.6282 (Fig. 4A) and volume difference with an R2 = 0.6518 (Fig. 4B).

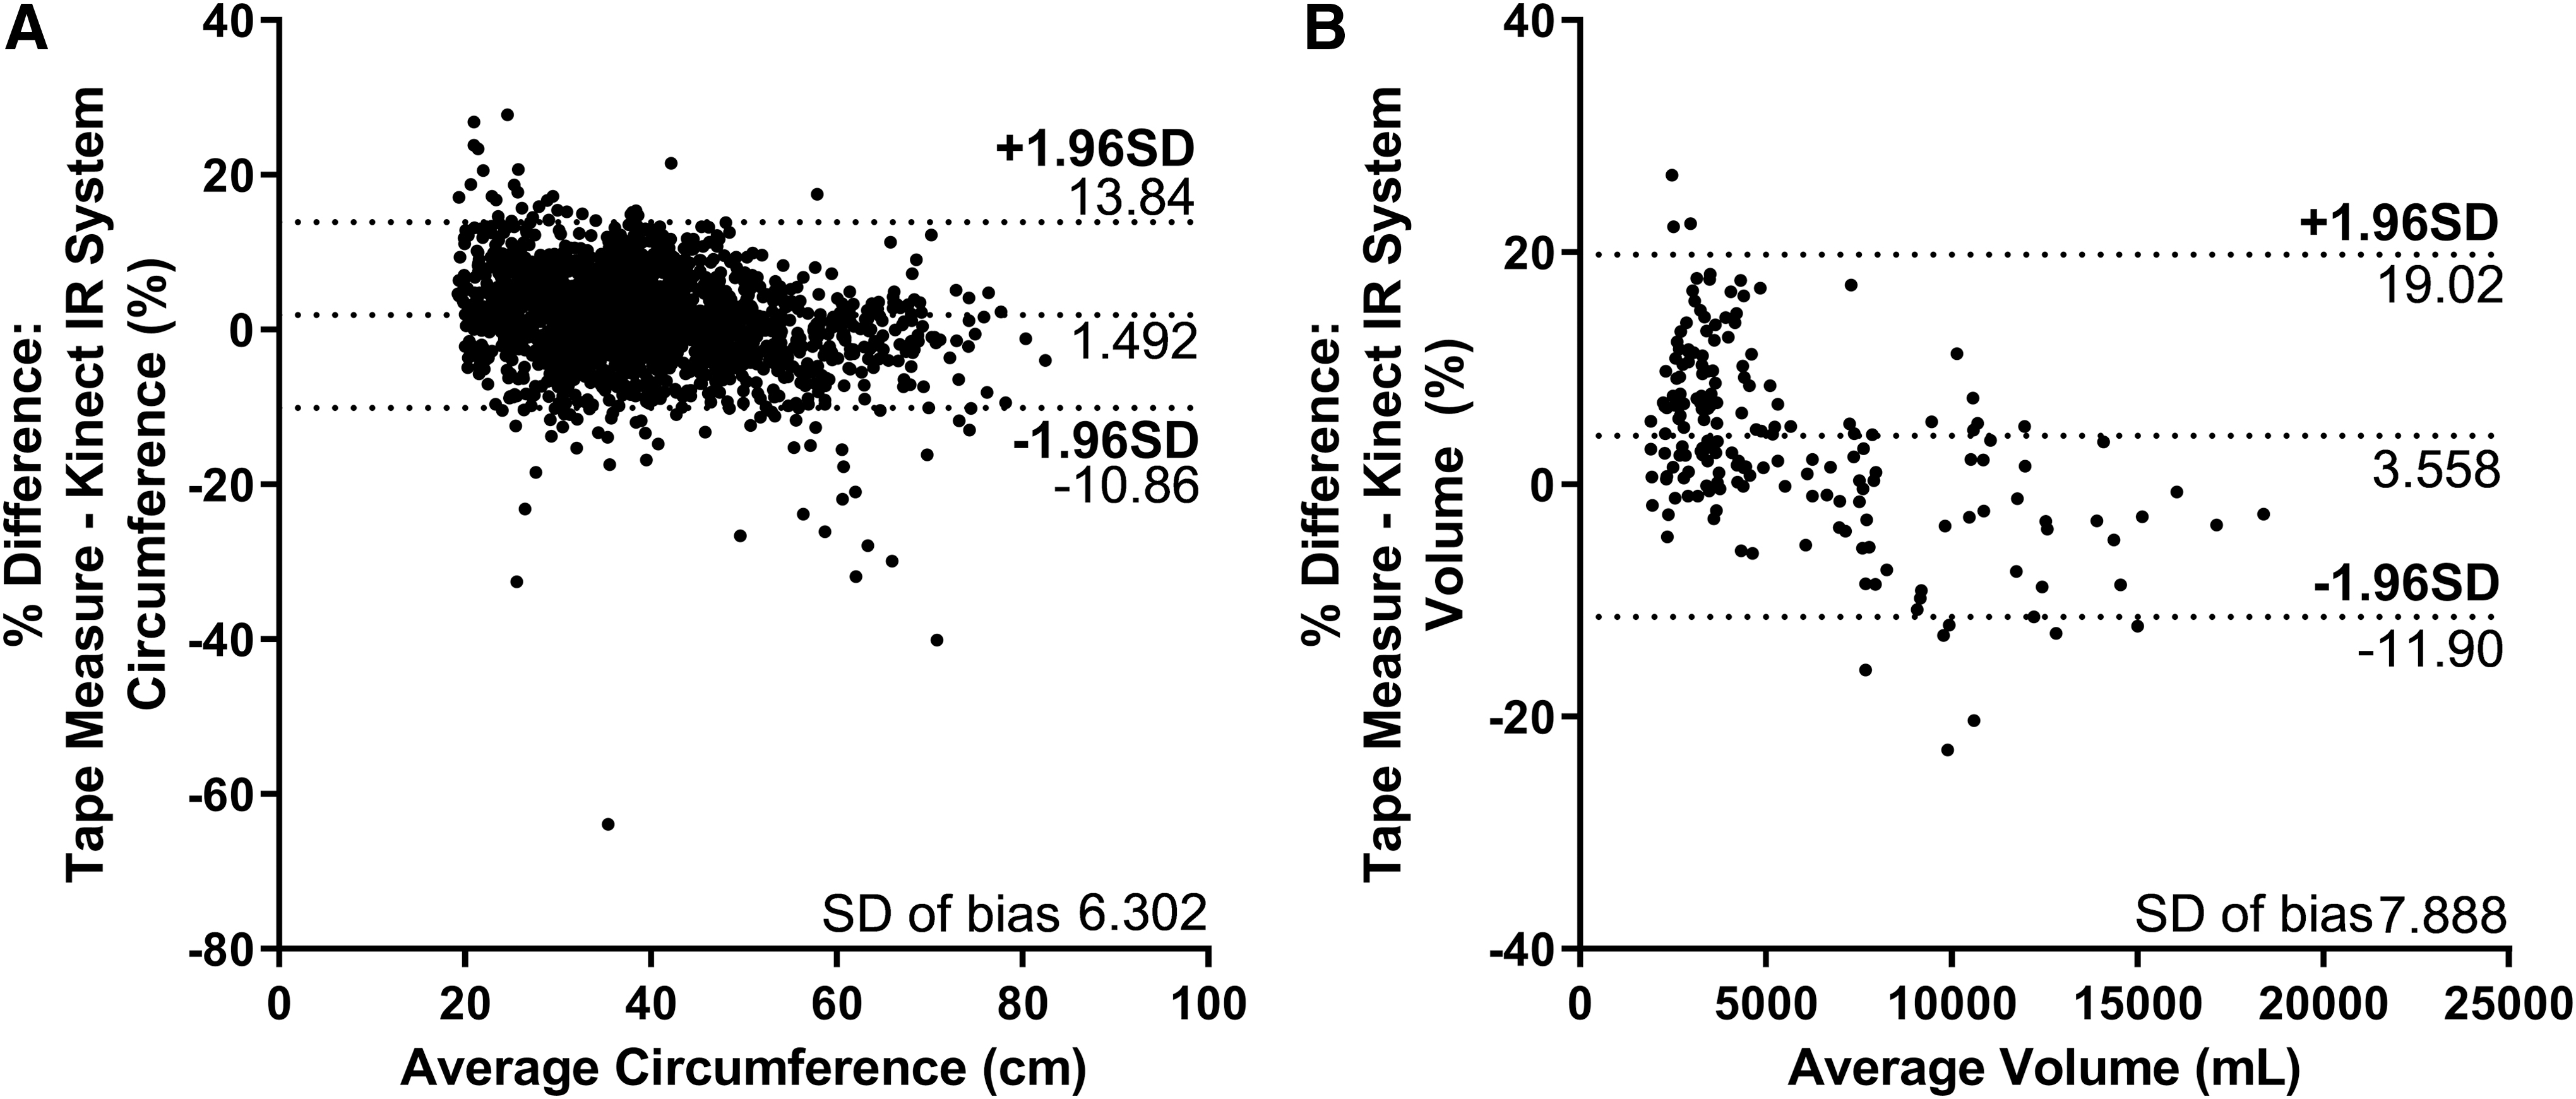
Agreement analysis using a Bland–Altman plot for
Using clinically relevant measures,
Of interest, we noted that a change in leg volume does not change uniformly along the leg over the course of therapy. There were 23 participants who had more than one measurement, meaning 46 legs were analyzed to assess change from therapy. Although 23 legs had no notable changes in volume, meaning changes <6.5%, 5 legs increased in volume and 18 legs had a reduction in volume. For legs that underwent a reduction of volume, the largest reduction in leg circumferences was distal to the body, closer to the ankles. Specifically, there was significant reduction in circumferences when comparing the changes at 4 cm from the ankle to 24 cm (p = 0.0007) and 28 cm (p = 0.0001), 8 to 32 cm (p = 0.0090), and 12 to 32 cm (p = 0.0090) up the leg (Fig. 5A). Changes in circumference >36 cm were not included in the statistical analysis. For legs that increased in total volume after therapy, the greatest changes were found at the most distal and most proximal of the leg to the body, but these regional changes were not significantly different (Fig. 5B). Changes in circumference >56 cm were not included in the statistical analysis.

Legs change volume over time based on the Kinect IR system. Percent circumference changes to the right of the line (n < 3) were not included in the statistical analysis.
Discussion
Although there are methods to track lymphedema in its progression and its response to physical therapy treatments, there is room for technological improvement to aid with clinical implementation to save time and to promote continued monitoring. Our study shows that circumference and volume strongly correlated when comparing the tape measure method and the Kinect IR system. In addition, in this study, the therapist collected all the scans after a brief training session during regular patient treatment visit, which indicates that clinical implementation is realistic and logistically possible with minimal training.
The Kinect IR system has various strengths and weaknesses. The system is quick and requires less training to operate. Although length of time for acquisition was not specifically recorded in this study, other studies have shown that tape measurements of the leg circumferences can take up to 7.5 minutes 19 ; in comparison, the Kinect IR system currently takes an estimated 4–5 minutes but was shortened with increased familiarity and could be further shortened by reducing the number of frames taken of each side. This time savings provide the therapist with time to focus on therapy as opposed to making manual measurements with the tape measurer. In addition, this study assessed whether the changes in limb volume over the course of therapy was uniformly distributed on the leg. This granularity of detail can help inform therapists of which locations within the limb are being particularly responsive to therapy and can also identify potential problem areas where fluid is not sufficiently draining. Although there are many strengths, there are a few limitations to the system. The system results in a slightly weaker correlation when the circumferences (>60 cm) and volumes (>7000 mL) are larger. This limitation is also reflected in the agreement analysis, as the differences between the two modalities are larger for limbs with larger circumferences and volumes. These data may indicate that at these larger measurements, the leg shape may deviate from the assumed cross-sectional shape by each measurement method.
Many studies have reported various ways of assessing effectiveness of treatment of lymphedema with volumetric measurements being the most common.7,16 There are multitudes of modalities to measure volume that vary on financial cost, labor intensity, hygienic risk, and length of testing. Of interest, there has been little attention on the assessment of more regional changes over the course of therapy to gain a better understanding of where changes in swelling occurred. The Kinect IR system balances its cost with the reduction in scanning time and reduced training for acquisition. It is worth noting that the Kinect for Windows sensor has been replaced with the Azure Kinect DK, which can be used in a similar manner as the original sensor. In addition, there are other comparable IR sensors that can be integrated with the software and thus the approach of applying detailed morphological analysis of 3D point clouds to determine localized volume changes in response to therapy is agnostic to the particular sensor being used. A study has shown promising volume measurements using portable IR technology among filarial patients in Sri Lanka that can be translated for lymphedema patients under therapy. 19 In fact, this new scanner technology (LymphaTech, Inc., Atlanta, GA) has replaced the use of the Kinect scanner in the clinical implementation of limb volume tracking at BenchMark Rehab Partners in Chattanooga, where the data presented here were collected.
Assessing regional circumferential changes along the legs under treatment for lymphedema in this study shows that the resulting volume reductions are not uniform along the leg. Although volume has been a good indicator of efficacy of the treatment, this approach does not detail whether reduction occurs uniformly along the leg or in specific regions. Therefore, analyzing specific regions provides more granular information that can inform future treatments. The Kinect IR system would be more advantageous for these measurements, because acquiring tape measure circumferences would require more clinical time, which is already limited. Our results showed that when analyzing regional changes over the course of therapy for lymphedema, there is significant reduction of leg volume at regions more distal to the body. It would be interesting to test in future studies if this lack of significant change at the proximal limb was impacted by deviations from the assumed cross-sectional area. Legs that underwent an increase in volume over time had no significant regional differences in volume change, but because this increase was a rare event in our study, the sample size of this group was very small and likely underpowered. While assessing changes in this small set of patients, volume increases seemed to occur at the most proximal and distal regions of the leg, which correlates to where the therapeutic compression garment ends. In addition, fluid buildup in the leg despite therapy could be an indication of lymph blockage more downstream to the leg. In addition to informing therapists of where the leg is responding to therapy, this implementation could expedite the overall duration of therapy for volume reduction, and future studies could investigate its potential.
Ethical considerations
This study was reviewed and approved by the Georgia Institute of Technology Institutional Review Board (GT IRB) under protocol #H15203.
Footnotes
Acknowledgment
Special thanks to the staff at BenchMark Rehab Partners, LLC for their time and help throughout the study. The authors thank Yajun Mei for his statistical advisement through the NIH Clinical and Translational Science Award (CTSA).
Author Disclosure Statement
I.M.L. and J.J. had no competing financial interests. M.J.W. and N.F. own equity in LymphaTech, Inc. and may benefit financially from the technology. J.B.D. is affiliated with LymphaTech, Inc. Georgia Tech has licensed technology to LymphaTech, Inc. that is related to this study and that is covered by patent applications for which J.B.D. is an inventor. J.B.D. owns equity in LymphaTech, Inc. and serves as a scientific advisor. In addition, J.B.D. is eligible to receive royalties under the license agreement for LymphaTech, Inc.
Funding Information
The study was funded by the Georgia Research Alliance. IML was supported by the National Science Foundation Graduate Research Fellowship Program No. DGE-1650044.