
Abstract
Background:
Bioimpedance spectroscopy (BIS) measurements of breast lymphedema poses practical and technical challenges, in particular the determination of the resistance at zero frequency (R0), the index of change in breast lymph content. Conventionally, R0 is calculated from data analysis by using a procedure eponymously known as Cole modeling, a method that is error-prone in the breast. The aim of this study was to evaluate polynomial curve fitting as an alternative analytic procedure.
Methods and Results:
A sub-set of breast BIS measurements from 41 women with self-ascribed breast lymphedema obtained as part of the Breast Edema Exercise Trial (BEET) were analyzed by both the Cole and polynomial methods. BIS files for all subjects were able to be analyzed by using the polynomial method but only 73% and 88% of data files were analyzed for the affected and unaffected breasts, respectively, by using the Cole method. For those files that were capable of being analyzed by both methods, R0 values were highly correlated (r = 0.99) but with a small (1.6%) although statistically significant difference (paired t test, p < 0.001) between methods.
Conclusions:
Analysis of BIS data using polynomial curve fitting is an acceptable and robust alternative to Cole modeling, particularly where impedance measurements are susceptible to technical sources of error of measurement. The small magnitude of difference observed between methods is unlikely to lead to misclassification of patients with lymphedema based on BIS assessment.
Introduction
Breast and chest lymphedema are frequent consequences of treatment for breast cancer. 1 The little data available suggest that it is common. Breast edema, determined by ultrasound, was present in 70% of women within 1 year of surgery who had undergone axillary clearance. 1 In contrast, clinical diagnosis of breast lymphedema based on physical findings of edema, erythema, and their distribution was identified in 38 (31%) of 124 women within the first year after breast surgery. 2 Similarly, 67 (35%) of women with self-reported lymphedema noted that it was either solely in the chest/breast region or included in this region 1–5 years after surgery. 3
The paucity of data on its occurrence is, in part, due to difficulties associated with its detection and measurement. Lymphedema is commonly assessed by the degree of swelling that occurs as lymph accumulates in the tissues. Measurement methods include those of volume by water displacement methods and perometry, geometrical measurements such as of limb circumferences, and bioimpedance spectroscopy (BIS). 4 Unfortunately, these methods are all best suited for use on cylindrical forms such as the arms and legs rather than the breast and upper quadrant of the trunk. 4 This has led to diagnosis that is typically based on either self-report 3 or by the clinician's assessment, for example, using a simple 3-point grading scheme (mild/moderate/severe) for the presence of edema. 2
BIS is widely accepted for the early detection and monitoring of lymphedema in both breast cancer and gynecological cancer-related lymphedema. 5 The use of BIS in breast lymphedema has not been extensively investigated. The only published report to date is a small study in which the reliability of tonometry and BIS for measurement of breast edema was investigated. Both methods were reproducible and so it was concluded that that both methods were suitable for use for measurement of breast lymphedema. 6 However, little detail on the measurement protocol was provided and only inter-subject covariance data were reported.
BIS of the breast is challenging. The principle underlying BIS is that the opposition to the flow of an applied electric current (impedance or resistance) through a conductive body is inversely proportional to the conductive volume. 7 If the applied electric current is an alternating current at low, and ideally zero, frequency, then current flow is through the extracellular water (ECW) of extracellular fluid. Consequently, the measured resistance is that of ECW, of which lymph is a principal component. The resistance at zero frequency (R0) is, therefore, quantitatively related to lymph volume. 8
R0 cannot be measured directly but is estimated by extrapolation using curve fitting procedures from impedance measurements obtained over a practical range of frequencies. 9 This process is known as Cole modeling in which the resistive (R) component of impedance is plotted against the reactive (reactance, Xc) component. 10 The accuracy of R0 estimates is dependent on the quality of the raw impedance measurements and of curve fitting to this R-Xc plot.
Impedance measurements of the human body are prone to measurement errors. 11 These errors are associated with the geometry and physical characteristics of the body being measured and to technical errors of measurement. Ideally, the conductive volume should approximate a cylinder explaining why BIS is highly suitable for use in arms and legs. 7 This is clearly not the case for the breast. Although manufacturers of impedance devices endeavor to minimize technical errors, BIS data, particularly at both the high and low extremes of measurement frequencies, are inevitably compromised by erroneous measurement of reactance, which further weakens the accuracy of Cole modeling. 12 Rather than rely on curve fitting to the Cole model (R-Xc plot), which inherently includes error associated with measurement of reactance, an alternative approach is to compute R0 from the change in resistance with frequency (R-f plot).13,14
This study assessed whether this alternative to Cole modeling for the determination of R0 from impedance measurements of the breast provides an alternative method for assessment of breast edema.
Methods
Participants
Participants were a sub-sample of participants (n = 41) in the Breast Edema Exercise Trial (BEET). The protocol for this trial is registered with the Australian Clinical Trials Registry (ACTRN12612000771853) 15 and approved by the Human Ethics Committees of the University of Sydney, Australia and the University of Queensland, Australia. All participants gave written informed consent to participate in the study. Briefly, participants were women aged older than 18 years who had undergone surgery for breast cancer and reported having breast lymphedema symptoms for at least 3 months. Data used in this study were baseline BIS measurements of both breasts for each participant. Participant characteristics (height, weight, age, side of surgery) were extracted from the trial database.
Bioimpedance measurements
BIS measurements of each breast were obtained with an SFB7 impedance spectrometer (ImpediMed Ltd., Brisbane, Australia). This device uses two distally located electrodes to pass a harmless (200 μA)
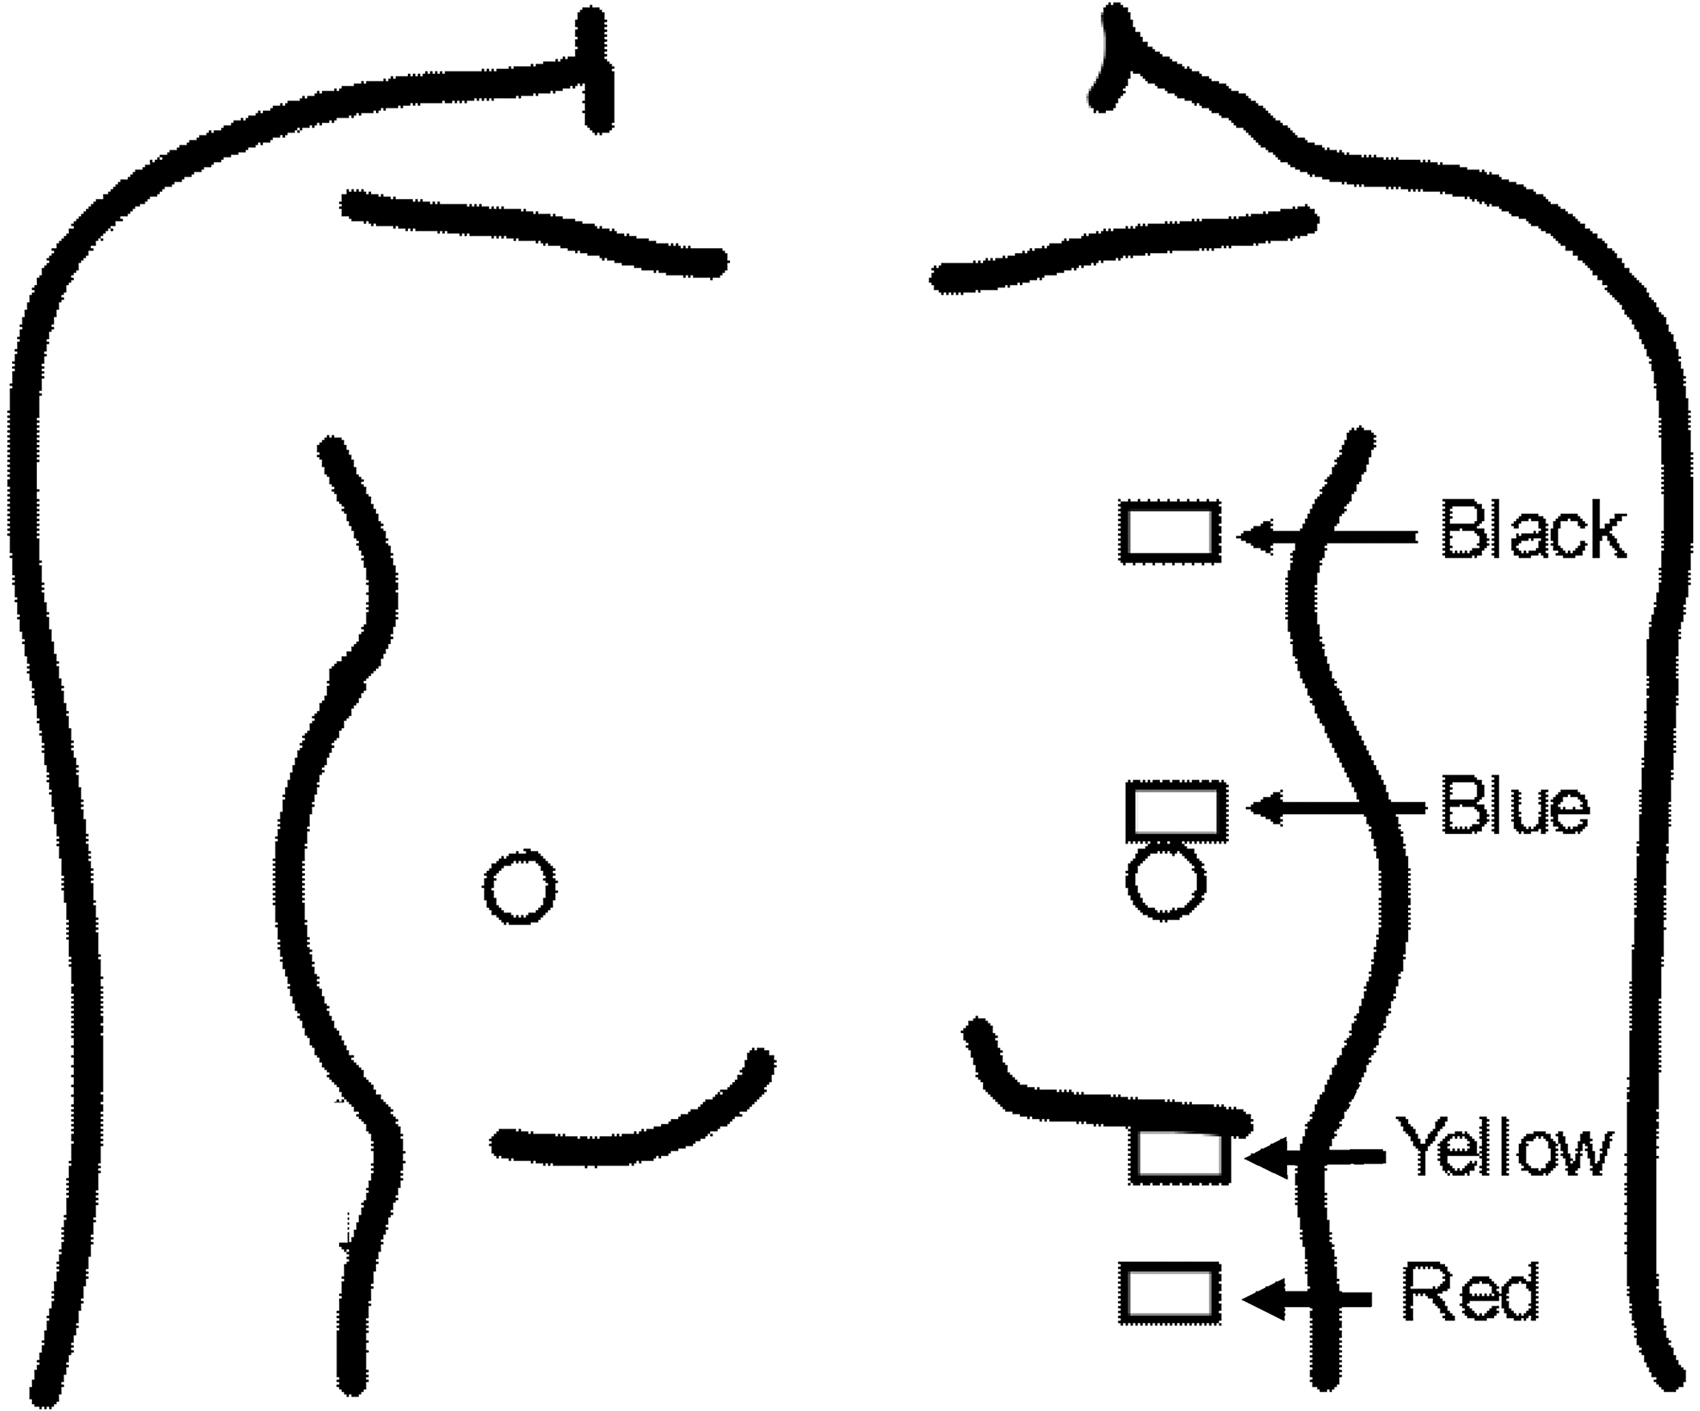
Location of electrodes for impedance measurement of the breast. Key: voltage measurement electrodes were positioned in the center of the breast at the inframammary fold (yellow) and at the superior areolar edge (blue). Current drive electrodes were positioned a minimum of 1 cm above the areolar electrode (black) and at a similar distance below the electrode at the inframammary fold (red).
Data analysis
SFB7 impedance files were analyzed by using software (Bioimp 4.1.2) provided by the manufacturer. These files are ASCII text files and consist of header rows containing device information and three data columns, including measurement frequency, measured resistance, and measured reactance. Conventional Cole modeling analysis 10 applies a curve-fitting procedure to resistance versus reactance data and extrapolates the fitted curve to zero frequency to estimate the resistance at this frequency (R0). An alternative analysis applies a polynomial curve-fitting procedure to the change in resistance with frequency to similarly estimate the resistance at zero frequency. This procedure was originally suggested by Siconolfi et al. 14 and trialed by Cornish and Ward. 12
Cole modeling
Impedance data were fitted to the Cole model by using the default analysis settings in Bioimp software. This procedure fits a semi-circular arc to reactance versus resistance by using a non-linear regression procedure. Curve fitting was applied only to data collected at frequencies in the range 5–500 kHz, excluding data at error-prone high and low frequencies. In addition, a 10% rejection level was adopted to exclude data points whose locus exceeded >10% the radius of the fitted semi-circle. The numbers of excluded data points were recorded. The software also attempted to correct for high-frequency errors, the so-called “hook effect,” 16 by implementing a time-delay (Td) correction. 11 Goodness-of-fit of the measured data to the fitted curve was assessed as the percentage standard error of the estimate (%SEE or %residual standard deviation [SD]). R0 was estimated by extrapolation of the semi-circular curve to the intersection with the resistance axis at zero (Fig. 2a, b).
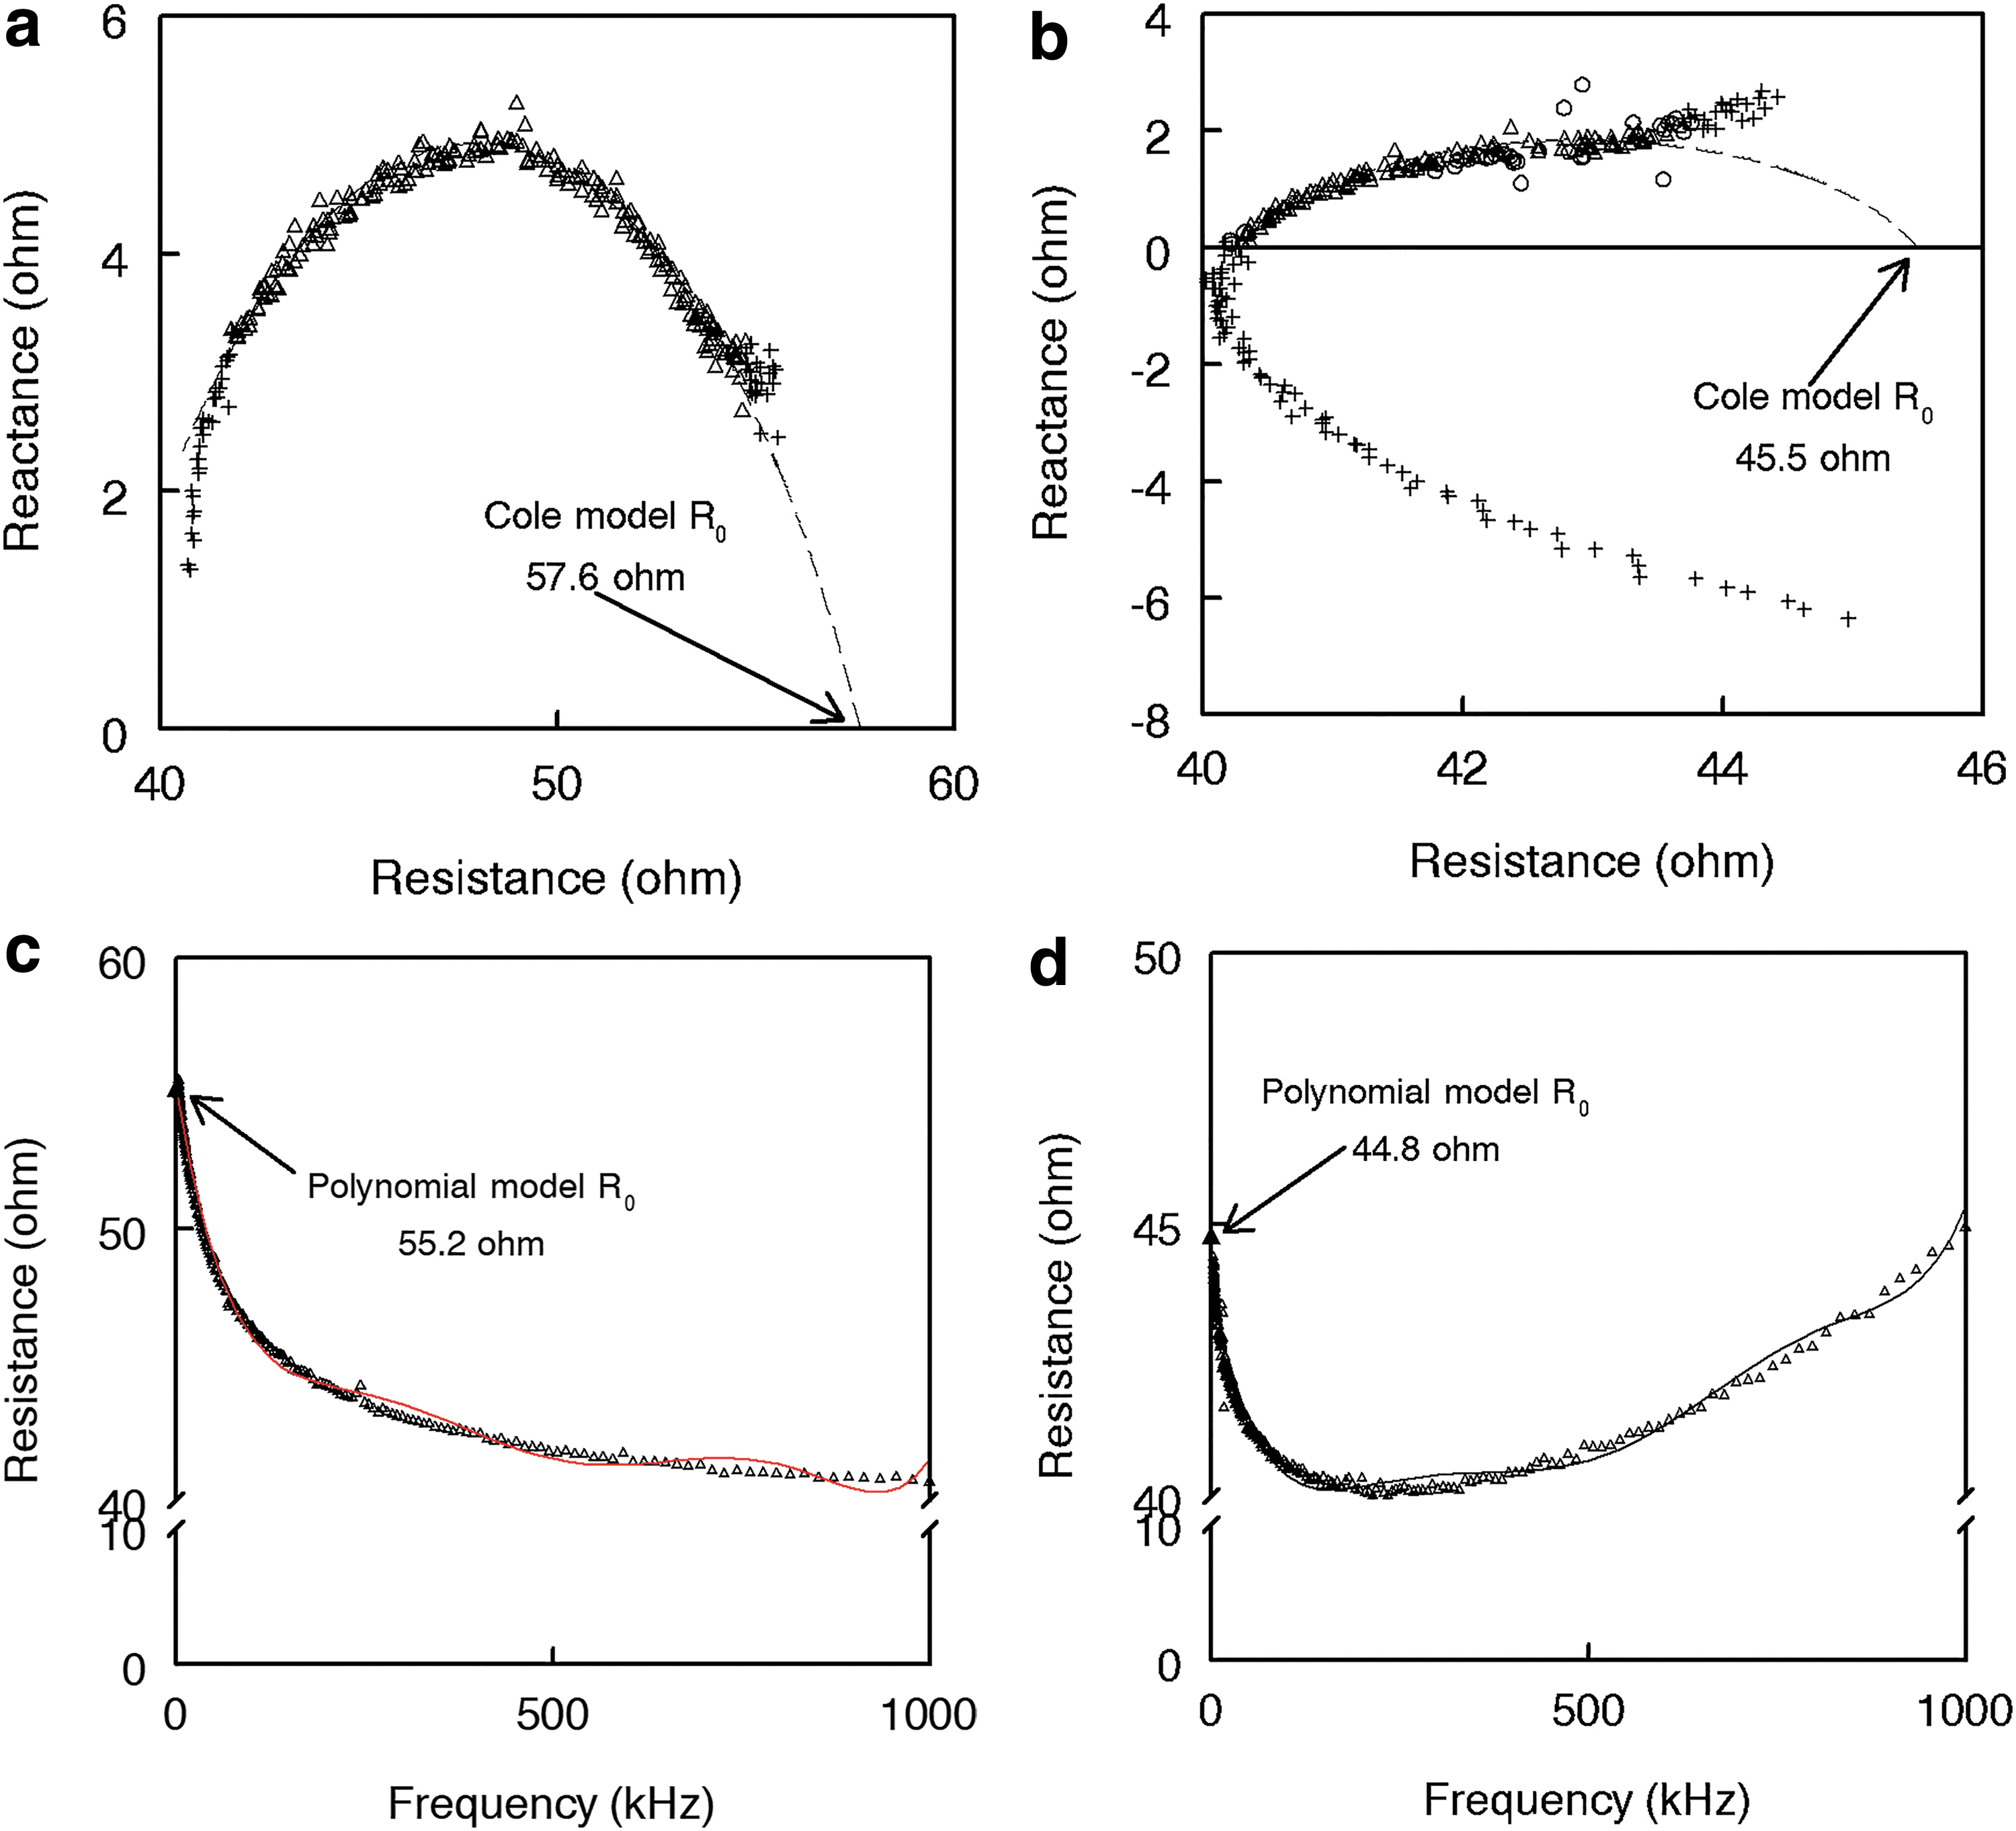
Modeling of bioimpedance spectroscopy impedance data to obtain an estimate of R0.
Polynomial modeling
The frequency and resistance data from all 256 frequencies were extracted from the SFB7 data file and used as input to the plotting and analysis software, Slidewrite v7.01 (Advanced Graphics Software, Inc., Rancho Santa Fe, CA). A sixth-order polynomial was fitted to the resistance versus frequency data by using the curve-fitting module of SlideWrite. 12 Curve fitting was accomplished by linear least-squares regression, and goodness-of-fit was assessed by the coefficient of determination (R 2 ) and the residual SD. The residual SD was converted to a %SEE for comparison with the Cole modeling approach. R0 was determined from the best-fitting polynomial for each data file.
Statistical analysis
Data are presented as means ± SD. The relationship between R0 determined by each modeling method was assessed by Passing and Bablok regression, 17 Pearson's correlation coefficient (rp), and Lin's concordance correlation (rc). 18 Agreement between methods was assessed by paired t tests and limits of agreement (LOA) analysis. 19 Differences in proportions of files analyzed were assessed by using z test. All statistical analyses were performed with MedCalc v 19.0.7 (MedCalc Software bv, Ostend, Belgium) or Smith's Statistical Package v 2.80 (Pomona College, Claremont, CA).
Results
Forty-one women were available for study (Table 1). All women had undergone wide local excision, with 18 receiving surgery on the left breast and 23 on the right breast. All women had available for analysis BIS data files for both the unaffected and affected breasts.
Participant Demographics and Bioimpedance Data
Data presented as mean ± SD.
Significance of difference, a versus bp < 0.0002; c versus dp < 0.0004; e versus fp < 0.001, g versus hp < 0.01, i versus jp < 0.02.
SD, standard deviation; %SEE, percentage standard error of the estimate.
Examples of Cole plots are presented in Figure 2a and b. Figure 2a presents a typical good-quality data file in which the software default settings were able to provide a good estimate, as determined by a %SEE <1%, of R0. In contrast, Figure 2b presents an example of poor-quality data in which a curve fit was possible but the %SEE was poor (3.2%).
The available frequencies for use with Cole modeling ranged from the maximum available, that is, 203 (79.3%) down to only 19 (7.4%) of the 256 frequencies. The default settings automatically excluded 22 low (<5 kHz) frequencies and 31 high (>500 kHz) frequencies; however, there were up to 92.6% of data points rejected as being error-prone in some files.
Figure 2c and d present the polynomial model fitted curves for the same data files as presented in Figure 2a and b. In each case, data for all frequencies were used and provided estimates of R0 with high fidelity, R2 = 0.995 and %SEE = 0.648% and R2 = 0.964 and %SEE = 0.612%, respectively. All files were able to be analyzed by using polynomial modeling, whereas between 73% and 88% of files only were able to be analyzed by Cole modeling (Table 1). Mean %SEE for polynomial fitting was approximately sixfold smaller than that observed for Cole modeling (Table 1).
Where it was possible to analyze files by both methods, a high correlation between R0 values determined by each of the two methods was observed (rc = 0.994; p < 0.001; Fig. 3a). The mean values were, however, significantly different (p < 0.0001) irrespective of whether the data were for the affected or unaffected breast although the magnitude of this difference was extremely small (Fig. 3c). LOA analysis showed a mean difference of 1 ohm (1.6%) with 2 SD LOA of ±2.7 (±5.4%) ohm. A significant (p < 0.001) positive slope to the relationship of the difference between the methods and the magnitude of R0 was observed (Fig. 3b).
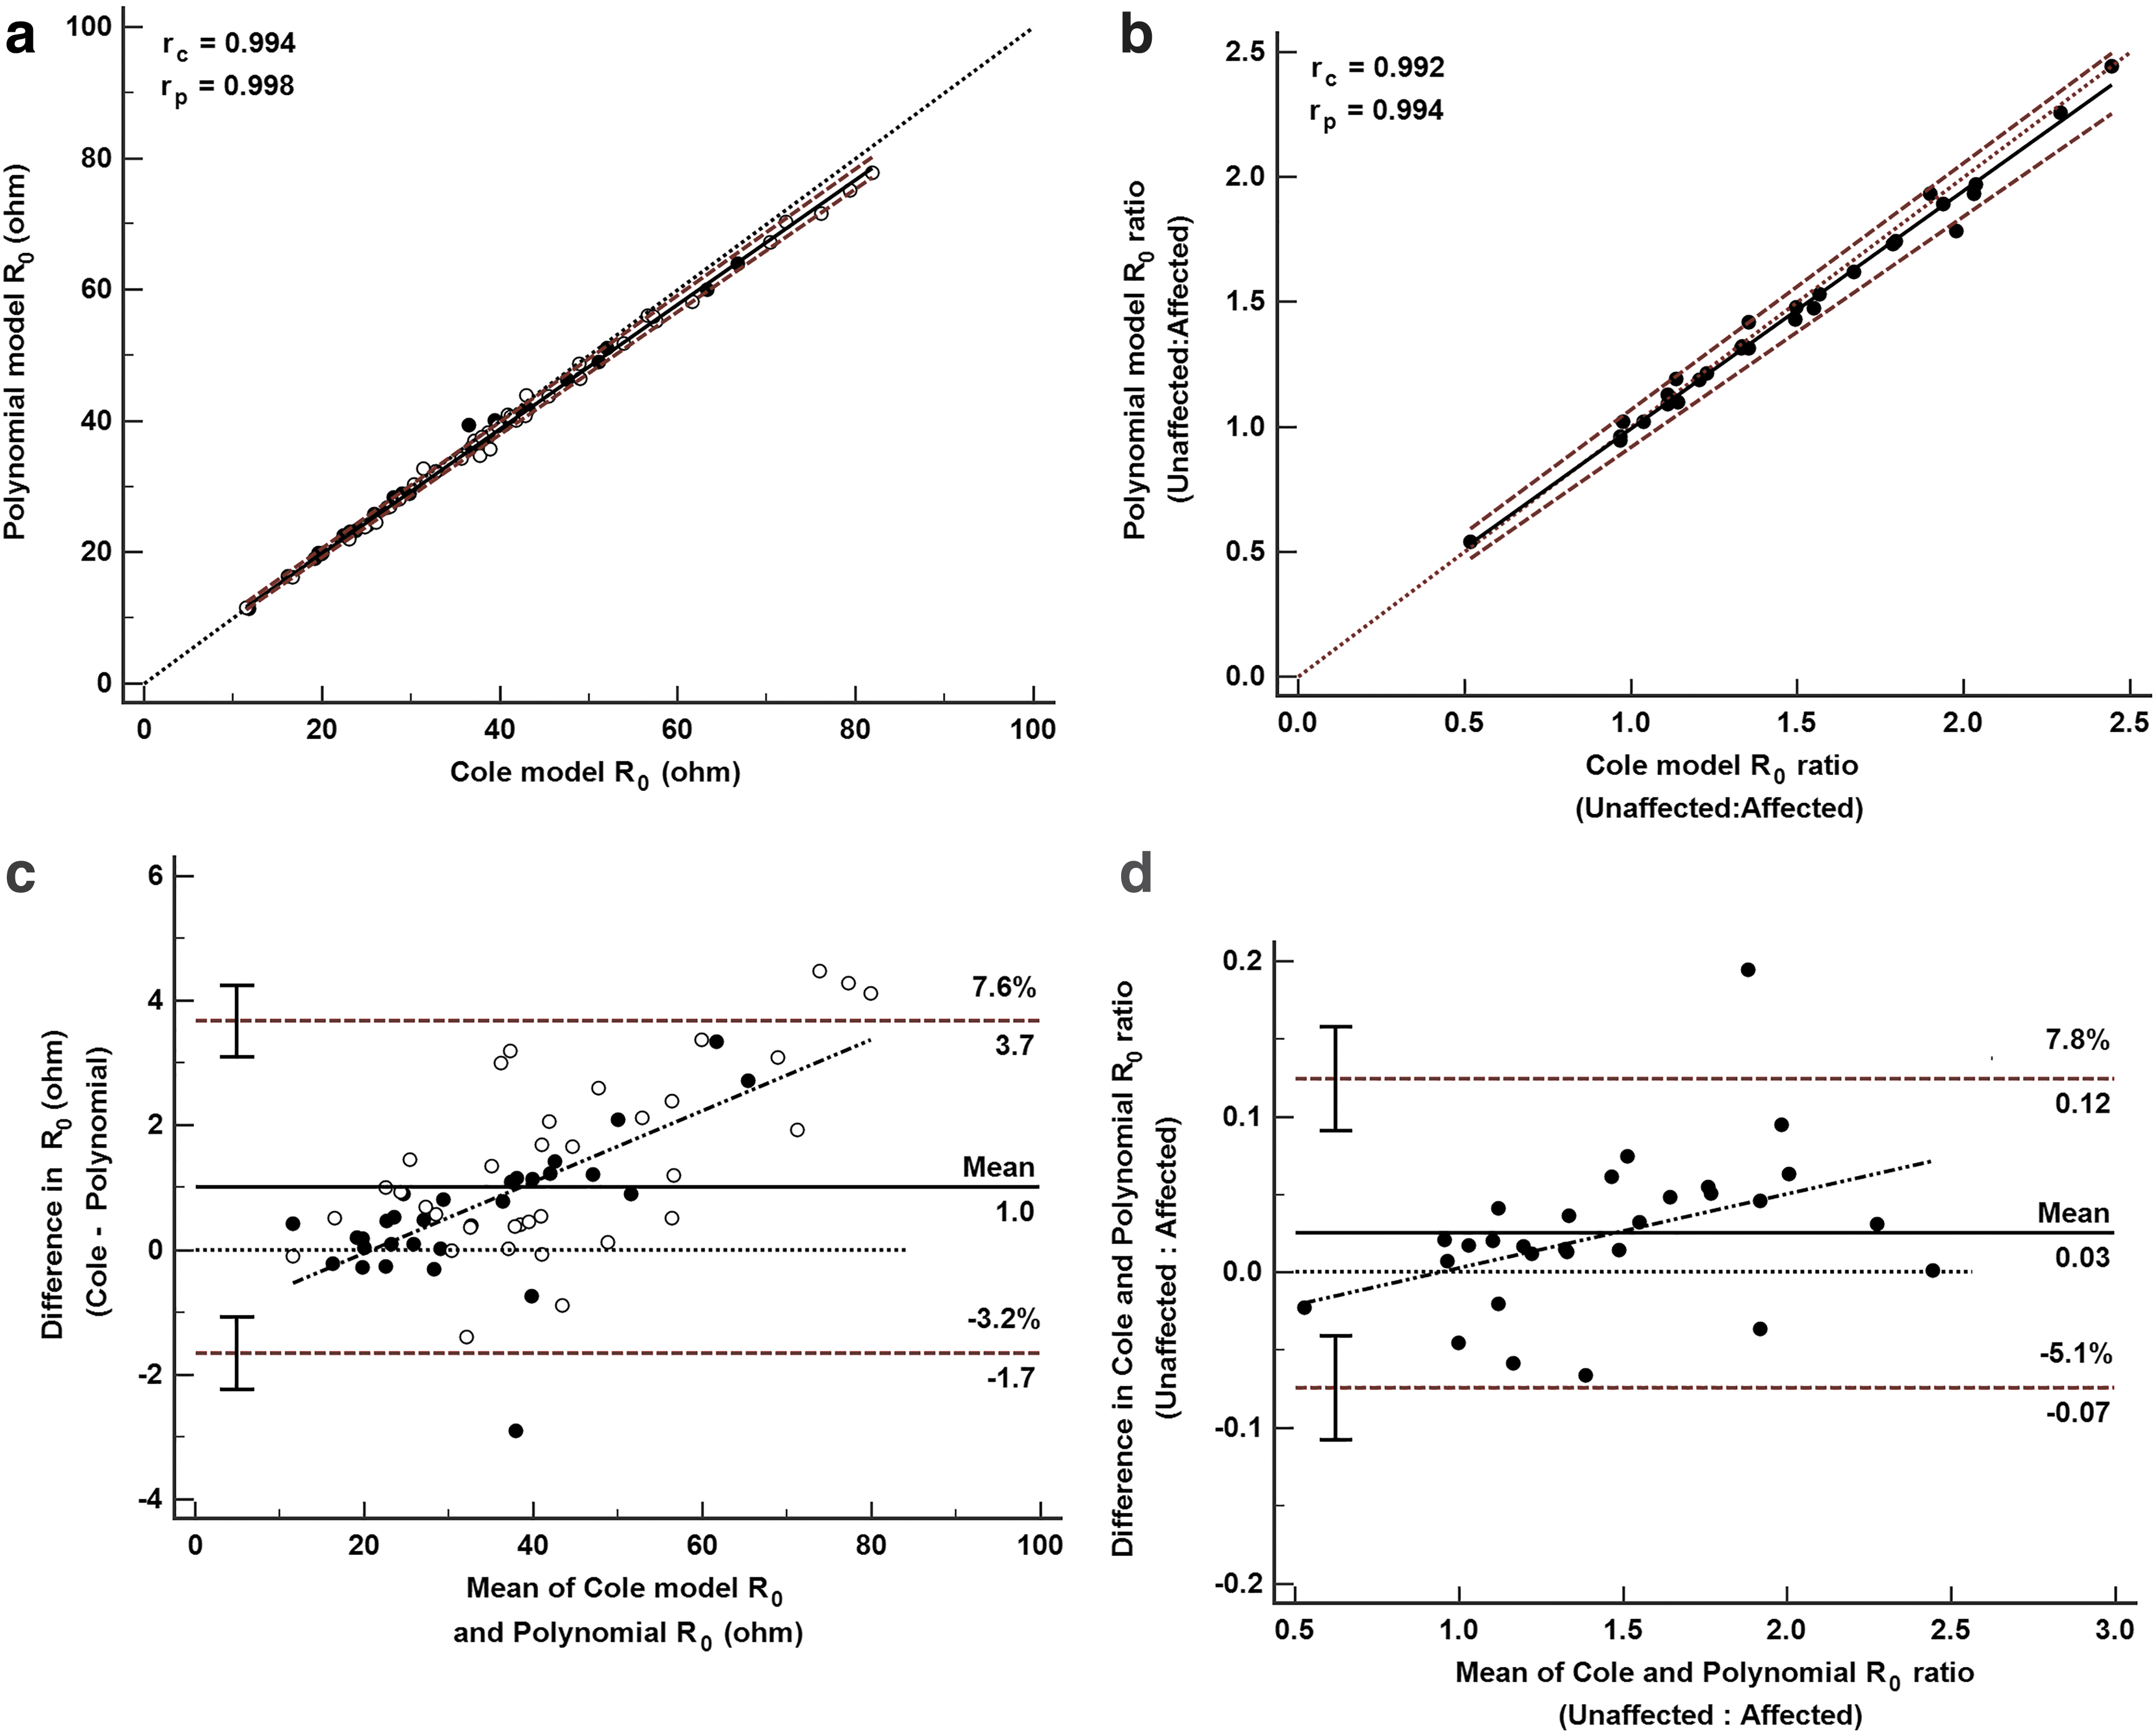
Comparison of R0 and R0 ratio calculated from either Cole or polynomial modeling.
In unilateral cases of lymphedema, R0 values of the at-risk/affected region are compared with the R0 values of the ipsilateral control region, and they are expressed as the R0 ratio (unaffected:at-risk). 20 There was a high correlation (rc = 0.992, p < 0.001) between R0 ratios calculated for each method (Fig. 3b). As for absolute R0 values, there was a significant but smaller difference in the ratios (p < 0.01) with a mean difference of 0.03 units and LOA of 0.1 (6.4%) units (Fig. 3d).
Discussion
Lymphedema of the breast is a significant sequala after surgical treatment for breast cancer.1,2,21 The ability to measure the presence of swelling in an inexpensive, simple manner would assist the clinician in diagnosing the problem and in initiating appropriate treatment at the earliest opportunity. To date, the most effective methods for assessment of breast swelling have been the patient's self-report of symptoms, clinical examination, or the use of ultrasound.1–3 The data of this study demonstrate that BIS with the application of appropriate data analytical methods presents an alternative method to obtain an objective measurement of swelling.
BIS is used extensively for evaluation of arm or leg swelling. However, it has had limited application in the breast due to the error-prone nature of the data largely precluding analysis using conventional Cole modeling, a prerequisite for determination of R0 ratios or L-Dex scores. These errors affect primarily the reactive component of impedance measurements, leaving the resistive component relatively immune to such errors.22,23 This presents the possibility of estimating R0 based purely on measurements of resistance. The data of this study confirm earlier observations in the whole body of the utility of this approach and extends its use to the breast. 12 Resistance-based modeling was associated with much lower error rates of determination than Cole modeling. In addition, resistance-based modeling was able to analyze all data files irrespective of the quality of the underlying raw data (R and Xc).
Where both methods could be used for analysis, there was a high degree of concordance between the two methods although they were not identical. It should be emphasized that the mean difference in prediction of R0 (1.6%) yielded a 1.9% difference in R0 ratio (0.03 units, Table 1 and Fig. 2d). Since R0 ratio cut-offs for breast lymphedema are not currently available, the clinical significance of a difference of this magnitude is unclear. However, if the present observations are equally applicable to arm lymphedema, they imply an uncertainty of ±0.19 units, that is, 9.81–10.19 in the L-Dex score (10 units), which is indicative of the presence of lymphedema. 24 This level of uncertainty is within the range of repeatability of replicate measurements of arm impedance and is unlikely to lead to false classification of women with or without lymphedema.
The participants in this study were all women who had undergone wide local excision and had self-reported the presence of breast lymphedema. Mean R0 ratios were all greater than unity, irrespective of analytical method, that is, indicative of the presence of lymphedema and supporting participants' self-report. It should also be noted that women in the study had undergone wide local excision and consequently would have less breast mass in the treated breast, A smaller tissue mass implies less ECW and lymph and, consequently, a higher resistance for that breast. Ratios exceeded the cut-offs used for early detection of breast cancer-related lymphedema 25 although whether these are applicable to the breast is unknown.
A number of limitations to the study should be acknowledged. First, the study did not aim at investigating whether the electrode positions were optimal for impedance measurements of the breast. It is possible that alternative positions could decrease geometric sources of error in impedance measurements. In practice, it was found to be very difficult to replicate identical electrode positioning from woman to woman. The shape and size of the breast is highly variable between women, indeed also between breasts within a woman, particularly where there may have been unilateral surgery. Every attempt was made to duplicate electrode positions on each breast. The measurement of breast impedance is now being utilized in studies of lactation26,27 and awareness of this literature by researchers in lymphedema may provide information to optimize electrode locations. Second, this study was limited to a consideration of analytical methods only to circumvent technical errors of measurement and not to determine the source of or to mitigate such errors. Improvements in impedance technology may eventually obviate the need for alternative data analytical approaches.
This study sets the basis for further development of BIS for assessment of breast lymphedema. We demonstrated that R0 ratios for the breast can be determined. However, the extent to which these data represent an accurate index of lymphedema is unknown, requiring a validation study against a reference method. This step may be a challenge, as there is no consensus as to what is an acceptable reference for breast lymphedema.
In conclusion, the measurement of breast lymphedema by BIS is possible and practical. Data analysis by polynomial curve fitting of resistance data is recommended as a more robust alternative to conventional modeling in these cases. Further research is required to establish an accurate and reliable lymphedema index for the breast analogues to L-Dex used for limb lymphedema.
Footnotes
Author Disclosure Statement
L.C.W. is a consultant to ImpediMed Ltd. manufacturer of impedance devices. ImpediMed Ltd. had no involvement in the concept, design, or execution of this study nor in the preparation of this article. All other authors have no relevant conflicts of interest to report.
Funding Information
This study was funded by a project grant (1021608) from the National Health and Medical Research Council (NHMRC) of Australia.