
Abstract
Background:
While supine bioimpedance devices are used to evaluate for lymphedema (LE), stand-on devices are gaining popularity. Because research on differences in bioimpedance values between the two devices is limited, this study's purposes were to: (1) determine the average upper limb impedance values and inter-limb ratios for women who self-reported having (n = 34) or not having (n = 61) a history of LE, using a single-frequency supine device and a multifrequency stand-on device; (2) compare the level of agreement in inter-limb impedance ratios between the two devices; evaluate the percent agreement between the two devices in classifying cases of LE using established supine thresholds; and evaluate the percent agreement in classifying cases of LE between the supine device using previously established supine thresholds and the stand-on device using two published standing thresholds.
Methods and Results:
Bioimpedance measures were done using the two devices. For the entire sample, absolute impedance values for both the affected and unaffected limbs were significantly higher for the stand-on device in women with and without LE. Impedance values for the two methods were highly correlated. Bland–Altman analysis determined that for the entire range of impedance ratios the values for the two devices could not be used interchangeably.
Conclusions:
Findings suggest that the stand-on device can be a useful and valid tool to assess for LE. However, because agreement is not perfect, values obtained from the two devices should not be used interchangeably to evaluate for changes in impedance ratios, particularly for ratios of >1.20.
Introduction
Breast cancer-related lymphedema (LE) continues to be a significant clinical problem for women following breast cancer treatment. Of the nearly 3.8 million breast cancer survivors in the United States, one in five will develop LE that is associated with significant functional limitations and decreases in quality of life.1–5 LE results from damage to lymph nodes and lymphatic vessels and is characterized by the accumulation of extracellular fluid (ECF) in the upper limb and torso. Early and accurate detection of LE improves both physical and psychosocial outcomes. 6
The diagnosis of upper limb LE is done by comparing the volume of the affected to the unaffected limb or by comparing postoperative to preoperative values if available. Common measures to detect LE include: water displacement during limb immersion, circumferential assessment, and bioimpedance analysis (BIA). 7 Both water displacement and circumferential assessments provide information about total limb volume. Total limb volume includes muscle, bone, intracellular fluid (ICF), and ECF.
Because it allows for the measurement of ECF volume specfically, 8 the use of bioimpedance provides a more accurate assessment of LE. BIA provides a measure of impedance to the flow of an alternating electrical current passed through body fluids. As ECF volume increases, as it does with LE, impedance decreases. The ratio of impedance in the unaffected limb to that in the affected limb is compared with baseline ratios or published norms to evaluate for changes in limb volume. 5 The use of bioimpedance to assess for LE has increased because of its ease of use, improved reliability and accuracy, and ability to detect changes in limb volume earlier than other methods.9–12 Current evidence supports the use of bioimpedance as a sensitive and specific measure for the early detection of LE. 13
Commercially available bioimpedance devices include those that perform: single frequency (i.e., 50 kHz) BIA (SF-BIA), multifrequency BIA (MF-BIA), or bioimpedance spectroscopy (BIS). MF-BIA devices measure impedance at several frequencies (e.g., 1, 5, 50, 250, 500, and 1000 kHz). BIS devices measure impedance using more than 200 frequencies ranging from 4 to 1000 kHz. 14 While high-frequency current passes through both ICF and ECF compartments, low-frequency current conducts minimally through cells, passing selectively through ECF. Measurement of impedance at lower frequencies provides a more accurate measure of ECF impedance and is inversely proportional to ECF volume. 15
Until recently, the most commonly used bioimpedance devices were lead-type devices that required patients to lie supine with nonreusable electrodes placed on the wrists and ankles. In contrast, use of a stand-on MF-BIA device requires that patients stand on a platform and grip bilateral handles that house the electrodes, eliminating the need for single-use electrodes. Stand-on bioimpedance devices are gaining popularity, because they require less time and less space and eliminate the need for proprietary single-use electrodes.
Only two studies have evaluated for agreement between assessments of LE using a stand-on device compared with other methods used to assess limb volume. In a study that compared standing MF-BIA to supine BIS in 37 healthy adults, 15 measures of impedance at 0, 5, and 50 kHz were highly correlated at all frequencies (r = 0.80–0.82). However, significant differences were found (p < 0.001) between the two devices in absolute impedance values and in inter-limb ratios at all frequencies. These findings led the authors to conclude that values from the two devices were not interchangeable. In addition, they suggested that the range of inter-limb impedance ratios (and thus, the diagnostic threshold ratios for LE) established by Cornish et al., 9 of 1.139 when the dominant limb is at risk and 1.066 when the nondominant limb is at risk, and later by Ward et al., 5 of 1.134 and 1.106, respectively, should not be applied to data obtained using a stand-on MF-BIA device because these thresholds were developed using a supine device.
Most recently, in a study that compared a supine lead type BIS device with a stand-on device in 47 healthy controls and 53 women with or at risk for LE, 16 high correlations (r = 0.92) were found between the impedance measures. However, the absolute impedance values were higher for the stand-on device than for the lead type device. The authors suggested that these discrepancies were related to between-device differences in the anatomic positions of the sense electrodes and concurrent physiologic differences in the electrical volume that was measured. They noted that since both limbs will be effected in a similar fashion, the use of inter-limb impedance ratios should minimize differences between the two positions. In fact, no significant differences were found in the impedance ratios between the two devices. However, since the magnitude of the absolute inter-limb impedance values were significantly different between the two devices, values from the two devices should not be used interchangeably.
Subsequent work was done to determine reference values for upper limb LE using the stand-on device. In a study that assessed 643 healthy women and 70 women with LE (i.e., 2 cm inter-limb difference above or below the elbow), 17 impedance ratios were calculated from data obtained at 1 and 5 kHz using the stand-on InBody 720 MF-BIA device (InBody, Seoul, South Korea). Statistically significant differences in impedance ratios were found between healthy women and women with LE (p < 0.001). Impedance ratio cutoff values for the diagnosis of LE were determined using the mean ratios at +2 and +3 standard deviations (SDs) above the healthy women's values, as well as through the use of receiver operating characteristic curves. Highest area under the curve (AUC) values, suggestive of greater accuracy, were found for the ratios obtained at 5 kHz (i.e., 1.070 if the dominant arm was affected [AUC = 0.863]; 1.030 if the nondominant arm was affected [AUC = 0.915]).
In another study of 228 women post breast cancer treatment (22 of whom had LE), 18 InBody 720 values at 1 and 5 kHz were used to determine the diagnostic accuracy of MF-BIA compared with circumference measurements. The average 1 kHz impedance ratio was 1.145 ± 0.234 for the LE group and 0.996 ± 0.039 for the non-LE group. The average 5 kHz impedance ratio was 1.133 ± 0.225 for the LE group and 0.994 ± 0.037 for the non-LE group. These authors proposed an alternative diagnostic cutpoint for interlimb ratios. Using AUC, the 5 kHz impedance ratio cutpoint of 1.047 was found to have the greatest accuracy (AUC = 0.77) relative to other cutpoints and to 1 kHz values. However, limb dominance was not taken into consideration. As expected, these ratios differed from those described by Ward et al. 5 and by Cornish et al. 9 In addition to differences in testing position (i.e., standing vs. supine), the previously established ratios were calculated as 3 SDs from normative values. In contrast, Lim et al. 18 determined their threshold based on AUC values using circumference measures as the reference standard.
Additional research on differences in impedance values obtained using supine versus stand-on devices is warranted. Electrode location, distance between electrodes, and the impact of gravity may result in variability between the two measurement methods. Given the paucity of research, the purposes of this study were fourfold: (1) determine the average upper limb impedance values and inter-limb ratios for women who self-reported having or not having a history (Hx) of LE, using a single-frequency supine lead-type device (i.e., RJL Systems Quantum X, Clinton Township, MI) and a multifrequency stand-on device (i.e., InBody 770; InBody); (2) compare the level of agreement in inter-limb impedance ratios between the single-frequency supine lead-type device and a multifrequency stand-on device; (3) evaluate the percent agreement between the two devices in classifying cases of LE using the previously established supine BIS thresholds; and (4) evaluate the percent agreement between the supine device using the previously established supine BIS thresholds 9 and the stand-on device using the alternative optimal standing thresholds proposed by Jung et al. 17 and Lim et al. 18 to classify cases of LE.
Materials and Methods
Participants
As part of a larger cross-sectional study, breast cancer survivors were recruited from the general population in the San Francisco Bay Area. Participants were: female, ≥18 years of age, had unilateral breast cancer, and were at least 6 months after the completion of treatment (i.e., surgery, radiation, and/or chemotherapy). Survivors' self-report of a past or current diagnosis of LE determined group assignment (i.e., with or without LE). Survivors were excluded if they had a bilateral mastectomy (which would not allow for the use of the unaffected side as a comparator); any metal implant (which could unpredictably alter bioimpedance measurements); history of primary LE; and a self-ascribed condition that would limit their ability to participate in an evaluation of upper extremity strength, movement, and sensation. The study was approved by the University of California San Francisco (UCSF) Institutional Review Board. The evaluation was done during a single visit to the UCSF Clinical Research Center.
During the 24 hours before their scheduled appointment, survivors were instructed to stay hydrated; not participate in vigorous weight lifting, aerobic exercise, or hot yoga; not use a sauna; and not consume alcohol. On the day of the visit, survivors were instructed not to wear body oils, lotions, or jewelry. Instructions for the 2 hours before the appointment were to limit exercise to leisure paced walking, consume no caffeine or food (other liquids were encouraged), and to remove any compression garments. At the time of the study visit, participants completed the written informed consent.
Anthropometric measurements
Height was measured without shoes, to the nearest 0.1 m using a digital standiometer (Seca Corporation, Chino, CA). Weight was measured to the nearest 0.05 kg using the stand-on MF-BIA device. Upper limb dominance was determined as the hand that was used to sign the consent form.
Impedance measurements
Supine measurements
The RJL Systems Quantum X single 50 kHz frequency impedance device was used to measure impedance of the upper limbs following the manufacturer's instructions. While wearing a hospital gown, the survivor lay supine on a firm, padded, nonconductive table, with upper limbs relaxed at the side of the body in 30° of shoulder abduction and elbows extended, for 10 minutes before measurement. Before placement of the disposable pregelled electrodes, electrode sites were inspected and cleaned of residue with an alcohol wipe. The drive electrodes were placed on the ring finger and 50 cm proximal to the ulnar styloid. The detection electrodes were placed on the wrist at the ulnar styloid and 40 cm proximal to the ulnar styloid. Readings were taken bilaterally and repeated twice for each limb in accordance with our previous studies.19–21
Standing measurements
The InBody 770 MF-BIA device (InBody) was used to measure impedance at 1, 5, 50, 250, 500, and 1000 kHz, using a tetrapolar 8-point electrode system. Before testing, the survivor stood for at least 5 minutes. Palms of the hands and soles of the feet were assessed and cleaned with a disposable wipe provided by the manufacturer. Following the manufacturer's instructions, the survivor, who was wearing a lightweight exercise bra and leggings, stepped, barefoot, onto the platform. The survivor held the handle grips with her thumbs on the thumb electrodes. Drive electrodes are located at the palms and front soles of the feet and sense electrodes are located at the thumbs and heels. The impedance measurements are isolated for each segment of the body by altering the connection between drive and sense electrodes. 22
The supine bioimpedance test was done first, followed by the standing test. The time between the tests was 6–15 minutes, depending on the availability of the equipment.
Data analyses
The supine resistance and reactance values were recorded. The impedance value (Z) was calculated for each upper limb based on the reported resistance (R) and reactance (Xc) values using the equation Z2 = R 2 + Xc 2 . The standing test's impedance values at 1, 5, 50, 250, 500, and 1000 kHz were downloaded from the device and transferred to SPSS version 23 (IBM Corporation, Armonk, NY).
Right and left upper limb values were recoded to indicate affected (i.e., side of breast cancer) and unaffected limbs. Standing and supine impedance values were used to calculate impedance ratios (unaffected/affected limbs). An impedance ratio of >1 represents a greater volume in the affected limb, relative to the unaffected limb. The higher the ratio, the greater the difference in the impedance between the two limbs and the more severe the LE.
Statistical analyses were carried out using SPSS version 23 (IBM Corporation). Descriptive statistics and frequency distributions for demographic and clinical characteristics were calculated. Independent sample t-tests were used to evaluate for between group differences. For variables that were highly skewed, the Mann–Whitney U test was used to evaluate for between-group differences. Pearson's correlation coefficients were used to evaluate the strength of the association between the impedance ratios obtained using the two devices.
In addition, Bland–Altman statistical methods were employed to determine the nature and extent of the agreement between the supine and the standing impedance ratios at their common frequency of 50 kHz. Bland–Altman methods are commonly used to evaluate the agreement between a new and an existing technique that measure the same physiological process. 23 The Bland–Altman method provides estimates of both systematic and random error. Difference scores for the impedance ratios between the two methods (i.e., supine vs. standing) were calculated. The average of the difference scores represents bias. A paired samples' t-test of the impedance ratios from the supine and the stand-on devices was done to determine the mean of the difference scores (bias), as well as the SD of the difference scores, and to test if the average difference scores were significantly different from zero.
An initial scatter plot with supine ratios on the x-axis and standing ratios on the y-axis was generated and the diagonal line of equality (representing a line that would exist if the two methods agreed perfectly) was added to the plot. A second plot, the Bland–Altman plot, was created with the mean of both methods on the x-axis and the difference score for the two methods on the y-axis. The mean of both methods is used to represent the best estimate of the true value of the measured variable. Patterns in the differences of both methods can be observed in the Bland–Altman plots. 23 In an ideal plot, the difference scores are clustered around the zero line and the width of the differences is constant across all values of the x-axis.
The bias, or mean difference between the methods, represents the systematic error between the two methods. Precision is indicated by the SD of the difference between the two methods, or the degree of random error present. Upper and lower limits of agreement (LOAs) are calculated to indicate where ∼95% of the differences would lie from the mean difference. The LOAs were calculated as follows: upper LOA = bias +1.96 × SD; lower LOA = bias −1.96 × SD. To determine the degree of confidence that can be placed on the estimate of bias, a 95% confidence interval (CI) for the bias was calculated. 23
For evaluation of percent agreement, LE was classified as present (YES) or absent (NO) using our impedance ratios from each device, compared with the thresholds established by Cornish et al. 9 LE was defined as an impedance ratio of ≥1.139 (if the dominant upper limb was affected) and ≥1.066 (if the nondominant upper limb was affected). The number of cases (YES) versus noncases (NO) identified, was compared between the two devices and reported as the percent agreement. In addition, percent agreement was evaluated using the optimal threshold ratios described by Jung et al. 17 that were determined using the InBody 720 at 5 kHz (i.e., 1.070 if the dominant limb was affected; 1.030 if the nondominant limb was affected). Kappa coefficients were calculated to evaluate agreement for categorical data. According to Lands and Koch, 24 a kappa statistic of ≥0.81 indicates almost perfect agreement.
Results
Demographics and clinical characteristics
A total of 95 breast cancer survivors with (n = 34) and without (n = 61) a self-reported past or current diagnosis of LE were included in this analysis. Their average age was 59.9 years (±9.6), weight was 71.0 (±18.0 kg), height was 163.8 (±7.0 cm), and body mass index was 25.8 (±4.9). The dominant limb was the affected limb for 55.8% of the survivors. No significant differences were found between the two groups on any of these characteristics. In terms of clinical characteristics, survivors with a history of LE were significantly more likely to have had a mastectomy and an axillary lymph node dissection (Table 1).
Demographic and Clinical Characteristics of Study Participants
Mann–Whitney U test was used because months since surgery was highly positively skewed.
ALND, axillary lymph node dissection; BMI, body mass index; Hx, history; LE, lymphedema; SD, standard deviation; SLNB, sentinel lymph node biopsy.
Impedance values and inter-limb ratios for both devices
Impedance values for the unaffected and affected upper limbs as well as impedance ratios and their ranges are presented in Table 2. Impedance values for the two devices were significantly different for both limbs (p < 0.001), with the stand-on device values being consistently higher. The average inter-limb impedance ratio (unaffected/affected) for the entire sample for the supine test was 1.05 (±0.17) and for the standing test was 1.04 (±0.12). This difference was statistically significant (p < 0.05). For the women with a history of LE, the difference in the inter-limb impedance ratio between devices was statistically significant (p < 0.05). However, for the women without LE, this difference was not significant.
Impedance Data Measured Using a Supine Single-Frequency Device and a Stand-on Multiple Frequency Device with the Mean Upper Limb Impedance Data Measured at 50 kHz
Includes shoulder in measurement.
Significant differences—supine versus standing: bp < 0.001; cp < 0.05.
Level of agreement between devices
Figure 1A shows the scatter plot for the impedance ratios from the supine versus the standing tests, including the line of equality for the entire sample of 95. The impedance values for the two methods were highly correlated at r = 0.969 (p < 0.001). The majority of the data points lie between the ratios of 0.80 and 1.20. Within this range, the points cluster very close to the line of equality. However, for ratios of >1.20, the discrepancy between the two methods is greater in that the supine ratios are consistently slightly higher compared with the standing ratios.
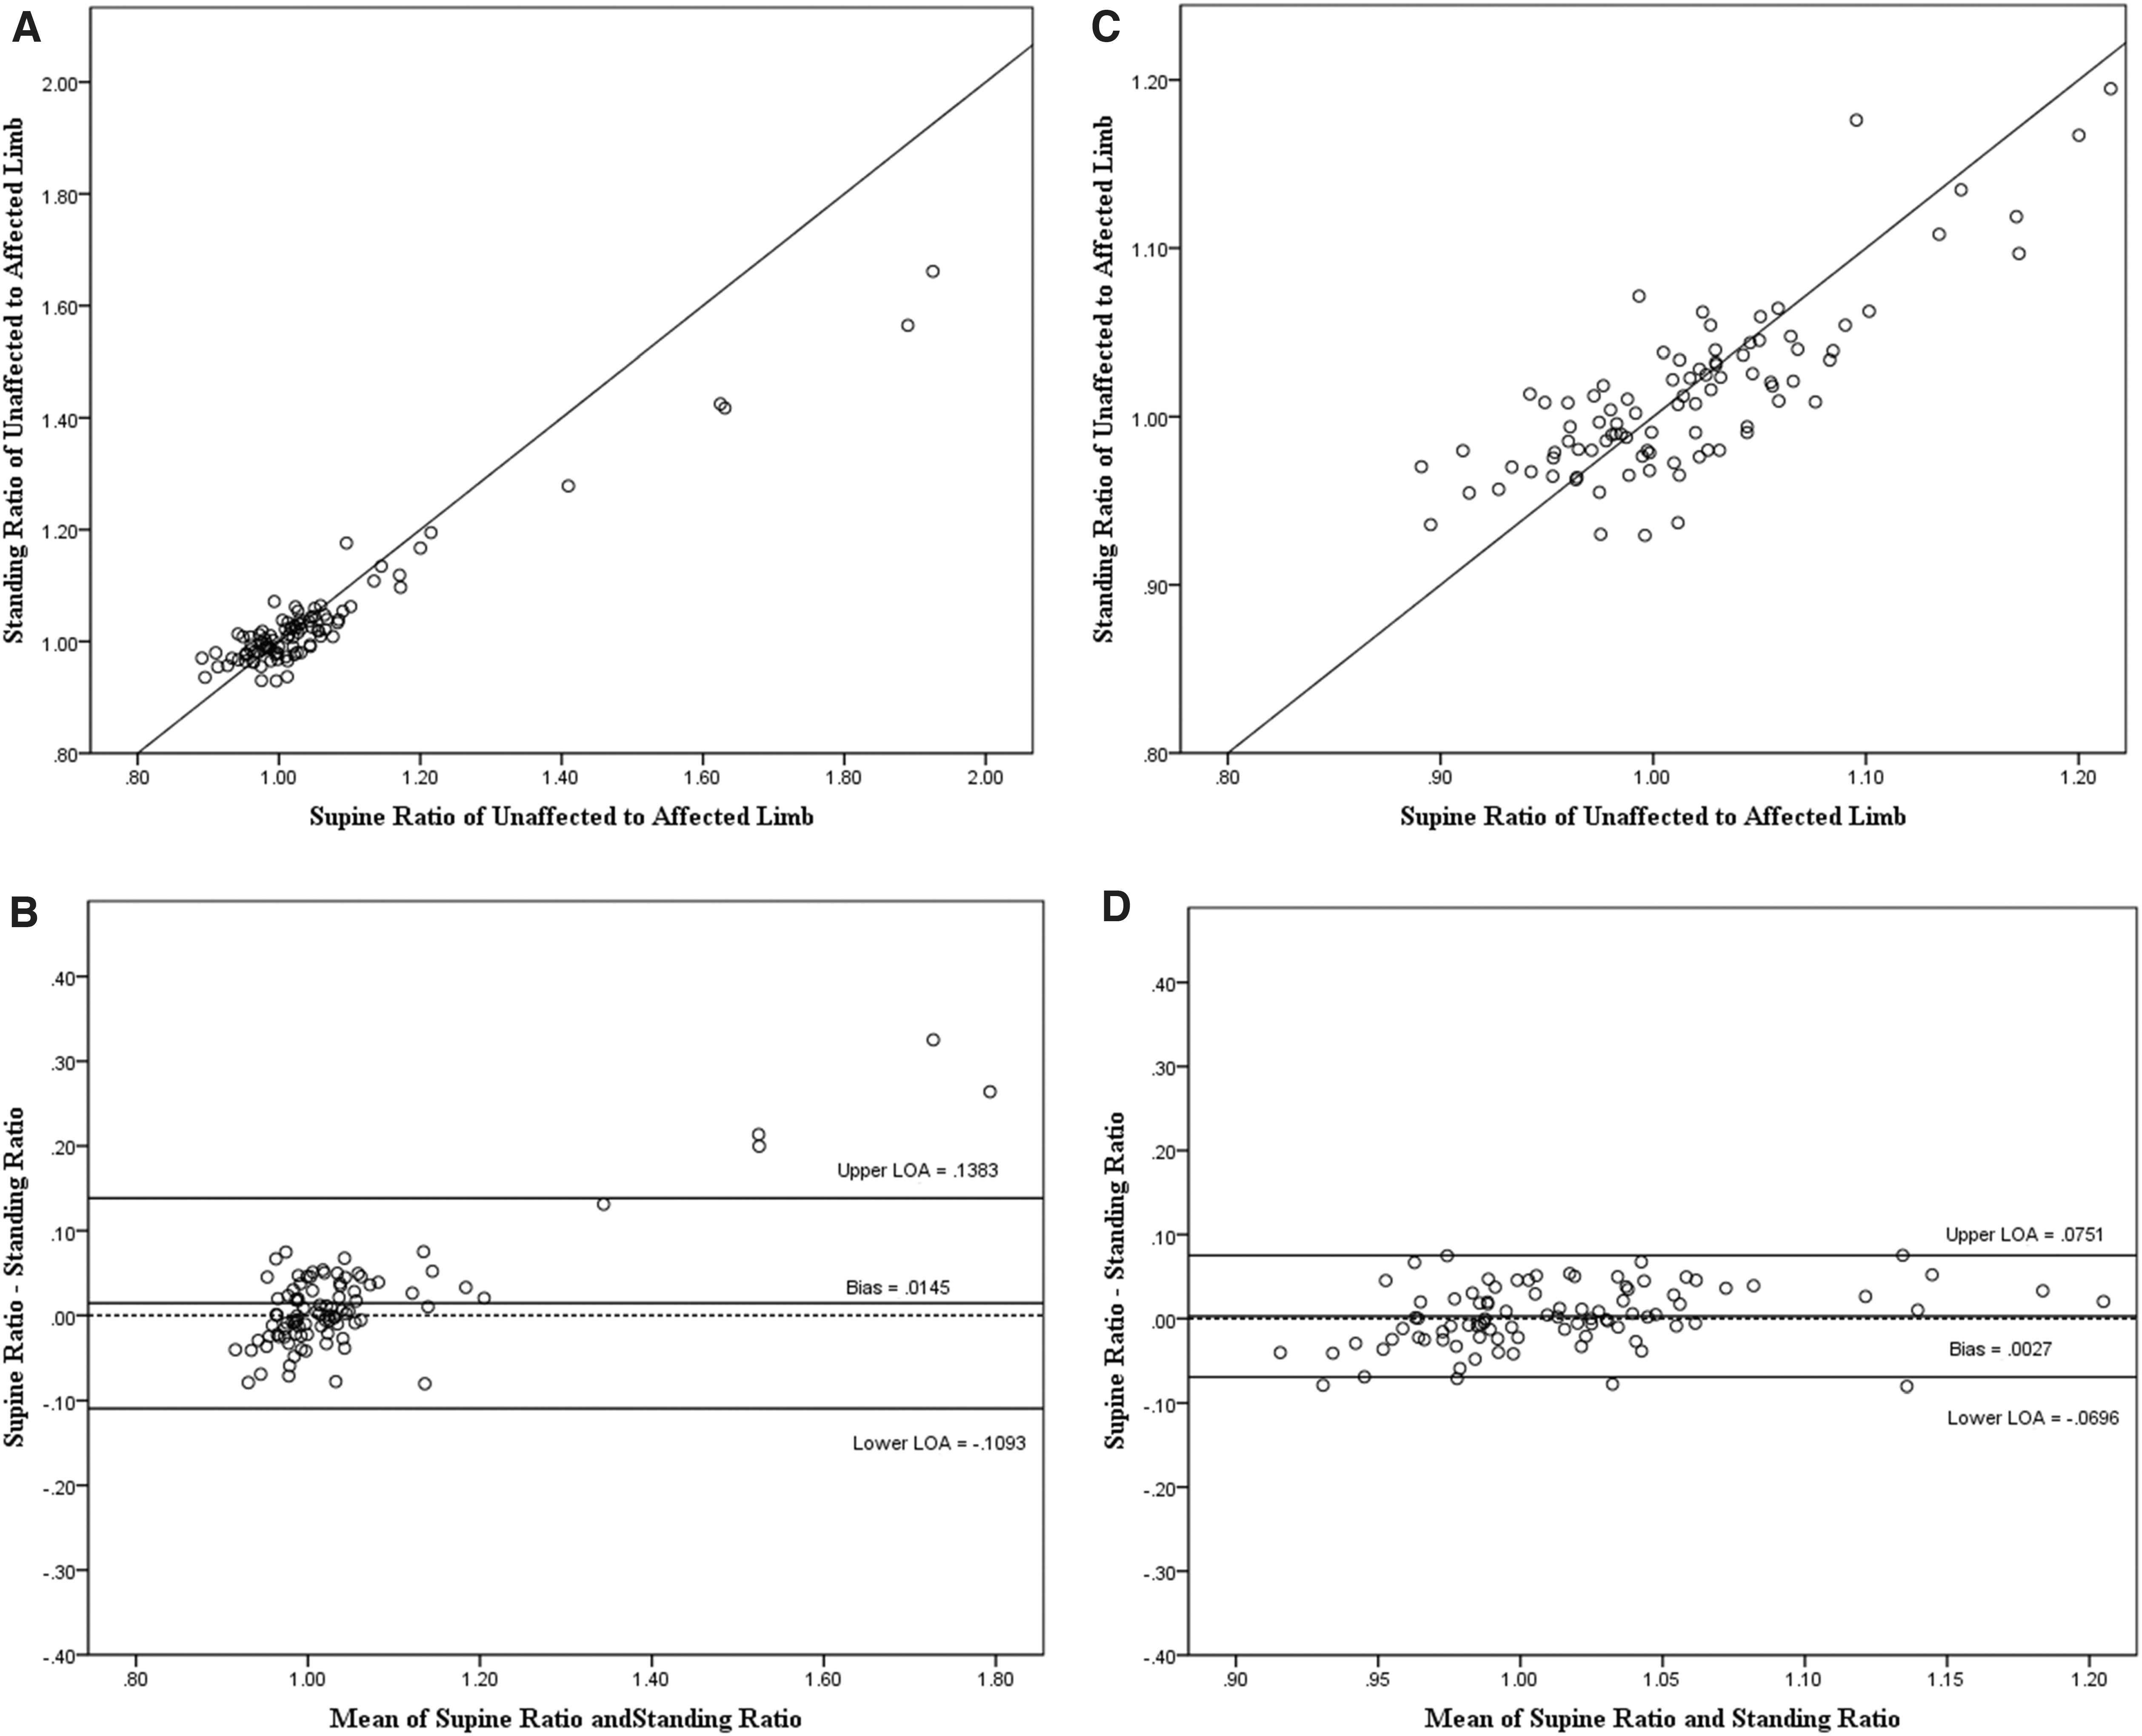
The Bland–Altman plot (Fig. 1B) shows the distribution of the difference scores for the entire sample around the line of equality. The bias (difference) of 0.0145 (±0.0632) was significantly different from 0 (p = 0.0270) and had a fairly wide LOA (95% LOA: −0.1093 to 0.1383).
Discrepancy between the two methods is seen primarily for impedance ratios of >1.20. Since a ratio of >1.20 is a clear indication of LE, the two methods were re-evaluated excluding the survivors with ratios of >1.20. Five survivors had ratios of >1.20 recorded with both devices.
For the sample with ratios of ≤1.20 (n = 90), the average supine impedance ratio was 1.015 (±0.062) and the average standing impedance ratio was 1.013 (±0.051). As shown in Figure 1C, the impedance values for the two methods were highly correlated at r = 0.812 (p < 0.001). The revised Bland–Altman plot (Fig. 1D) shows the very small bias of .0027 (±0.0362), 95% CI −0.0048 to 0.0103, which was not statistically significantly different from 0 (p = 0.474), with a much narrower LOA (95% LOA: 0.0696–0.0751). Within this range, the discrepancy between the two methods is fairly constant around 0 (the line of equality) with a consistent degree of discrepancy at low, medium, and high values for the mean values of the two devices (Table 3).
Mean Difference and Limits of Agreement for Unaffected/Affected Impedance Ratios
Bias = mean 1 − mean 2.
CI, confidence interval; LOAs, limits of agreement.
Agreement between devices in classifying cases of LE using established thresholds
Classification of LE (YES) versus non-LE (NO) cases, for the two devices (supine/stand-on) using Cornish et al.'s thresholds 9 resulted in 96% agreement, with a kappa coefficient of 0.809. Eighty-one survivors were classified as NO/NO and 10 were classified as YES/YES. Three of the 95 survivors were classified as YES using the supine impedance ratio and NO using the standing impedance ratio. One participant was classified as NO using the supine impedance ratio and YES using the standing impedance ratio (Table 4).
Percent Agreement Comparing Impedance Ratios for the Supine Device with the Stand-on Device to Determine Lymphedema Cases Using Cornish Thresholds for Both Devices
Agreement between devices in classifying cases of LE using alternative thresholds
Classification of LE (YES) versus non-LE (NO) cases using Cornish et al.'s thresholds 9 for the supine device and the Jung et al.'s optimal thresholds 17 for the stand-on device resulted in 95% agreement, with a kappa coefficient of 0.808. Seventy-seven survivors were classified as NO/NO and 13 were classified as YES/YES. In addition, using Cornish et al.'s thresholds 9 for the supine device and the Lim et al.'s cutpoint of 1.04718 for LE classification for the stand-on device, 73 survivors were classified as NO/NO and 11 were YES/YES, an agreement of 88%, with a kappa coefficient of 0.600.
Discussion
This study is among the first to evaluate levels of agreement between a conventional supine bioimpedance device and a newer stand-on bioimpedance device, for the assessment of upper limb LE, in terms of absolute impedance values and impedance ratios in women with and without self-reported LE. Consistent with a previous report, 16 on average, for both the unaffected and affected limbs, the absolute impedance values measured at 50 kHz were significantly higher for the stand-on device compared with the supine device for both women with and without a history of LE. Systematic differences in absolute impedance values may be related to differences in fluid distribution associated with supine versus standing positions; differences in the size of the regions evaluated (i.e., standing MF-BIA includes the shoulder); and/or inherent differences in the instrumentation and estimation of impedance.
While our absolute impedance values were significantly higher for the stand-on device than for the supine device, the average impedance ratios (i.e., unaffected/affected limb), were statistically significantly smaller for the stand-on device for the entire sample and for the LE group. No difference was found in impedance ratios for our women without LE. These findings are partially consistent with those of Koelmeyer at al. 16 who found no differences in overall impedance ratios between devices. However, in separate paired comparisons between devices, small but significant differences in impedance ratios were found for the control and LE groups. For their LE group (that included women with and at risk for LE), the stand-on device's impedance values were 1.6% smaller (p < 0.001) than the supine device's values.
Our mean impedance ratios for the stand-on device were 1.11 and 1.00 for the women with and without LE, respectively. Group assignment was based on self-reported history of LE. Twenty-one of the 34 survivors in the Hx of LE group did have impedance ratios that met the Cornish criteria. One of the survivors in the NO Hx of LE group did have a ratio within the diagnostic parameters. However, the mean ratios in this study are similar to the findings of Lim at al., 18 (LE 1.133; control 0.994) who used a similar stand-on device (i.e., InBody 720) to the one that was used in our study. Ratios calculated from data presented by Koelmeyer et al. using a different stand-on device, 16 were 1.101 for women who had or were at risk for LE and 1.043 for women in the control group. While the impedance values for the various stand-on devices are relatively consistent, these data suggest that in longitudinal studies of LE, the consistent use of one device is warranted to make valid comparisons.
While the correlation between the impedance values obtained using the two devices in our study was very high, this correlation provides limited information about the agreement between the impedance ratios. To evaluate agreement, the Bland–Altman analysis was used to calculate the mean differences in impedance ratios obtained using the two devices and to determine the LOA. The difference in impedance ratios between the two devices (bias) across the entire range of ratios was 0.0145, which was statistically significantly different from zero. This difference, and the width of the LOA, suggests that across a full range of ratios, the results from the two methods should not be used interchangeably. This conclusion is particularly true at the higher impedance ratios. On average, compared with the supine device, the stand-on device ratios were 0.0145 smaller. Our results suggest that for the most severe cases of LE (i.e., ratios of >1.20), the agreement between the two devices is lower. In the Bland–Altman plot, an increase in bias (the differences between measurements) occurs as the magnitude of the averaged measurement increases. This finding is consistent with previous reports25,26 that found an increase in measurement discrepancy at greater arm volumes. We concur with these authors, who noted that no clear explanation exists for why the discrepancy widens with increased ratios.
Of note, the Bland–Altman analysis that exclude the data from these five women resulted in reduced bias (0.0027), which was not statistically significantly different from zero. This finding suggests no difference in the impedance ratios obtained using the two devices. This very low bias, the consistency of the bias across this smaller range of ratios, and the very narrow LOA, suggest that for ratios of ≤1.20, the values obtained from the two devices can be used interchangeably in a limited capacity to evaluate for upper limb LE. For the purposes of surveillance and early detection of subclinical LE, in which the ratio would be expected to be <1.20, the simple, quick, and easily administered standing MF-BIA could be a very helpful addition in the clinic.
Agreement between the impedance values obtained using the two methods to identify cases of LE resulted in 96% agreement, using Cornish et al.'s established impedance ratios 9 to dichotomize cases. In the four instances of nonagreement, the ratios for these individuals were slightly on either side of the diagnostic threshold. For example, in one case, when the cutpoint of 1.066 was used; the supine ratio was 1.08 and the standing ratio was 1.04. When using Jung et al.'s ratios 17 for the stand-on device, the percent agreement was 95%. This finding suggests that the Cornish et al.'s ratios 9 can be used to dichotomize cases when the stand-on bioimpedance device is used. It is important to consider that differences in agreement when using different diagnostic thresholds for comparisons may not be due to the instrument being evaluated but to differences in the thresholds and in the methodology used to determine these thresholds. The establishment of accurate diagnostic thresholds for LE for the stand-on bioimpedance device is essential for accurate diagnosis, as well as for an evaluation of the efficacy of various interventions for LE. The kappa coefficient for both analyses was 0.81, which indicates strong agreement between the impedance ratios obtained from both devices to distinguish cases from noncases.
Limitations of this study warrant consideration. The published ratios used for categorization of cases versus noncases of LE were based on impedance data obtained using a supine BIS device at 0 kHz and a stand-on MF-BIA device at 5 kHz. However, we analyzed data obtained at 50 kHz, using the single-frequency supine device and the MF-BIA stand-on device. We chose 50 kHz to have equivalence across methods. Of note, in a study that compared supine SF-BIA and BIS for measuring ECF, LOA widened and bias increased as frequency increased, with less than 30 kHz showing the highest concordance. 27 Perhaps, if the single-frequency device used in the current study measured impedance at a lower kHz, our results may have been different. Limited information is available on the range of impedance values obtained using a stand-on device for healthy women and for women with LE. However, based on our findings of a strong agreement in women with a ratio of <1.20 and on percent agreement, this limitation had little overall impact on our conclusions. Another limitation is that we did not have data from a healthy control sample to use to compare our absolute values and impedance ratios. The group assignments were made based on self-reported history of LE and the majority of the survivors in the Hx of LE group did not meet diagnostic impedance ratio criteria at the time of testing. However, the mean ratios for the groups did reflect the criteria. Attention to group characteristics is necessary when comparing our results with those from other studies
In summary, correlations were high between the values obtained using the supine single-frequency lead-type device and the stand-on multifrequency device. Findings from the Bland–Altman analyses suggest satisfactory agreement between the two devices for impedance ratios at or below 1.20. Our findings suggest that the stand-on MF-BIA device can be a useful and valid tool to assess for LE. However, because agreement is not perfect, values obtained from the two devices should not be used interchangeably to evaluate for changes in impedance ratios, particularly for ratios of >1.20. Supine devices have demonstrated good validity and reliability for early detection of LE. However, the use of stand-on devices is gaining popularity and offers several advantages. For example, single-use electrodes are not needed and the device is easier to use, which may reduce cost and staff time to complete the assessments. The results of this study provide support for the use of a stand-on MF-BIA device to assess for LE.
Footnotes
Acknowledgments
Its contents are solely the responsibility of the authors and do not necessarily represent the official views of the NIH. Recruitment was facilitated by Dr. Susan Love Research Foundation's Army of Women® Program. Dr. Miaskowski is an American Cancer Society Clinical Research Professor.
Author Disclosure Statement
No competing financial interests exist.
Funding Information
This study was funded by a grant from the National Cancer Institute (NCI, CA187160). This project was supported by the National Center for Advancing Translational Sciences, National Institutes of Health, through UCSF-CTSI Grant Number UL1 TR000004.