
Abstract
Purpose:
The primary purpose of this study was to clarify the occurrence of sites of edematous changes using the measured circumferences of the thigh and lower leg via three-dimensional (3D) body scanning. The secondary purpose was to determine the relationship between the volume changes using 3D body scanning and the resistance changes as indicator of extracellular water (ECW) via segmental–bioelectrical impedance spectroscopy (S-BIS).
Methods and Results:
Fifteen healthy women participated. Limb circumferences were measured using 3D body scanning at 10% intervals between 50% and 80% in the thigh circumference and between 0% and 80% in the lower leg circumference. The resistance of the ECW component (RECW) and total body water (RTBW) was measured using S-BIS in the thigh and lower leg segments. These measurements were conducted at baseline and 6 hours postobservation. A paired t-test was conducted for the differences in these parameters, and the effect sizes (ESs) were calculated using Cohen's d. Correlations between changes in segmental volume and RECW were analyzed. Measurement-site circumferences and segmental volume significantly increased in the lower leg at postobservation but not in the thigh. The ES of circumference changes in the lower leg's central region were larger (ESs were 0.40–0.71 at 30%–50%) than in other regions. A significant correlation was observed between changes in segmental volume and RECW of the lower leg (ρ = −0.79, p < 0.001).
Conclusions:
Assessing the circumference using 3D body scanning, we found the edematous changes to be significant in the lower leg's central regions. Moreover, volumetry using 3D body scanning can detect edematous change in the lower leg.
Introduction
In previous studies, leg edema, heaviness, and pain were shown to be caused by prolonged sitting and standing, even in healthy participants.1,2 The leg edema was observed to increase over time with larger changes occurring in the lower leg than in the thigh, owing to gravity. 3 Accurate assessment concerning where and to what degree leg edema occurs may help in the development of optimal countermeasures for preventing edematous changes.
The most common method for measuring leg edema has been via circumference measurements using a tape measure. However, in cases such as pooling of fluid, due to gravity or cardiac insufficiency and occurring at the distal part of the lower leg, circumference measurements at the middle part of the lower leg may underestimate the actual extent of the edema, and measurement at the thigh may not be reliable for edema detection. Therefore, circumference measurements throughout the whole leg would be needed to detect leg edema. On the contrary, water plethysmography is the gold standard methodology, affording highly reliable leg volumetric assessments. 4
Over the past decade, many studies have used multifrequency segmental–bioelectrical impedance spectroscopy (S-BIS) to assess edema in healthy participants and patients having various diseases.5–9 S-BIS estimates the body water content and/or the changes in water distribution using impedance measurements that comprised two components (i.e., resistance and reactance) at multifrequency currents. In particular, the impedance at low-frequency currents mainly reflects the extracellular water (ECW) of plasma or interstitial fluid in extracellular space,10,11 and therefore, the resistance of ECW component (RECW) has been used as the assessment of edematous changes in patients with lymphedema.12,13 It is well known that body water, mainly plasma volume, is redistributed from upper to lower limb segments while standing because of gravity. 14 This causes an increase in intravascular pressure in the lower extremities, changing the pressure gradient for fluid filtration from the intravascular toward the extravascular space. Currently, assessment of edema using S-BIS has confirmed intra- and inter-rater reliability, and it is perceived as a viable alternative method to water plethysmography. 4 A recent study, 3 reporting on the edematous changes due to gravity on the whole body including the lower extremities, stated that changes in the whole body were observed after 6 hours from the baseline taken at 07.00, but in the lower extremities, changes were observed after just 2 hours. Therefore, in addition to being simple and convenient to measure, S-BIS is also useful for assessing the degree of edema in a specific region.
S-BIS can assess the edematous changes of intralimb small region. 15 As an alternative to S-BIS, three-dimensional (3D) body scanning based on the external human body shape has been applied for morphometry to measure the circumference, cross-sectional area, and volume at specific sites or regions. 16 Because the differences in the lower leg volumes measured using 3D body scanning and water plethysmography methods, respectively, were less than 1%, 17 3D body scanning has been validated as a quantitative method for assessing edematous changes. Therefore, this method is effective not only for identifying the site where edema occurs but also for measuring the degree of edema. To the best of our knowledge, there is no study that has clarified the sites within the thigh and lower leg in which edema occurs during the daily lives of healthy participants. In addition, the relationship between the volume changes in the thigh and lower leg using 3D body scanning and RECW changes using S-BIS remains unclear.
The primary purpose of this study was to clarify the occurrence of sites of edematous change in the thigh and lower leg. The secondary purpose was to determine the relationship between the volume and the ECW changes using two volumetry methods. We hypothesized that the common sites of edematous change were in the distal lower leg, not the thigh or the proximal lower leg. Furthermore, we hypothesized that the volume changes in the thigh and lower leg using 3D body scanning were associated with the RECW changes using S-BIS. These results may provide valuable information for the development of optimal countermeasures against leg edema.
Materials and Methods
Participants
Fifteen women participated in the study. They were eligible if they were healthy, did not use any medication, were able to refrain from vigorous exercise for 24 hours before our assessments, and were able to comply with all the study procedures. Participants were excluded if they had a history of surgery in the lower extremities, neuromuscular disorders, and cardiovascular or kidney disease. The sample size was calculated based on our preliminary data (n = 5), which evaluated the RECW values in the lower leg at the baseline and after 6 hours. Based on an effect size (ES) of 0.89 in the RECW between the baseline and after 6 hours with an alpha level of 0.05 and a beta level of 0.20, it was calculated that at least 12 participants were necessary. Considering the possibility of missing data and measurement variations, the study ultimately included 15 participants.
All study procedures were approved by the Ethics Committee of the Kyoto University Graduate School of Medicine (approval number: R2097) and were conducted in accordance with the principles of the Declaration of Helsinki. All participants provided written informed consent when enrolling into the study.
Experimental protocol
The day before the measurements were taken, participants were prohibited from vigorous exercise, excessive water intake, and any alcoholic drinks. On the day of the measurements, the participants awoke by 07:00 and came to the laboratory after their usual breakfast, and the quantity and type of breakfast was uncontrolled. The study defined the time point, after lying down in a supine position more than 20 minutes, as the preobservation (baseline) measurement; this was to minimize the effect of fluid redistribution after awaking. The baseline measurements were started between 9:00 and 10:00, first using BIS and then using 3D body scanning. Observation took place during the 6-hour period after the baseline measurements, with the postobservation measurements conducted between 15:00 and 16:00. The participants consumed a controlled lunch between 12:00 and 13:00 and were permitted to drink up to 500 mL of fluid (e.g., tea, juice, and coffee) during observation. The measurement and observation rooms were maintained at 23°C–24°C, and the participants were asked to continue their normal daily activities, such as primarily desk work and reading. Vigorous exercise was prohibited during the observation period.
Assessment of ECW using multifrequency S-BIS
Multifrequency S-BIS was applied after the participants had lain in a relaxed supine position for more than 10 minutes to study the immediate shift of body fluids. 18 S-BIS (SFB7; ImpediMed, Inc., Australia) with a logarithmic spectrum of 256 frequencies, ranging from 4 to 1000 kHz, was conducted on the right leg by using disposable clip-type electrodes (Red Dot TM; 3M, Inc., Japan). Two injection electrodes were placed on the dorsal surfaces of the right hand and forefoot, and sensing electrodes were placed on the right anterior superior iliac spine, the lateral knee articular condyles, and the midpoint of the ankle joint. To assess the bioelectrical impedance of the thigh and lower leg separately, the measurement sites were defined as follows: thigh—between the anterior superior iliac spine and the lateral knee articular condyles; and lower leg—between the lateral knee articular condyles and the midpoint of the ankle joint.19,20 The bioelectrical impedance measurements were repeated three times consecutively, and the average value used for analysis. The acquisition, storage, and analysis of the data were conducted using the SFB7 Bioimp software application (ImpediMed, Inc.). The RECW at 0 kHz and the resistance of total body water (TBW) at infinity kHz (RTBW) were obtained from the Cole model using analytic software. The rate of RECW and RTBW change (%) after 6 hours from the baseline was calculated, and indicated a reduction of RECW and RTBW due to edematous changes. 3 As the index of the relative change of ECW against TBW, the RTBW/RECW ratio was also calculated at baseline and after 6 hours. The mean values obtained from the three measurements were determined for subsequent analysis. The coefficient of variations (CVs) for the thigh and lower leg were 0.12 and 0.08 in RECW, and 0.16 and 0.15 in RTBW, respectively. When confirming the RECW and RTBW values at 10 and 15 minutes after lying in a supine position, the CVs between the replicate measurements for the thigh and lower leg were 0.83 and 0.84 in RECW, and 0.73 and 0.65 in RTBW, respectively.
Assessment of circumference and segment volume using 3D body scanning
Following the S-BIS measurements, 3D body scanning was performed on the participants to assess the circumference and segmental volume in each thigh and lower leg. A 3D body scanner (Body line Scanner C9036; Hamamatsu Photonics K.K., Japan) with optical triangulation was used to obtain the free-form 3D data in the form of a point cloud with 1,204,000 plots by moving the scan heads with near infrared light vertically. 21 Whole-body scanning using this equipment requires ∼6 seconds with a resolution in the vertical direction of 2.5 mm and in the horizontal direction of 1.0 mm.
Participants were marked to distinguish the measurement sites of the circumference and segmental volume in each thigh and lower leg. The 3D body scanning measurements were conducted in a single standing position (e.g., on the right leg with the left leg on a box). Participants were asked to maintain an upright single-leg standing position with their arms on the equipment frame during the scanning process (Fig. 1). After the free-form 3D data were acquired, segmentation and smoothing were done using 3D modeling software (Rhinoceros 5.0; Robert McNeel & Associates). The thigh segment was aligned in the 3D model based on four landmarks and defined as the length between the greater trochanter and the lateral epicondyle of the femur. The lower leg segment was aligned based on four landmarks and defined as the length between the fibula head and the lateral malleolus of the fibula (Fig. 2). The circumferences around the knee and ankle joint (at 90% and 100% circumferences) were excluded from the analysis to study only the changes in the muscles and tendons caused by standing. Consequently, the circumferences (cm) were measured at 10% intervals between 50% and 80% in the thigh and between 0% and 80% in the lower leg. In addition, a cylinder-like body shape in the same region was constructed and its segmental volume (cm3) calculated for the thigh and lower leg, separately. The test/retest CVs for the circumferences and segmental volumes measured at the baseline and after several minutes were 0.10%–0.59%.
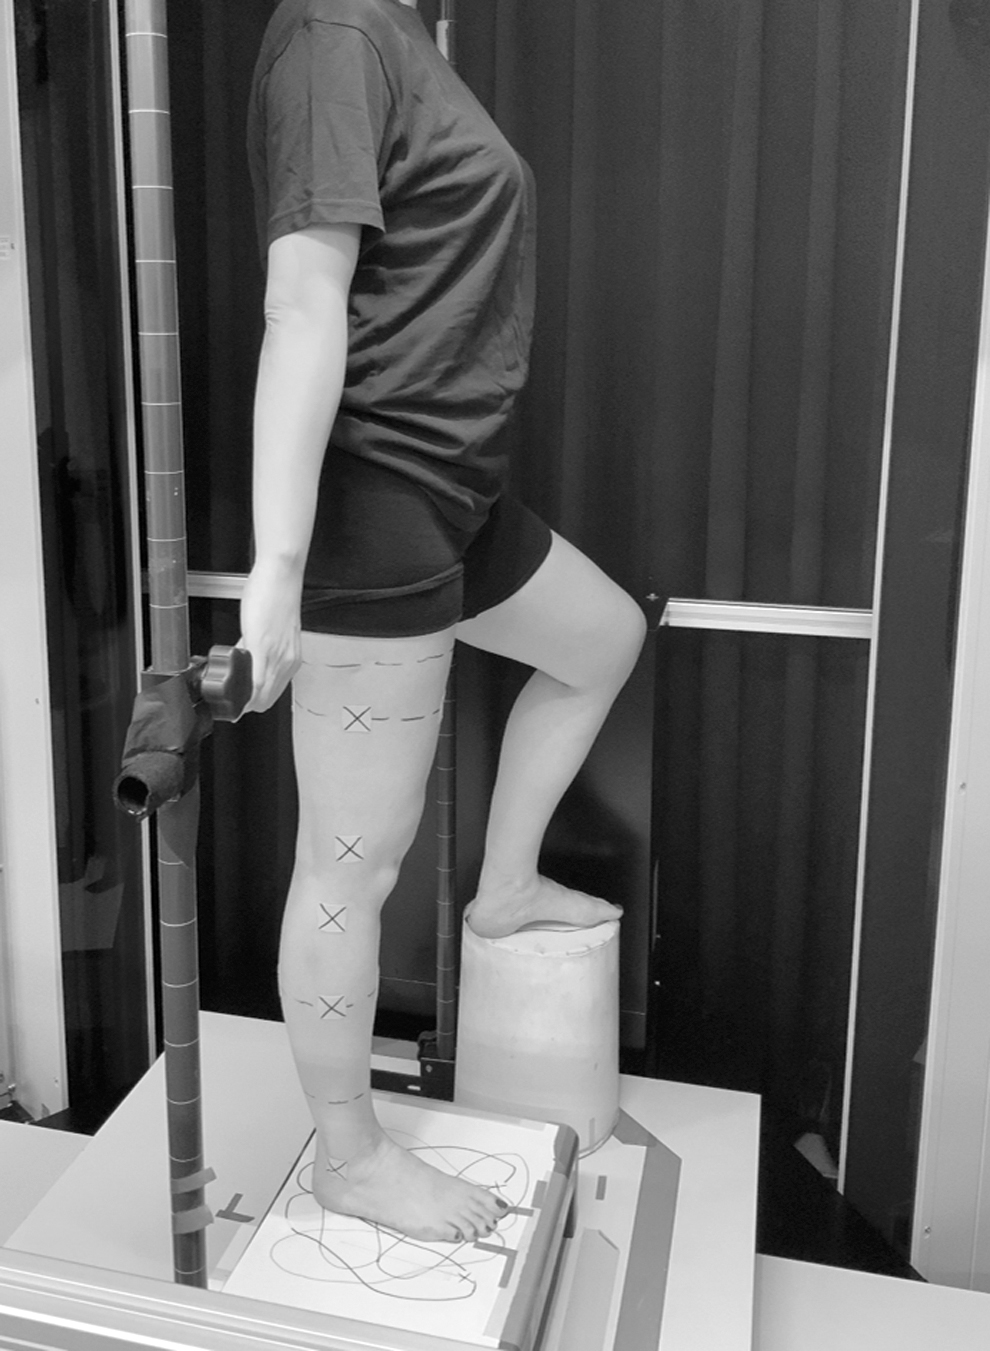
Measurement posture during 3D body scanning. Participant kept an upright single-leg posture, standing on the right leg while gripping the frame during scanning. 3D, three dimensional.
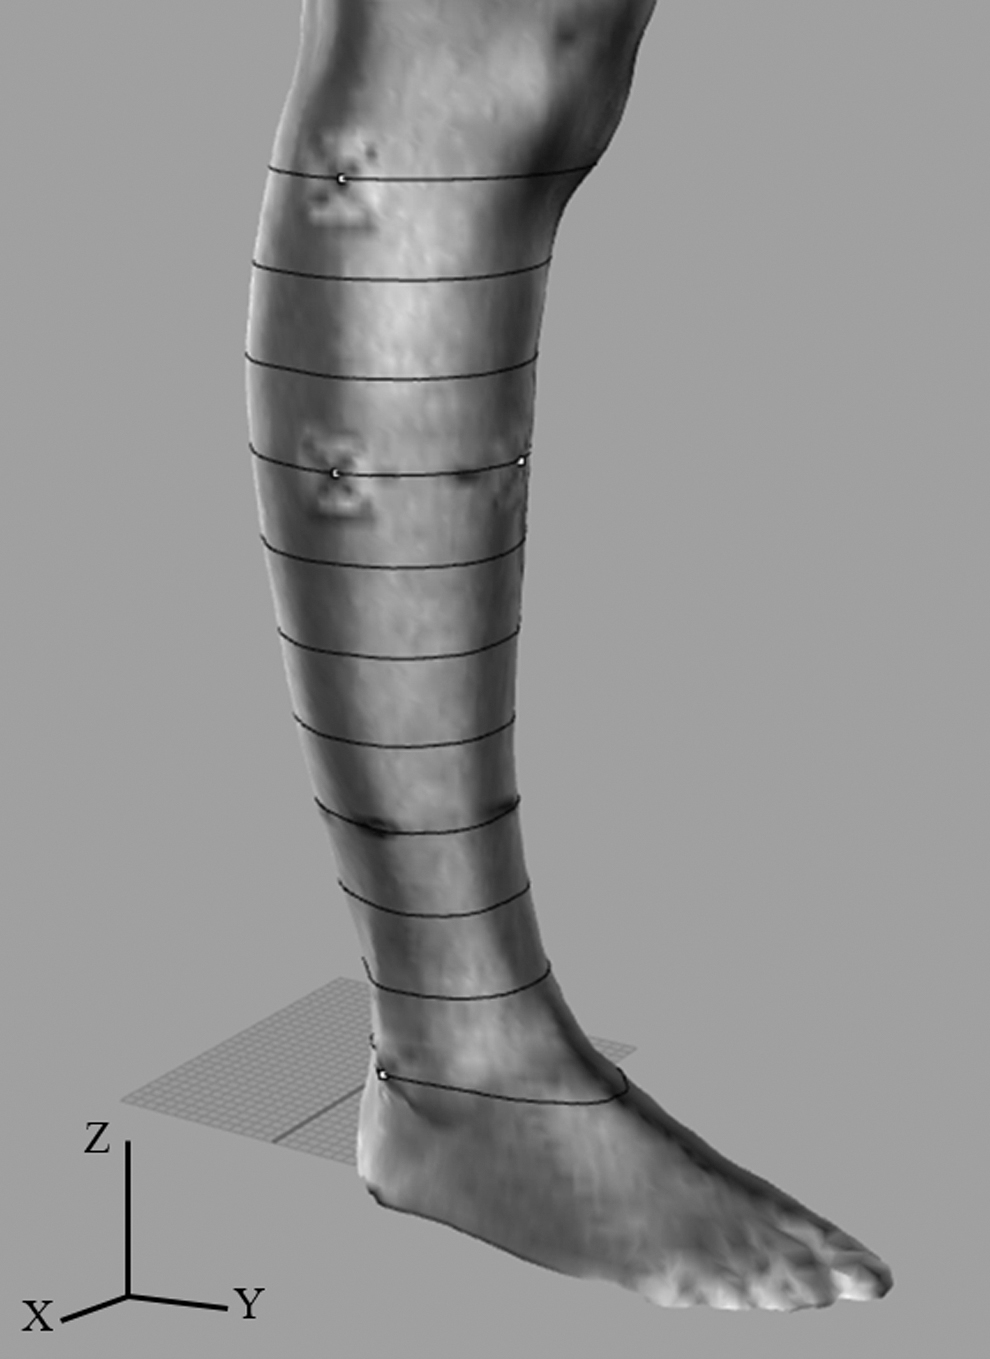
Three-dimensional segmentation and measurement intervals of the lower leg. After the segmentation and smoothing process using 3D modeling software, the lower leg segment was set as the length between the fibula head (at 0%) and the lateral malleolus of the fibula (at 100%). Circumferences (cm) of the lower leg were measured at 10% intervals between 0% and 80%, and the segmental volume (cm3) in same region was calculated.
Statistical analyses
All values are expressed as mean ± standard deviation. All variables were confirmed to be distributed normally using the Kolmogorov–Smirnov test. A paired t-test was conducted for differences in the RECW, RTBW, RTBW/RECW ratio, segmental volume, and circumferences of the thigh and lower leg between the baseline and the postobservation. The ES of these parameters was calculated using Cohen's d. Correlations between the changes in the RECW, RTBW, and segmental volume in the thigh and lower leg were analyzed using the Spearman rank correlation coefficient. All statistical analyses were performed using SPSS software (version 25.0; SPSS Japan, Inc., Japan). The level of significance was set at p < 0.05.
Results
Participants in this study were of mean age, 48.1 ± 7.1 years; height, 156.6 ± 3.7 cm; body weight, 51.3 ± 4.9 kg; and body mass index, 20.9 ± 1.8 kg/m2. The changes in the RECW, RTBW, RTBW/RECW ratio and segmental volume in the thigh and lower leg, from the baseline to postobservation, are shown in Table 1. The RECW and RTBW values for both the thigh and lower leg significantly decreased at postobservation compared with the baseline values, especially the % change and ES of RECW in the lower leg that were larger than that in the thigh. The RTBW/RECW ratio in both the thigh and lower leg also significantly decreased at postobservation compared with the baseline values. On the contrary, a significant increase in the segmental volume in the lower leg at postobservation was observed compared with the baseline values, but no significant difference in the thigh was observed (Table 1). The changes for all measurement sites on the thigh segment, in terms of the results of changes in circumference, between the baseline and postobservation were of no statistical significance (Table 2). By contrast, the circumferences for all measurement sites on the lower leg segment significantly increased at postobservation compared with the baseline values. The ES of the circumference changes in the central region of the lower leg was larger (ESs were 0.40–0.71 at 30%–50%) than in the proximal and distal regions (Table 3). Moreover, the result of the correlation between the segmental volume and the RECW showed that the change in segmental volume correlated well with the change in the RECW in the lower leg (ρ = −0.79, p < 0.001). By contrast, there was no significant correlation between the segmental volume and the RECW in the thigh (ρ = 0.16, p = 0.564).
Changes in the RECW, RTBW, RTBW/RECW Ratio and Segmental Volume Between Baseline and After 6 Hours
CI, confidence interval; ES, effect size; RECW, resistance of the extracellular water; RTBW, resistance of the total body water.
Circumference Changes in the Thigh Between the Baseline and Postobservation
Circumference Changes in the Lower Leg Between the Baseline and Postobservation
Discussion
To the best of our knowledge, this is the first study to verify the occurrence sites of edematous change in the lower leg and the relationship between segmental volume changes, measured using 3D body scanning, and the RECW and RTBW changes measured using S-BIS. In agreement with a previous report, 3 this study also observed decreases in the RECW and RTBW in the thigh and lower leg. In addition, this study showed that the RTBW/RECW ratios in both the thigh and lower leg at postobservation significantly decreased compared with those at the baseline values, that is, the relative increase of ECW against TBW was confirmed. By contrast, an increase in the segmental volume was only confirmed in the lower leg. Similarly, the circumferences significantly increased at all the measurement sites on the lower leg segment, but not on the thigh. Of the measurement sites whose circumferences increased, the changes were larger in the central region than in the proximal and distal regions of the lower leg, contradicting our hypothesis. Furthermore, changes in the segmental volume in the lower leg, observed using 3D body scanning, were associated with the RECW and RTBW changes that were observed using S-BIS. These findings suggest that the circumference assessment in the central region on the lower leg is reflected more accurately for edematous changes, and change in the segmental volume on the lower leg using 3D body scanning can also detect water retention due to gravity.
Assessment of the ECW using S-BIS can estimate water distribution between intracellular and extracellular from the bioelectrical impedance. Although the RTBW in both the thigh and the lower leg also decreased as well as the RECW after the 6-hour observation in this study, interestingly, the RTBW/RECW ratios at postobservation were lower compared with the baseline. Thus, these results suggested that the relative increases of ECW against TBW were due to gravity. These edematous changes were confirmed in both the thigh and lower leg, whereas the circumferences obtained using 3D body scanning only increased in the lower leg. This means that volumetry, using 3D body scanning, cannot capture edematous changes unless morphological increases occur. Therefore, these findings suggest that S-BIS was accurate for edema evaluation without changes in circumference. We know that the distribution of body water is affected by posture. Hence, prolonged standing induces water variation from the trunk to the lower limbs. In fact, a previous report that investigated the changes in extracellular resistance of the trunk and lower extremities using S-BIS 3 showed that the ECW in the trunk exhibited no change or decreased slightly, whereas in the lower limbs, the ECW continued to increase. Edematous change occurs because of the high venous pressure in the peripheral vessel, owing to the gravity-induced water distribution. Although increases in the ECW in the thigh and lower leg were confirmed in our study, the degree of increase was larger in the lower leg than in the thigh.
Interestingly, edematous changes due to gravity were significant in the central regions of the lower leg, indicating that the ES of the circumference changes at 30%–50% was moderate to large. As a previous study has reported that S-BIS can be used locally in the arm of patients with lymphedema, 15 it may be better to conduct S-BIS in the middle of the lower leg when measuring leg edema in healthy individuals. Muscle pump action should function easily, because the central regions of the lower leg have a large cross-sectional area of the triceps surae muscle. 22 As such, we assumed that edematous changes were larger in the distal of the lower leg owing to gravity. However, because the blood circulation in skeletal muscle depends on muscle activity, 23 inactive and low physical activity results in poor muscle pump action and increasing capillary pressure. Because skeletal muscle has a large quantity of water (including blood), edema may be likely to occur in regions having more muscle mass as the result of the accumulation of intracellular water (i.e., muscle cell mass) and/or interstitial fluid extravasated from the veins. However, participants in the current study were limited to healthy women, and cases of excessive increases in ECW, such as lymphedema and patients with heart failure,5,6 could have had more edematous changes at the distal lower leg, thereby suggesting that our findings need cautious generalization.
Moreover, the change in the segmental volume in the lower leg using 3D body scanning correlated strongly with the RECW change using S-BIS. To the best of our knowledge, there has been no study that has determined an association between the changes measured using 3D body scanning and S-BIS. A previous study reported that measurement error between 3D body scanning and water plethysmography was less than 1%, exhibiting high validity. 17 When we assumed that the volume change using 3D scanning in this study showed the same degree of change using water plethysmography, the significant correlation between 3D body scanning and S-BIS was a natural consequence. However, because this association was not confirmed in the thigh segment, it was limited to the case when a significant volume change occurred that could be measured using 3D body scanning. This discussion was supported by a previous study examining the relationship between BIS and perometry measurements in the arm in patients with lymphedema, 24 and BIS was more sensitive to the localized edema than perometry.
This study has several limitations. First, the segmental volumes calculated from the 3D measurements did not correspond to those defined for BIS measurements. Although this study defined and used the segment volume measured by 3D body scanning in the largest interval that was not easily affected by skin exposure and muscle contraction, the assessment of segment volume in the thigh was limited to a small area. Hence, care needs to be taken on generalizing the results of correlations between the changes in the R and the segmental volume. Second, the participants in the present study were limited to healthy women. Gender differences of edema occurrence may exist, because the lower leg muscle mass in men is relatively larger than that of women. Also, in patients with marked tissue swelling such as lymphedema, the relationship between volume changes from 3D body scanning and BIS is unclear. Finally, although diet intake and physical activity were controlled between all participants, the observation was conducted only once per participant. The interday variability in lower leg volume measured by water plethysmography, even when not controlling the total diet intake and physical activity, was small. 25 Thus, the results in the present study could reflect a typical day in an individual's edematous change. Therefore, future studies are needed to clarify the interdays, gender differences, and disease-specific changes for edema.
Conclusion
In summary, the present study showed that edematous changes measured using S-BIS were confirmed in both the thigh and the lower leg, whereas the circumferences obtained using 3D body scanning only increased in the lower leg. Assessing the circumferences, we found the edematous changes to be significant in the lower leg's central regions. Moreover, the volume change in the lower leg using 3D body scanning correlated with the RECW change using S-BIS, but not in the thigh. Therefore, the utilization of 3D body scanning may be useful as the alternative method of S-BIS to assess edematous changes of the lower leg in healthy individuals.
Footnotes
Acknowledgments
The authors thank all the individuals who participated in the study.
Author Disclosure Statement
No competing financial interests exist.
Funding Information
The present study is funded by endowments from WACOAL CORP to Kyoto University.