
Abstract
Background:
There are multiple methods to quantitatively assess limb lymphedema, but quantitative methods to assess external lymphedema in persons with head-and-neck lymphedema are quite limited. Quantification in this difficult condition currently uses multiple time-consuming head, face, and neck metric measurements, the accuracy of which is unclear. Thus, there is an important need for a new approach that is sufficiently convenient yet accurate to quantify head-and-neck lymphedema. The approach adopted was to use tissue dielectric constant (TDC) measurements that depend on tissue water, at neck and a submental area, and normalize these to TDC values at the forearm as a way to develop subject-independent indices.
Methods and Results:
TDC was measured in 60 self-reported healthy nonlymphedematous adults (34 female, 18–81 years, 18.5–45.7 Kg/m2) at two neck sites and one arm site bilaterally and at a submental area. Neck-to-arm-index (NAI) and submental-to-arm-index (SAI) ratios were calculated. TDC values (mean ± standard deviation [SD]) for neck, submental, and arm were, respectively, 37.4 ± 6.9, 35.9 ± 7.7, and 30.1 ± 4.6. Mean NAI and SAI values were 1.253 ± 0.222 and 1.214 ± 0.296 respectively. Head-and-neck lymphedema thresholds calculated as mean + 2.5 SD were for NAI and SAI 1.80 and 1.95, respectively.
Conclusions:
An approach to help quantify and track head-and-neck lymphedema using TDC neck and/or submental values normalized to a person's forearm TDC values indicates threshold values between 1.80 and 1.95. These ratios, denoted as NAI and SAI, are suggested for use to detect and track changes in lymphedema status based on a patient's changing indices associated with lymphedema treatment.
Introduction
Lymphedema is typically associated with lymphatic drainage complications of the extremities. 1 A review of 47 studies found that the incidence of lymphedema secondary to cancer, excluding breast cancer, is 15.5% overall, occurring after treatment of gynecologic, genitourinary, sarcoma, and head-and-neck cancers. 2
Head-and-neck cancers affecting the oral cavity, pharynx, larynx, paranasal sinuses, nasal cavity, or salivary glands occur with alcohol consumption and tobacco usage, the largest risk factors. 3 Prevalence favors males (70%), with 95% in persons older than the age 40. 4 One study of 81 head-and-neck cancer patients found that 75.3% had secondary cancer-related lymphedema, whether internal (39.4%), external (9.8%), or both (50.8%). 5 Another recent study 6 found that among 62 patients treated for head-and-neck cancer with chemotherapy or postoperative radiotherapy, 35% experienced both internal and external lymphedema. Head-and-neck lymphedema can affect a patient's quality of life in multiple ways by causing swallowing difficulties, weight loss, altered nutrition, facial disfigurement, disturbed body image, decreased cervical range of motion, and dysphagia.7–9 Treatments include manual lymphatic drainage, 10 liposuction, 11 and pneumatic compression,12–14 which have had varying degrees of success.
Factors such as lymphatic architecture, 15 tumor location, and timing of treatment 16 may influence the occurrence of lymphedema in head-and-neck cancer patients, with no single assessment scale found to be fully suitable to capture important aspects. 17 Face and neck tape measurements have been used to measure head-and-neck lymphedema 18 and aspects of reliability recently reported. 19 Other assessments of head-and-neck lymphedema include palpation, visual inspection, and patient self-reports. 20 However, as useful as these measurement methods may be, they present certain disadvantages. Tape measurements may not be applicable to the general population due to their high variability from patient to patient and difficulty of application and interpretation. Palpation techniques, visual inspection, and patient self-reports are useful but may still not be quantitative or be able to provide early indications of subclinical lymphedema.
The goal of this research was to consider the potential use of tissue dielectric constant (TDC) measurements to aid in the processes of head-and-neck lymphedema detection and tracking. TDC values are dependent on the amount of tissue water within the measured volume 21 and have be successfully used to assess upper extremity22–24 and lower extremity25,26 lymphedema. As a first step in evaluating TDC use for head-and-neck lymphedema, the specific aim was to determine the potential suitability of using standardized neck-to-arm TDC ratios as a method to characterize and track head-and-neck lymphedema in a manner similar to the use of ankle-brachial systolic pressure index to detect and track lower extremity vascular disease. In addition, we sought to explore the relationship with person's age and body mass index (BMI). For this purpose, the present work focused on characterizing these ratios in a wide age-range group of otherwise healthy participants to help develop reference values for potential subsequent use when evaluating persons with suspected lymphedema or to monitor change in head-and-neck lymphedema associated with time or treatment.
Methods
Subjects
Sixty volunteer subjects were recruited from medical students, staff, and others and evaluated during a single session after each subject signed a university-approved informed consent. Entry requirements were the absence of any abnormal skin condition or history of head-and-neck or arm lymphedema. Persons with diabetes or implanted wires or devices were excluded. Subjects' ages ranged from 18 to 83 years with a mean ± standard deviation (SD) of 39.0 ± 18.0 years. Average BMI ranged from 18.5 to 45.7 Kg/m2 (25.7 ± 5.3 Kg/m2). Thirty-four of the subjects were female (age 40.2 ± 17.6 years, BMI 25.0 ± 5.0 Kg/m2) and 26 were male (age 37.4 ± 18.6 years, BMI 26.6 ± 5.5 Kg/m2). There was no statistically significant difference in age or BMI between genders (t-test, p > 0.25).
No subject reported a history of facial, neck, or arm edema or lymphedema, or had any condition, or was taking any medication that affects tissue water content. Before any measurement, subjects signed an informed consent that was priorly approved by the University Institutional Review Board (2019-595-NSU). Measurements were done with subjects seated and fully clothed. This study was registered with ClinicalTrials.org with the given registration no. NCT04457375 06/30/2020.
Measurement device
TDC measurements were done with a handheld compact device (Delfin Technologies, Kuopio, Finland). This device is similar to a compact device used previously. 27 TDC values are largely dependent on the amount of skin water within the measured local volume. The effective measurement depth is between 2.0 and 2.5 mm thereby including the epidermis and dermis in its measurement volume. The device functions as an open-ended transmission line28–30 in which a low-level 300 MHz signal is transmitted when in contact with skin for about 5 seconds. The reflected component is used to determine TDC values that are displayed as percentage water, but for consistency, herein reported as the actually measured TDC value (also referred to as tissue permittivity). As described subsequently, TDC measurements were done on both forearms, both sides of the neck, and in the submental area.
Measurement sites
TDC was measured bilaterally at two neck locations (N1 and N2) on each side and at the submental region (M1), as shown in Figure 1, and on one arm location on the right arm (AR) and on the left forearm (AL) (not shown). Measurements on the right neck are designated as N1R and N2R and on the left side of the neck as N1L and N2L. All TDC measurements at these sites were done in triplicate and the average used. The order of measurements for the first triplicate set of TDC measurements was N1R to N2R to AR to N1L to N2L to AL with the final measurement of set 1 at M1. This sequence was done three times to achieve the triplicate measurement set. Neck measurement sites (N1 and N2) were determined using the following procedure, as illustrated in Figure 1. A
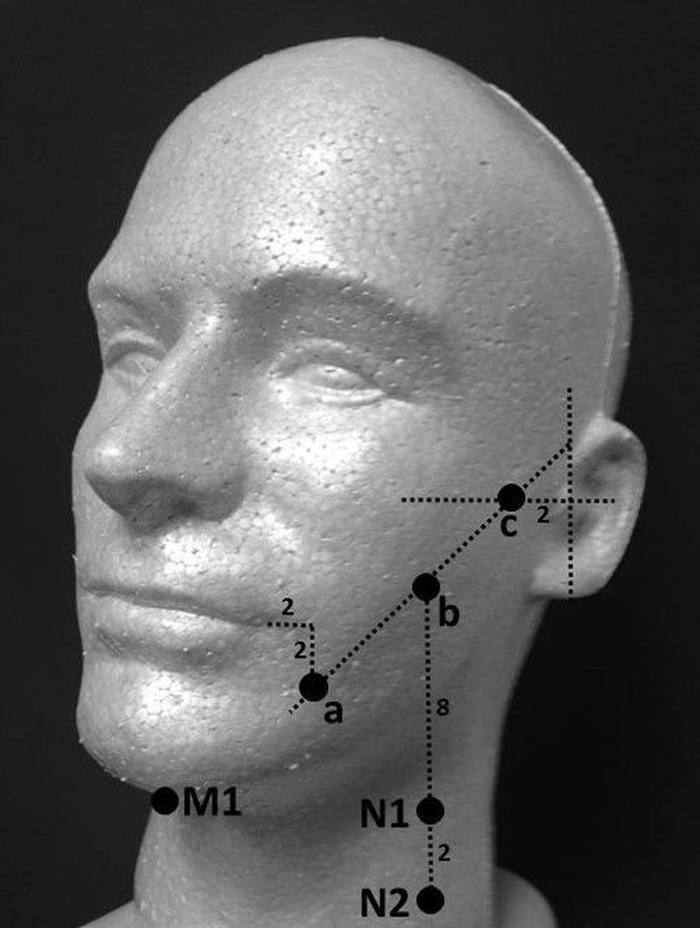
TDC measurement locations on neck and submental area. TDC was measured bilaterally at two neck locations (N1 and N2) on each side and at the submental region (M1). Neck measurement sites were determined as follows. Point a was 2 cm anterior to the midline of the tragus, and point c was 2 cm lateral and inferior to the commissure of the mouth. Point b was halfway between points a and c. N1 and N2 were 8 and 10 cm inferior to point b. M1 was at the submental area of the chin. TDC, tissue dielectric constant.
Analysis
Measured TDC values at the neck, submental area, and forearm were assessed for normality using the Shapiro–Wilk test. Normality could not be rejected in accordance with significance values ranging from 0.278 for neck to 0.617 for submental area. Contrastingly, for calculated neck/arm and submental/arm ratios, Shapiro–Wilk tests indicated normality to be rejected at significance levels ranging from 0.001 for submental ratios to 0.003 for neck/arm ratios. Consequently, comparisons of TDC values between sites or sides were based on t-tests, and comparisons of calculated ratios were based on the nonparametric Wilcoxon test.
To determine an overall neck/arm TDC ratio to be used as a normal reference, the four neck/arm ratios per subject were included yielding a total of 240 measurements, in which each included measurement was the average of triplicates. For convenience, the neck/arm TDC ratio is henceforth denoted as NAI (neck-to-arm index). A similar approach was used for the submental/arm TDC ratio, but the total number of measurements was 120. For convenience, the submental/arm TDC ratio is henceforth denoted as SAI (submental-to-arm index).
Additional analyses were done to test for differences in TDC values between neck sites N1 and N2 on the same side and between sides and to determine if the NAI differed if N1 versus N2 was used in the numerator. This was done by comparing N1/A with N2/A on each side, with a p-value <0.05 accepted as evidence of a statistically significant difference. Right-side ratios (N1R/AR vs. N2R/AR) were compared separately from left-side ratios (N1L/AL vs. N2L/AL). To determine the extent to which NAI differed between sides, the average of right-side ratios (NR/AR)AVG was compared with the average of left-side ratios (NL/AL)AVG. Finally, a single NAI value for each subject was determined by averaging the four separate ratios and denoted as NAIS. This subject average NAI was used to determine if there was a significant dependence of NAI on either subject age or BMI. This was done using regression analysis in which age and BMI were separately used as dependent variables.
Results
The overall NAI value (60 subjects, 240 measurements) was 1.253 ± 0.222 (mean ± SD) with a median value of 1.229. This ratio did not significantly differ between females and males (1.243 ± 0.194 vs. 1.266 ± 0.258, p = 0.697). There was no significant correlation between average NAI and subject age, but there was a weak but statistically significant inverse relationship between NAI and subject BMI (r = −0.329, p = 0.01). Absolute TDC values measured at the various anatomical sites totally and by gender are summarized in Table 1.
Tissue Dielectric Constant Absolute Values by Site and Gender
Table entries are tissue dielectric constant mean ± standard deviation values. p-Values are for differences between neck sites on the same side of the neck (N1 vs. N2). The subscripts L and R designate left and right sides. Average values for the neck are the average of four neck sites and the average for arms is the average of both arms. The asterisk (*) indicates that male values are greater than female values (p < 0.001), which was the case for all sites except the submental area.
The location of the neck site chosen (N1 or N2) affected the calculated value for NAI. For the right side, N1R/AR and N2R/AR ratios were 1.236 ± 0.239 versus 1.305 ± 0.262, p = 0.001 yielding an N2/N1 NAI ratio of 1.056. For the left side, N1L/AL and N2L/AL ratios were 1.216 ± 0.243 versus 1.266, p = 0.001 yielding an N2/N1 NAI ratio of 1.041. Thus, the NAI determined using N2 was greater than if N1 was used, with the difference being between 5.6% on the right side and 4.1% on the left side. However, the side selected for determining the ratio (right or left) did not significantly affect NAI. Thus, average right-side ratios (1.265 ± 0.224) did not significantly differ from left-side ratios (1.241 ± 0.239, p = 0.129).
Submental/arm ratios (SAI values) obtained using right and left arms were slightly but statistically different with values of 1.194 ± 0.290 versus 1.233 ± 0.309, p < 0.001, respectively. The overall average SAI value was 1.214 ± 0.296 and does not differ from NAI (p = 0.133). The median value of SAI was calculated to be 1.178. TDC values were greater for males than females (p < 0.01) at arm and neck sites, and TDC values on the left side were greater in most cases than on the right. TDC values measured at the neck, submental, and arm showed no significant correlation to either subject age or BMI.
Discussion
The specific aim of the present research was to provide a possible assessment parameter that would be useful to quantitatively assess initial lymphedema levels and their change with treatment. The proposed method uses TDC measurements of the neck or submental area and normalizes these values to the TDC values measured at a standard forearm site. These ratios, herein dubbed NAI and SAI, were assessed in nonlymphedematous persons to investigate their normal ranges and features for subsequent potential use in patients with undiagnosed or confirmed head-and-neck lymphedema.
The logic for using normalized TDC values for this purpose is several fold. Absolute TDC values importantly depend on tissue water and such measurements have proved useful in assessing and tracking limb lymphedema.25,26,31–33 Because subject-to-subject variations in TDC are likely, the use of a self-normalizing feature renders such variations less confounding in applying a threshold for lymphedema detection and for tracking changes. Since patients with head-and-neck lymphedema are not likely to have significant temporal variations in forearm TDC values, it seems that the defined lymphedema indices (NAI and SAI) would be useful for both detection and tracking purposes; characterizing these values and features was an important goal of the present research.
Discussion relevant to the main findings may be parsed into three categories: (1) reference ratios and ranges, (2) absolute values, and (3) study limitations.
Reference ratios
Overall values and ranges for NAI (1.253 ± 0.222) and SAI (1.213 ± 0.296) were similar to each other. For a lymphedema threshold to include 99.4% of cases, the threshold is its mean + 2.5 SD. Applying this criterion yields a threshold NAI of 1.808 and a threshold SAI of 1.953. As a practical matter, a ratio of 1.80 could be considered a threshold relevant to NAI and a value of 1.95 for SAI. Based on the present findings, these thresholds are not significantly dependent on subject gender or age and only weakly on subject BMI. However, since there was a small difference (4.1%–5.6%) in NAI dependent on which neck site was chosen (N1 or N2), it is suggested that initial application of this method to patients be based on NAI ratios determined from measurements at two neck sites, with the average of these two used to characterize the effective NAI.
Absolute values
Although absolute TDC values were not the main focus, it is useful to consider these since few TDC values for neck and submental area have been previously reported. A notable exception is the work of Purcell et al. 34 who raised the possibility of using TDC in head-and-neck lymphedema based on their measurements that showed a significant elevation in TDC in some patients with fully established head-and-neck lymphedema. In the present work, neck and arm TDC values were found to be greater for males than females. This finding is consistent with that previously reported for arms35,36 and for face 37 and herein documented to apply to neck skin but not to the submental area.
The differences in averages between genders at neck were 15% and for arm were 14%. These gender-related differences would appear large enough so that if using absolute TDC values it would be prudent to consider gender-specific criteria. In contrast to gender differences in TDC values, differences in TDC values between neck sites on the same side and between arms were small even though some were statistically different (Table 1). TDC of the lower neck site (N2) was consistently greater than the upper site (N1) on both neck sides; percentage differences for the full group (n = 60) being 3.9% for the left side and 4.5% for the right side. For studies in which these percentage differences may be of importance, care should be used to try to standardize measurement locations. That there are in fact such differences longitudinally dependent TDC differences is consistent with prior work on anatomical differences in TDC values.38,39
Study limitations
A limitation of the present study is that the proposed lymphedema index that is based on neck and arm measurements or submental and arm measurements is derived from measurements on a nonlymphedematous group. Although this group had a wide age and BMI range, the suitability of thresholds that emerged needs to evaluated in patients who are at risk for head-and-neck lymphedema or who have already had this diagnosis. Thus, the present reference indices represent a first step in the process of developing a suitably convenient and accurate assessment method relevant to head-and-neck lymphedema. It is hoped that this concept and the thresholds will provide the framework and basis for application to clinical assessments.
Conclusions
An approach to aid in quantifying and tracking head-and-neck lymphedema using TDC measurements was evaluated in a healthy cohort to provide reference values and lymphedema thresholds. The method uses TDC neck and/or submental values normalized to a person's forearm TDC values as indices of lymphedema presence and extent. The resultant ratios, denoted as NAI and SAI, yielded a value of 1.80 for NAI and 1.95 for SAI as practical lymphedema threshold estimates. It is suggested that these indices might be used to detect and to track changes in lymphedema status based on a patient's changing indices associated with lymphedema treatment. Evaluation of the specific threshold value and tracking utility of these indices in patients diagnosed and being treated for head-and-neck lymphedema is warranted as a next step.
Footnotes
Acknowledgments
The authors thank the many subjects for their volunteering. Without their participation, this research would not have been done. S.B., R.K, Z.K, and A.P. are second-year medical students and each contributed equally to this research and article efforts.
Authors' Contributions
All authors contributed to and reviewed this article and approved the final article.
Author Disclosure Statement
No competing financial interests exist.
Funding Information
No funding was received for this article.