
Abstract
Background:
Lipedema of lower limbs is characterized by bilateral accumulations of excess adipose tissue starting from the ankle to the hips and buttocks. The studies with lymphoscintigraphy (LSC) and magnetic resonance (MR) lymphography show altered transport index and enlarged lymphatic vessels (LVs). Our studies aimed to investigate the superficial lymph flow, water accumulation, skin and subcutaneous tissue elasticity, and the possibility of using this information to diagnose lipedema.
Methods and Results:
Fifty patients with lipedema and 50 control subjects (women) were included. The Indocyanine Green (ICG) lymphography, LSC, skin water measurement, skin durometry, and deep tissue tonometry were done in all participants. ICG lymphography revealed: (1) Slower lymph flow in lipedema patients; after 3 minutes of feet movement in a horizontal position, the ICG-dyed lymph reached the upper calf level in 8% of lipedema patients compared with 56% in the control group (p ˂ 0.0001). (2) More than three LVs were noticed more often in lipedema patients. (3) The higher number of abnormal LV images at all limb levels and during each observation stage with a statistically significant number of foggy and dilated. (4) Statistically significant higher fluorescent intensity in all limb levels. Skin water concentration was higher in the feet in lipedema (p = 0.000189).
Conclusion:
Our studies have shown the differences in superficial lymph flow and water concentration between lipedema and normal limbs. Data proove the usefulness of ICG lymphography, skin water concentration and skin and subcutaneous tissue elasticity measurements in diagnosing lipedema.
Introduction
Lipedema is a chronic and progressive disease characterized by excessive subcutaneous (nonvisceral) adipose tissue deposition mainly in the lower body (hips, thighs, calves), and much less often in the upper extremities. It affects around 11% of females (not males) in the world population, develops during hormonal changes inclusive of puberty, pregnancy, or menopause, and maybe genetically transmitted.1–3 Lipedema is associated with swelling, heaviness, pain, bruising, and psychological problem. The local deposition of adipose tissue results in limb mass increase with their functional impairment making patients less ambulant even at an early age. The actual cause of lipedema remains unknown.
Lipedema is frequently misdiagnosed as lymphedema.1,2 The main similarities between lipedema and lymphedema are excess intercellular (tissue) fluid, hypertrophy, and hyperplasia of adipocytes and fibroblasts.4,5 Studies on the lymphatic system in patients with lipedema suggest some impairment in lymphatic transport. Lymphoscintigraphy (LSC) pictures reveal altered transport index, dilated, irregular, tortuous course of the main lymphatic vessels (LVs), or even accumulation of tracer in the tissue (dermal backflow) similar to the changes observed in lymphedema. 6 Enlarged LVs are seen as well in magnetic resonance lymphography.2,7 The bioelectrical impedance analysis shows increased water concentrations in the limbs in patients with lipedema regardless of body weight. 8 In severe cases of lipedema, damage of the LVs, stagnation of tissue fluid, and inflammation of the skin and subcutaneous tissue occur (often described in the literature as lipolymphedema). 2
The diagnosis of lipedema remains a challenge and is still based on the criteria proposed in 1940 by Wold et al. 9 As lipedema is often misdiagnosed with lymphedema, and to exclude any damage to the LVs, we started to use the diagnostic tests we usually perform in lymphedema in lipedema patients: fluorescent lymphography with Indocyanine Green dye (ICG lymphography), LSC, skin water concentration, durometry, and tonometry. ICG lymphography allows for the visualization of individual LVs along the limb, observation of the rate of formation and drainage of tissue fluid/lymph, and places of fluid accumulation in the subcutaneous tissue (on the depts of 15–20 mm) in real time. 10 Water concentration measurement depicts the sits (areas) with higher fluid accumulations; durometry and tonometry show the skin and subcutaneous tissue stiffness associated with secondary tissue changes (hyperkeratosis, fibrosis, adipose tissue overgrowth) and excess fluid.
All these methods proved their usefulness in detecting (lymph)edema.10–13 According to our knowledge, they have not been used (with the expectation of LSC) in lipedema.
The purpose of this study was to investigate whether the ICG lymphography and simple diagnostic tests, such as skin water concentration and skin and subcutaneous tissue tonometry will show a difference in superficial lymph drainage, fluid accumulation, and changes in skin and subcutaneous tissue stiffness between lipedema and normal limbs, and can be used to diagnose lipedema.
Materials and Methods
Patients
We analyzed data of 50 patients (women) appearing in our outpatient clinic between 2016 and 2021 with the bilateral and symmetrical accumulation of fat in the lower limbs, starting at the ankles, and including the calves, thighs, and hips, resistant to diet changes and physical activity, diagnosed as lipedema stages I–III. The mean age of patients was 47.7 ± 13.9 (range 19–77), mean weight 88 kg (58–96), and height of 168 cm (160–176). We classified 6 (12%) women as lipedema stage I, 29 (58%) as stage II, and 15 (30%) as stage III.9,14 Patients were referred for additional routine tests (ICG lymphography, LSC, skin water concentrations, tonometry, durometry) to exclude damage to the lymphatic system.
The control group consisted of healthy limbs of 50 patients (women) presenting to our outpatients' clinic with unilateral lower limb lymphedema (of postdermatitis and post-trauma etiology) mean age 48 ± 18.5 (range 18–87), mean weight 80 kg (49–88), mean height of 164 (158–178). Patients with obesity, diabetes, chronic venous insufficiency, history of cancer, lymph node (LN) dissection, radiation treatment, and any episode of limb skin and subcutaneous tissue inflammation in the past (on the healthy limb in the control group) were excluded from the study.
Each patient was thoroughly informed about the diagnostic tests, and each gave written consent for their performance. Bioethics Committee in the Center of Postgraduate Medical Education, Warsaw, approved the study (approval number 27/2021).
ICG near-infrared lymphography
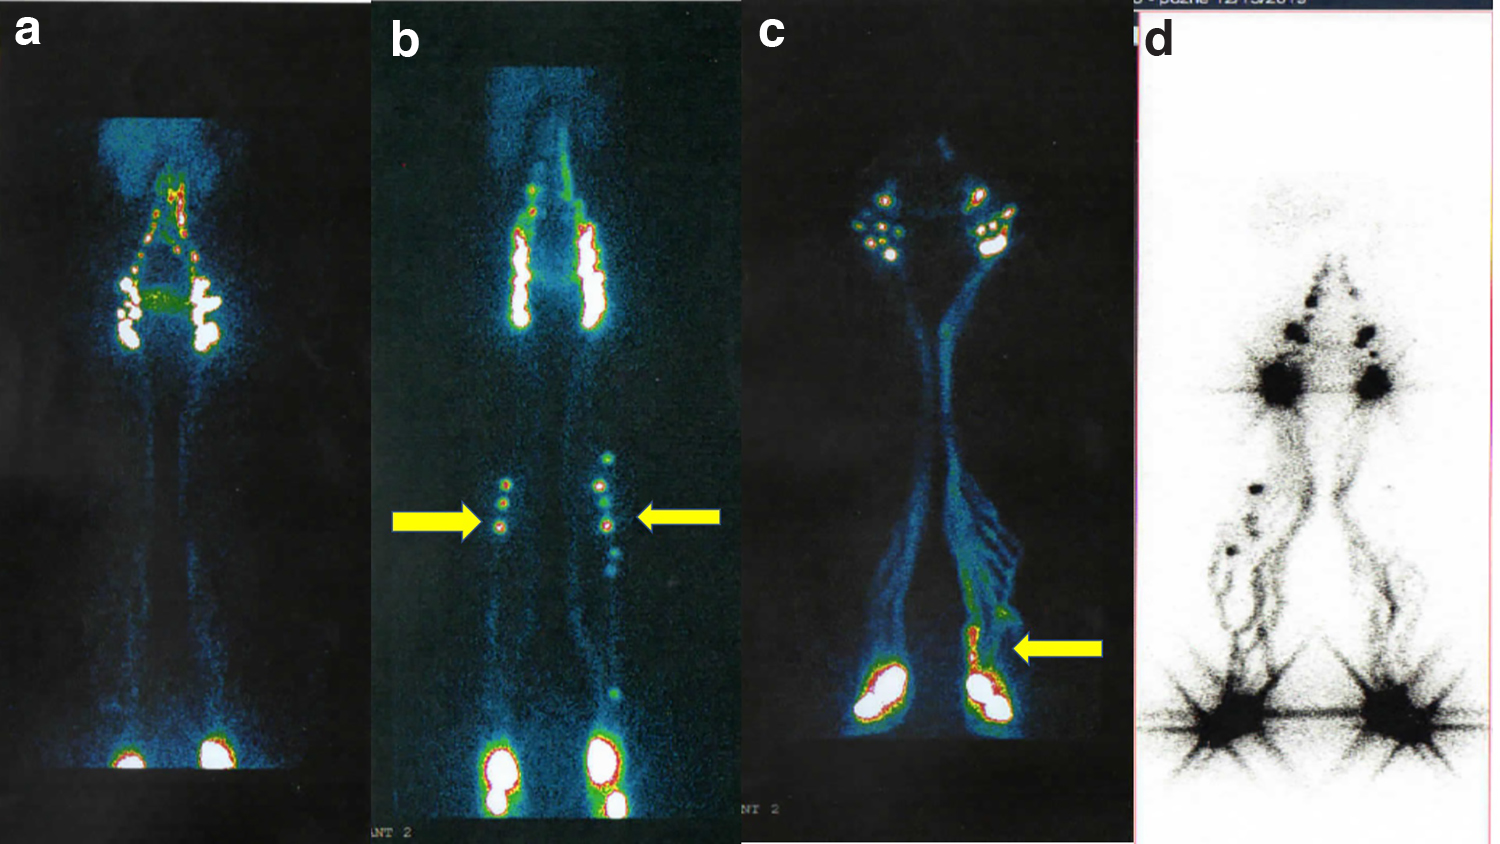
ICG lymphography was performed as previously described. 10 Briefly, a portion of 0.2 mL of 0.5% of ICG dye (Pulsion, Munich, Germany) was injected subcutaneously between the first and second, and fourth and fifth toe web in both feet. The ICG lymphangiography system (Photodynamic Eye, Hammamatsu Photonics) was used. Live dynamic images of superficial lymphatics were recorded in every patient three times: 3 minutes after injection, after 3 minutes of the feet movement in the supine position, and after 1 hour of walking. We estimated the number of lipedema patients and control subjects with visualized LVs in the feet, lower calf, upper calf, thigh, and inguinal LNs (regions of interest [ROI]) (Fig. 1) after each stage of observation. All images were analyzed according to the number of lymphatics (1–3 LVs vs. >3 LVs) and their abnormal appearance (foggy, delated, confluent, lazy, intermittent). The fluorescence intensity in five ROI was measured using the IC-CALC 2.0 software (Pulsion). 10

Schematic presentation of the lower limb areas (ROI) in which the analysis of lymphatic flow, the number of LVs (1–3 vs. >3 LVs), and their appearance (linear, foggy, dilated, confluent, lazy, tortuous, intermittent) were carried out in ICG lymphography and LSC.
Lymphoscintigraphy
Isotopic LSC was performed as previously described. 11 Briefly, Tc99m-Nanocoll (230–250 MBq divided into two portions) was injected between the first and second and fourth and fifth toe web in both feet (for superficial collectors) and posterior part of the sole (for deep collectors). Continuous acquisition in a whole-body mode was done after 10- and 60-minute walking. Evaluation of images included the injection site absorption rate, time of tracer appearance in the regional LNs, shape, and course of LVs (linear, tortuous, dilated).
Tissues' dielectric constant: water concentration measurement
The water concentration on the depth from 0.5 to 5 mm was done as we previously described. 11 Briefly, the device (LymphScanner; Delfin Technologies Ltd., Kuopio, Finland) we used for tissue water concentration was placed gently on the skin. After 5 seconds, the water contents expressed as a percentage can be read off on the device display. The measurements were done at six limb levels: foot dorsum, and on the inner site of the limb 5 cm above the ankle, mid-calf, 5 cm under the knee, mid-thigh, and groin.
Skin tonometry (durometry)
Skin (epidermis and dermis) stiffness was measured at these same limb levels as tissue water concentration with skin fibrometer (Delfin Technologies Ltd.). This device is equipped with a small measurement probe (diameter of 23 mm) and measures the stiffness 1.25 mm deep. Data are expressed in Newtons (force 1 kg·m/s 2 ), 1 N = 0.0981 kg. 11
Skin and subcutaneous tissue tonometry (deep tissue tonometry)
To measure deep tissue tonometry, we used a device composed of the 10-mm-long plunger (round, 1 cm2 surface area) and manometer (Wagner, Seattle, WA). The force required to press the plunger 10 mm into the tissue within 5 seconds expressed in g × 103/cm2 was read off the manometer scale.11,15 The measurement was done on five lower limb levels (5 cm above the ankle, mid-calf, 5 cm under the knee, mid-thigh, groin).
Statistical evaluation
Data were expressed in percent (ICG and LSC images, water concentration) and mean ± standard deviation (durometry, tonometry). For statistical differences between the group's proportion test (z-test) and a double-tail Student's t-test were applied. Statistical significance was set at p < 0.05 level.
Results
ICG lymphography
Lymph flow velocity
During the first 3 minutes of observation after injection of ICG dye, we observed the visualization of LVs in the feet and in the lower and upper calves without differences between the lipedema patients and the control group.
After the second stage of observation, that is, 3 minutes of feet movement (rhythmic flexing of the feet) in horizontal position, we observed slower flow of ICG dyed lymph along the lower limb lymphatics in patients with lipedema. The ICG dyed (stained) lymph reached the level of the upper calf in 8% 4 of lipedema patients compared with 56% 16 in the control group (p ˂ 0.0001). There were differences between lipedema stages. Among the 31 lipedema patients with visualized LVs in the lower calves, there were 5 (83.3%) with stage I, 21 (72.4%) stage II, and 5 (33.3%) with stage III lipedema (statistically significant difference between stages I and III p = 0.0381 and stages II and III, p = 0.0128). The lymph reached the upper calf level in two patients with stage I and two patients with stage II (Fig. 2).
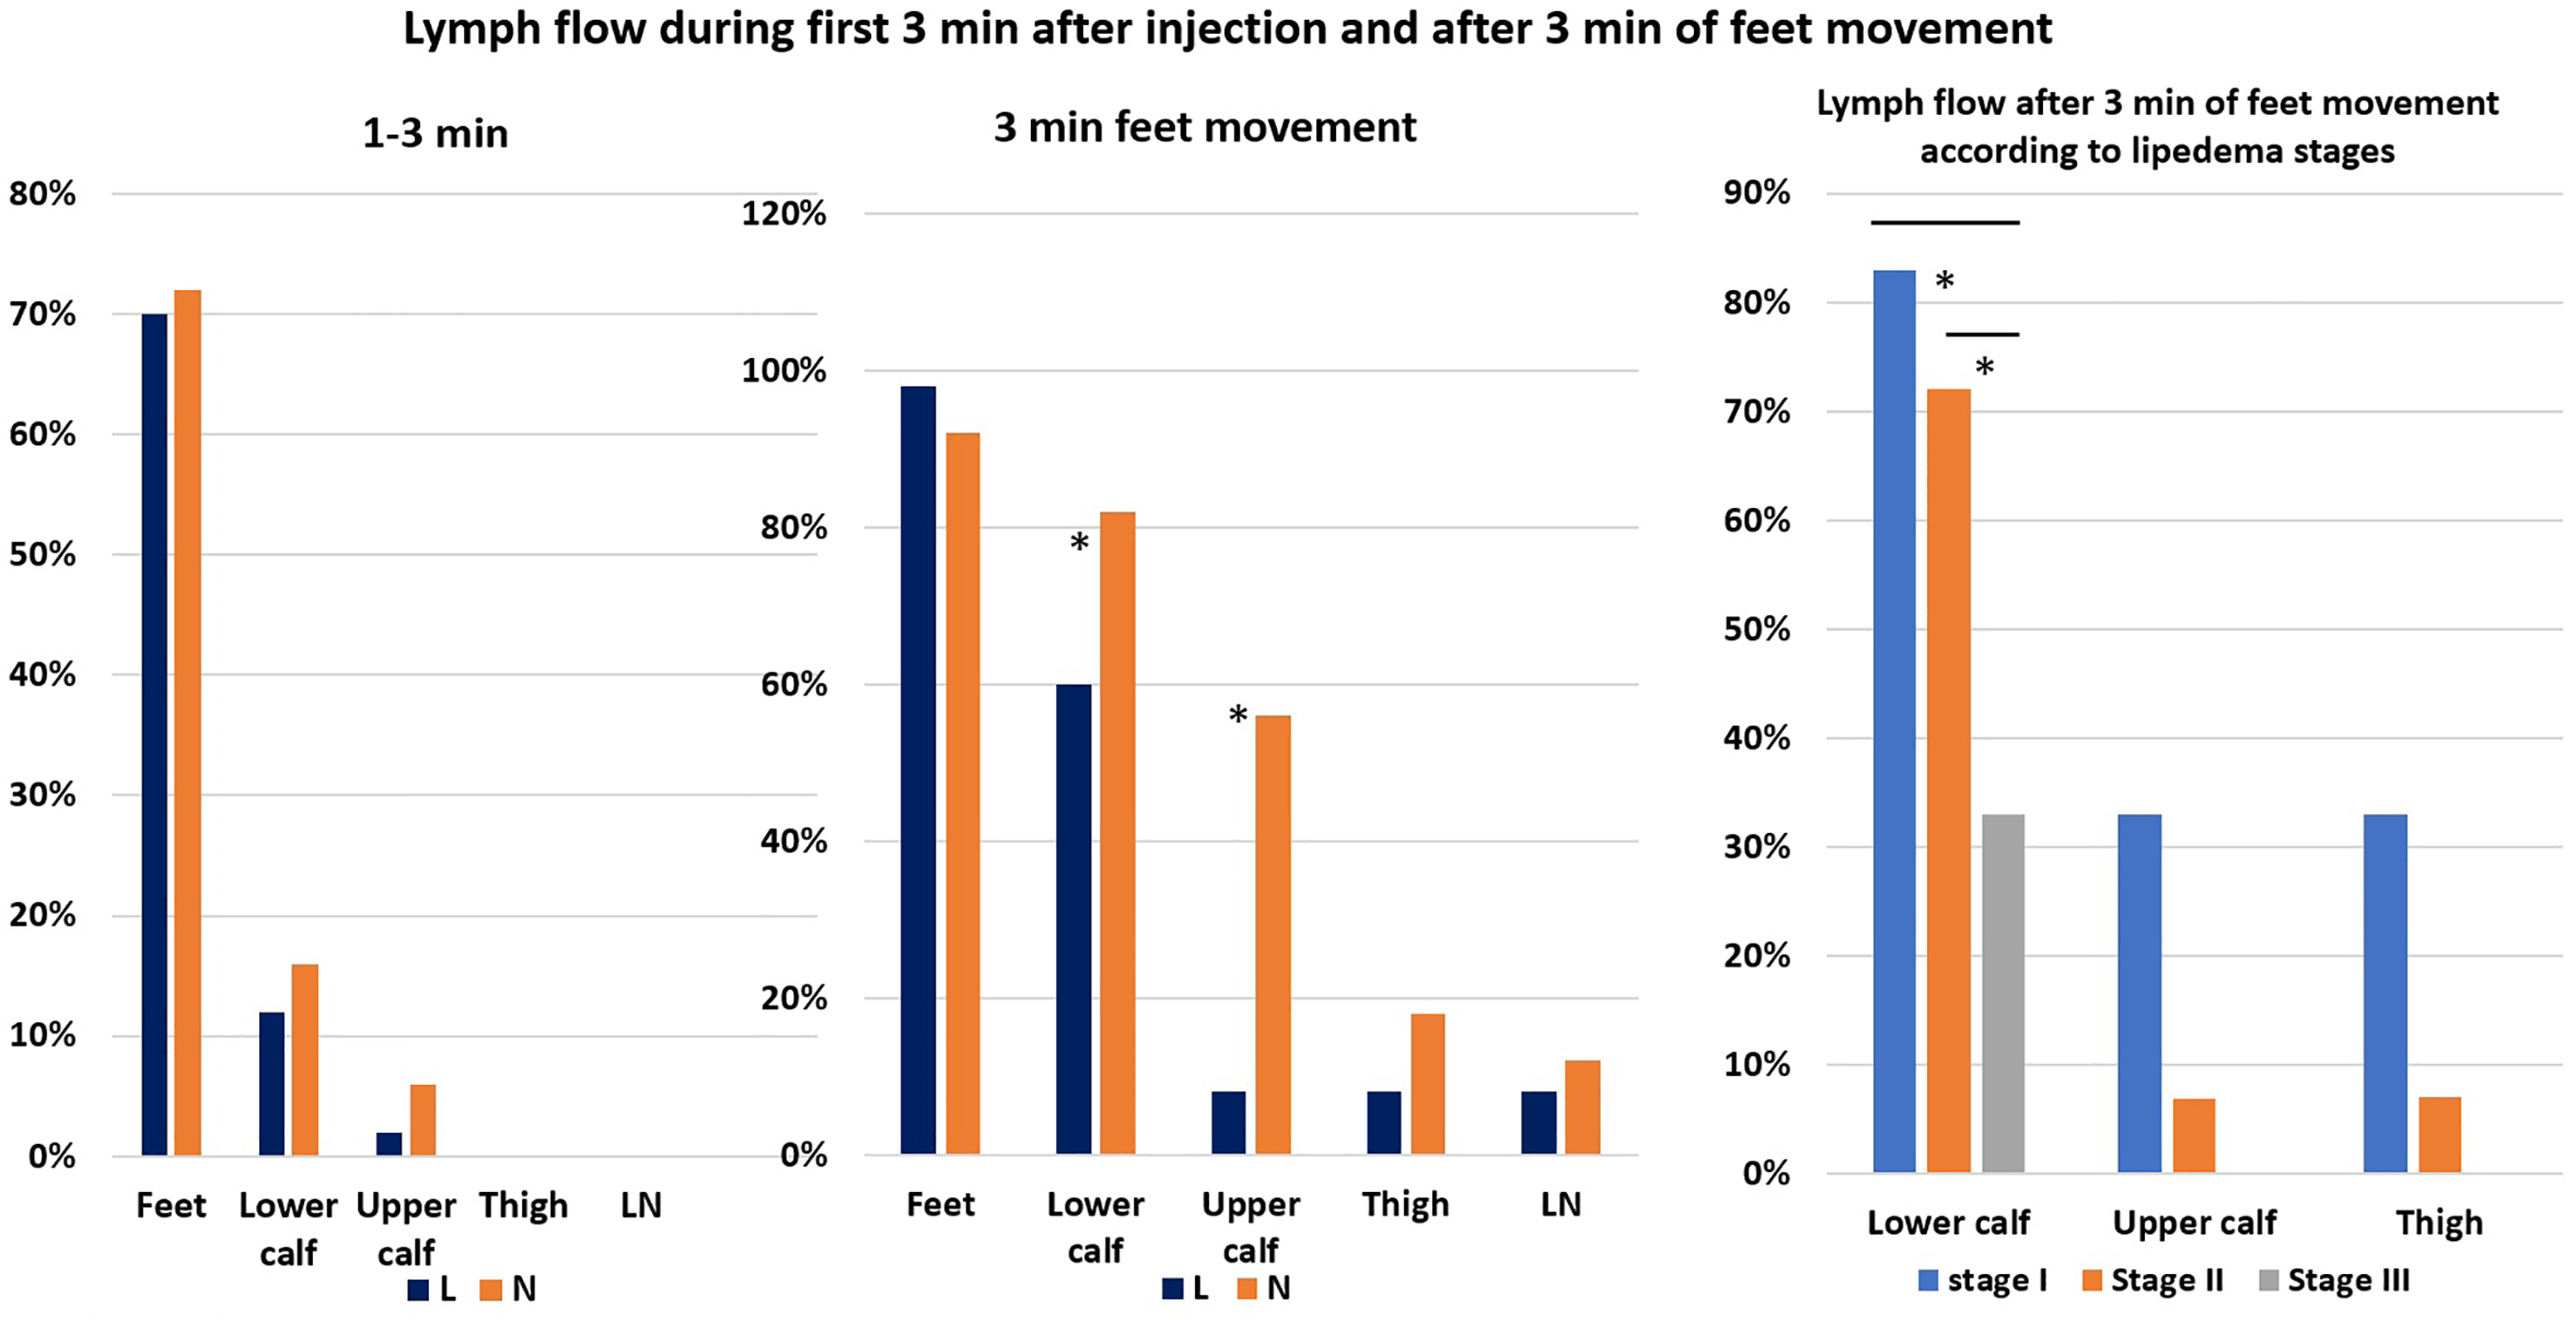
The percentage of lipedema patients and control subjects with visualized LVs in the foot, lower and upper calf, thigh, and inguinal LNs during the first 3 minutes after ICG dye injection (left), after 3 minutes of feet movement in the supine position (mid), and after 3 minutes of feet movement according to the lipedema stages (right). There are no major differences in the number of lipedema patients and control subjects with visualized LVs in the feet, and lower and upper limbs during the first 3 minutes after ICG dye injection. The statistically significant lower number of lipedema patients with visualized LVs in the lower calves (n = 31), (p = 0.0259) and upper calves (n = 4), (p ˂ 0.0001), and not significant in the thigh (n = 4) compared with control subjects (n = 41, n = 28, and n = 9, respectively) after 3 minutes of feet movement. Note the differences in the lymph flow between the lipedema stages (right). The lower calf level reached 5 from 6 patients with stage I lipedema (83.3%), 21 from 29 (72.4%) with stage II, and 5 from 15 (33.3%) with stage III (statistically significant difference between stages I and III p = 0.0381 and stages II and III, p = 0.0128). In the upper calf and thigh levels, LVs were visible in two patients with lipedema stage I and two patients with lipedema stage II. No visualized LVs in patients with lipedema stage III above the lower calf were seen. *p < 0.05.
No differences were noticed after 1 hour of walking.
Number of visualized LVs
We observed a higher number of lipedema patients with more than three visualized LVs during all stages of observation at all limb levels. The statistically significant differences were noticed in the feet 3 minutes after dye injection (p = 0.018), and after 3 minutes of feet movement (p = 0.0243), and in the lower calves after 3 minutes of feet movement (p < 0.0001), and after 1 hour of walking (p < 0.0001) (Fig. 3).
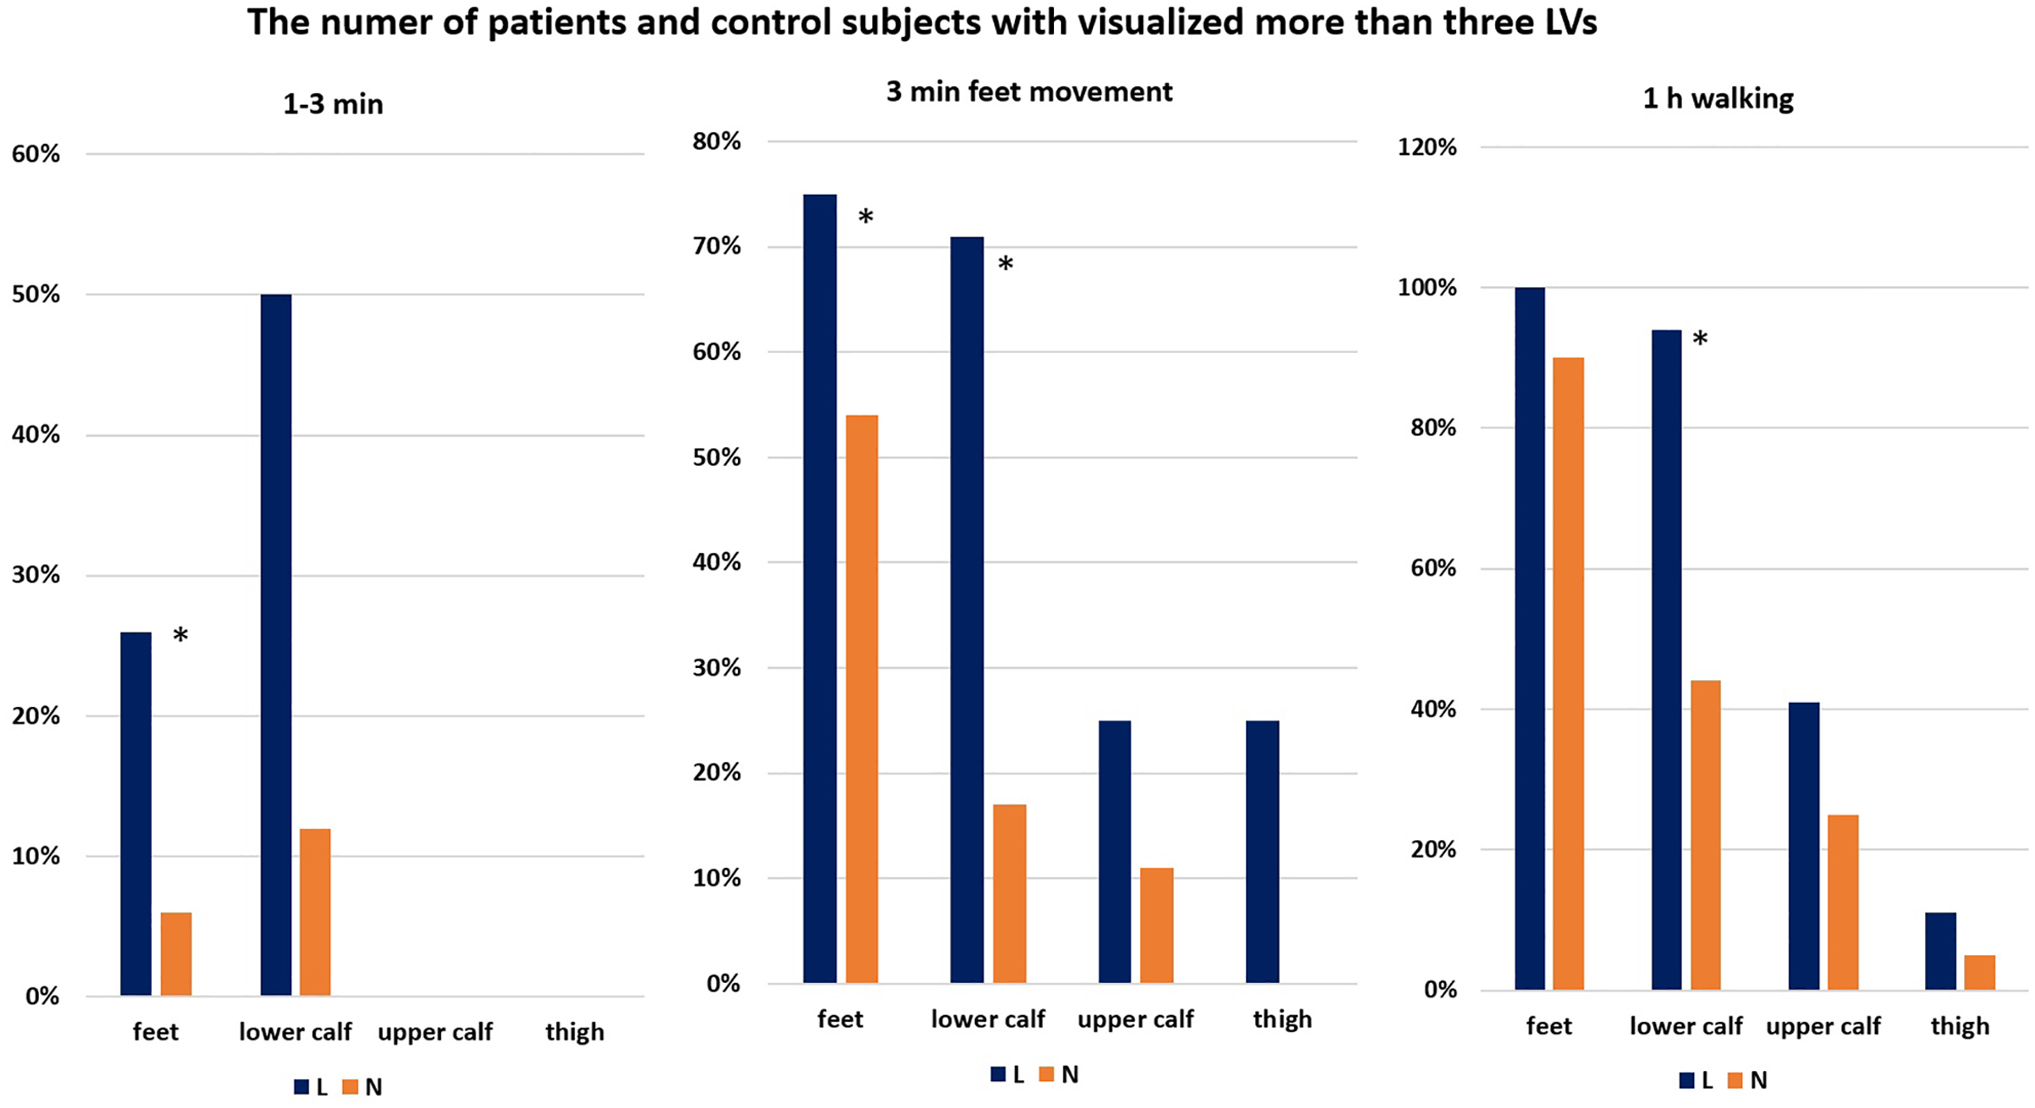
The percentage of lipedema patients and control subjects with more than 3 visualized LVs in the feet, lower and upper calves, and thighs 3 minutes after injection (left), after 3 minutes of feet movement in the supine position (mid), and after 1 hour of walking (right). The statistically significant higher number of lipedema patients with more than 3 visualized LVs in the feet (n = 9), (p = 0.018) and not significant in the lower calves (n = 3), 3 minutes after ICG dye injection compared with control subjects (n = 2, n = 1, respectively). Statistically significant higher number of lipedema patients with more than 3 visualized LVs in the feet (n = 37), (p = 0.0243) and in the lower calves (n = 22), (p < 0.0001) and not statistically significant in the upper calf (n = 1), and thighs (n = 1) after 3 minutes of feet movement compared with control subject (n = 25, n = 7, n = 3, and n = 0, respectively). The higher number of lipedema patients with more than 3 visualized LVs in the feet (n = 50), lower calves (n = 47), (statistically significant, p < 0.0001), upper calf (n = 18), and thigh (n = 5) after 1 hour of walking compared with control subjects (n = 45, n = 22, n = 12, n = 2, respectively). *p < 0.05.
Abnormal appearance of LVs
We observed abnormal LVs in lipedema patients at all levels of lower limbs (ROI) and in all stages of the investigation. The lipedema and control images from the foot and calf are shown in Figure 4. The highest number of abnormal LV images were noticed in the lipedema group in the lower and upper calves after 1 hour of walking. The foggy images of LVs were observed in 27 (54%), dilated in 31 (62%), and confluent in 6 (12%) lipedema patients compared with 7 (14%) dilated and 1 (2%) lazy in the control group in the lower calf. In the upper calf regions, there were 10 (23%) foggy, 11 (25%) dilated, 1 (2%) lazy, and 3 (7%) intermittent versus 3 (6%) dilated. In the thigh, we noticed foggy images of LVs in 7%, 3 dilated in 2%, 1 and intermittent in 20% 9 lipedema patients compared with 6% 2 intermittent in control subjects.

The ICG lymphography pictures of the feet dorsum, lower and upper calves. The normal size of food
Fluorescent intensity
ICG lymphography enables visualization of lymph flow rate, the number of visualized LVs and their condition, and semiquantitative evaluation of the area occupied by ICG dye along the limb as fluorescent intensity.
In lipedema patients, fluorescent intensity was statistically significant higher in all limb levels, meaning more ICG dyed fluid (lymph) was in and around LVs in lipedema limbs.
Numerical differences between the groups are present in Figure 5.
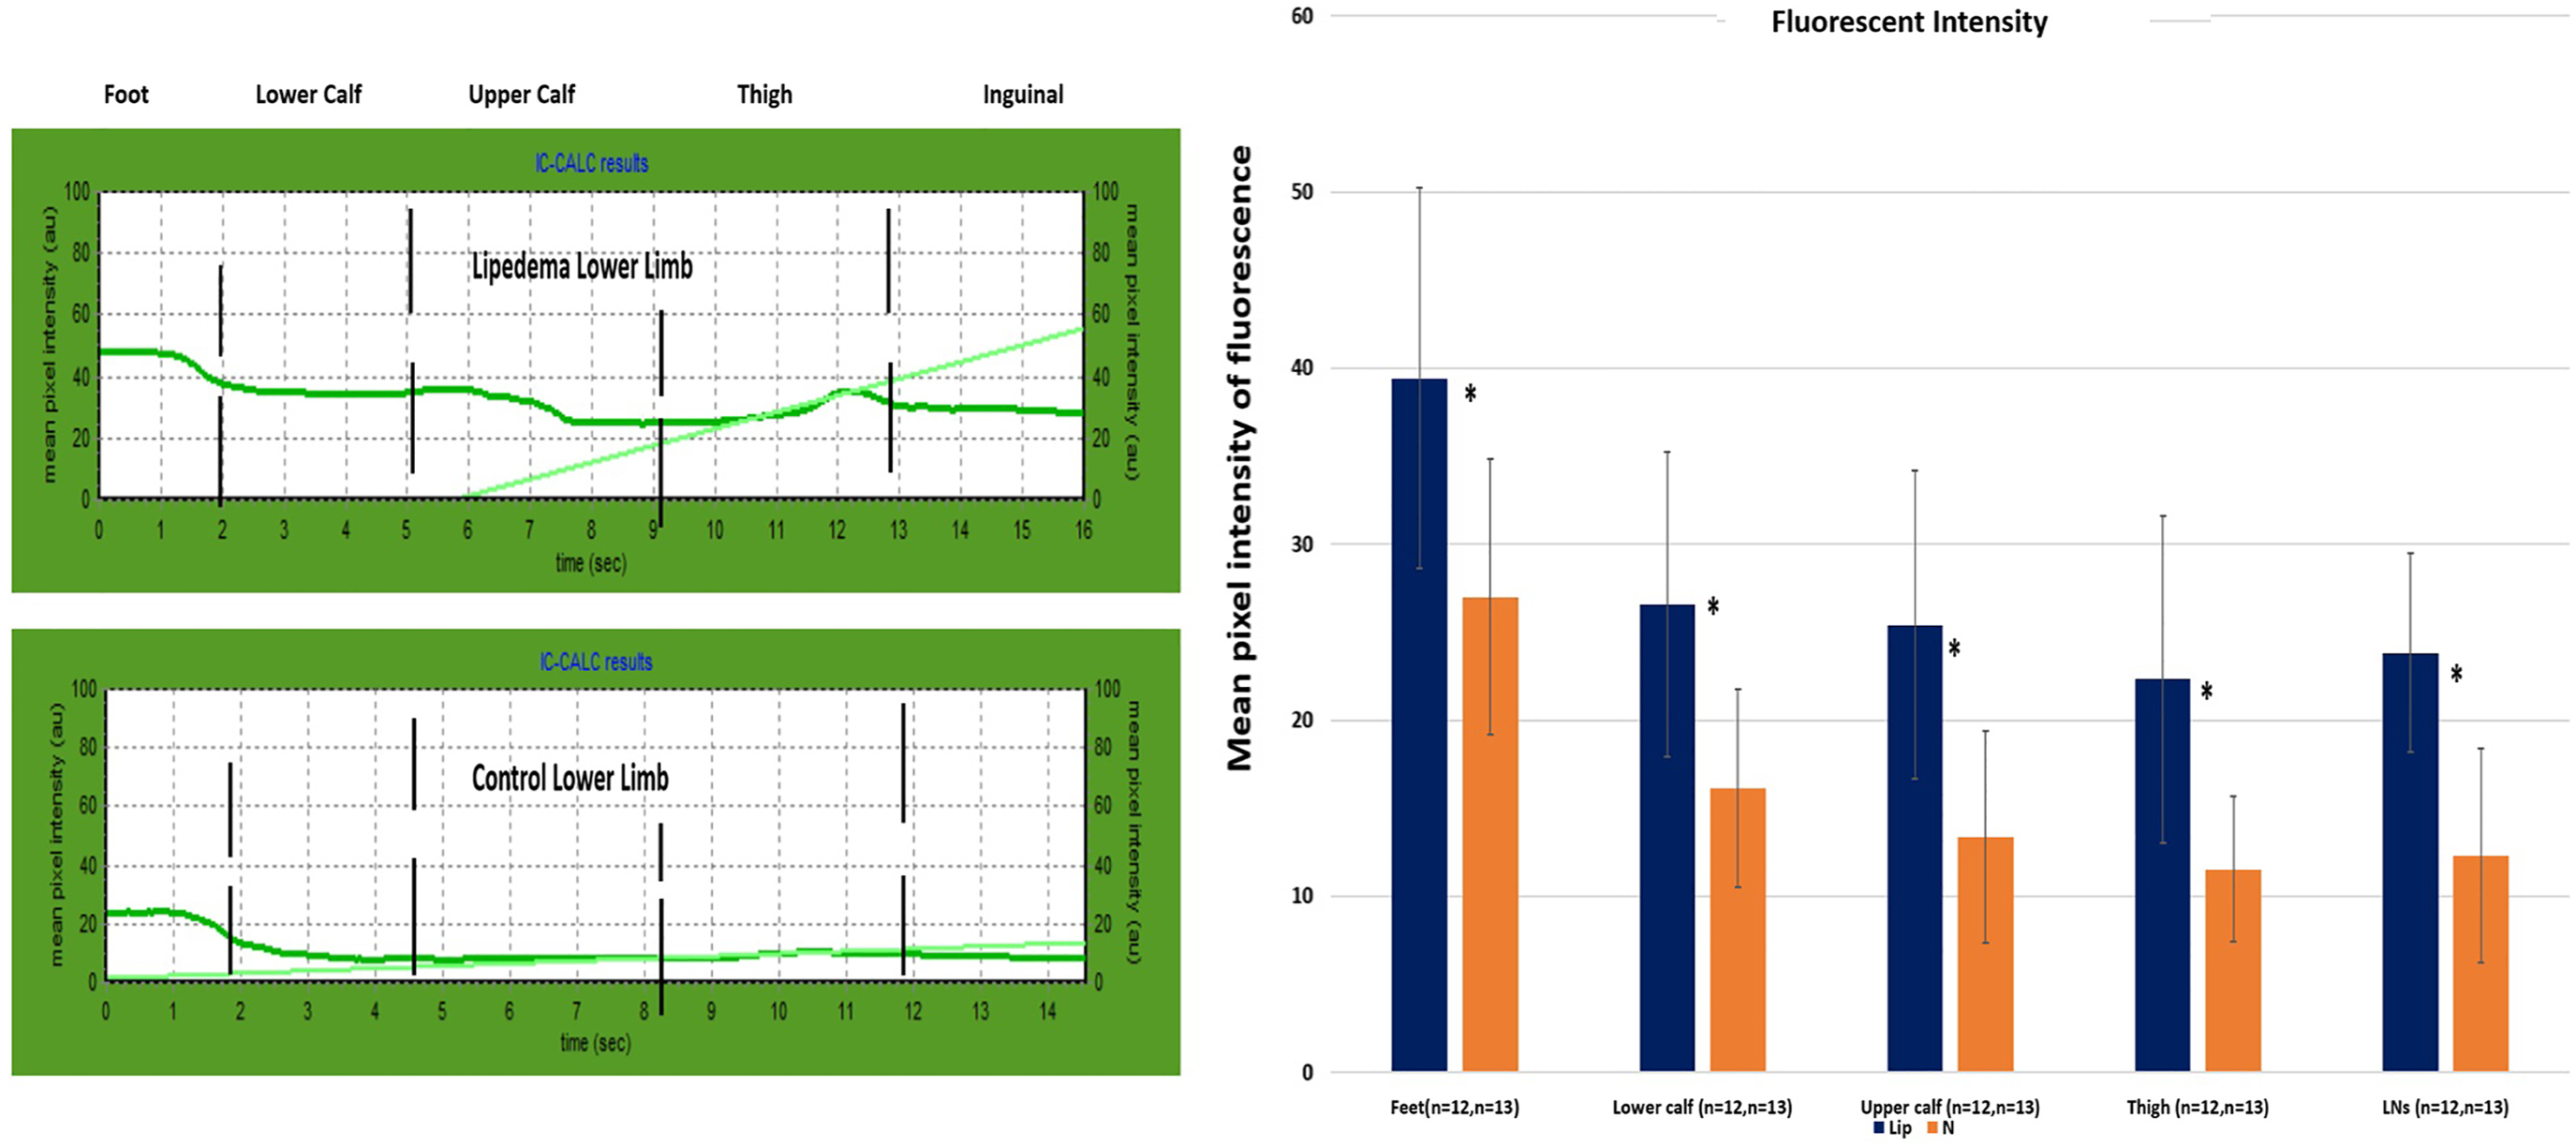
An example of numerical evaluation of the ICG lymphograms along the lower limbs in lipedema patient (upper curve) and control subject (lower curve) on the left site. The higher fluorescent intensity (expressed as mean pixel intensity) along the entire limb in the lipedema patient reflects the accumulation of surplus lymph/tissue fluid in and around lymphatics in the lipedema patient. Numerical fluorescent intensity data at five limb levels in lipedema patients and control subjects (right). Note the statistically significant higher fluorescence intensity in lipedema patients in the feet (p = 0.004267), lower calf (p = 0.002278), upper calf (p = 0.000839), thigh (p = 0.001348), and inguinal level (p = 0.000098). IC-CALC. *p < 0.05.
Lymphoscintigraphy
We analyzed LSC images (34 lipedema and 23 in the control group) according to the number of main lymphatic routes and their abnormal course in calves and thighs, popliteal LNs, and the number of inguinal LNs. The LSC images of healthy subjects and various lipedema stages are shown in Figure 6. Our analysis revealed significantly more LVs in the calf in the lipedema group than in the control group. More than three LVs were seen in 56% 17 lipedema patients versus 13% 3 in control group (p = 0.0011). The abnormal course of LVs (foggy, dense, dilated, tortuous) was noticed more frequently in the calves, less in the thigh, and in lipedema limbs. There were 16 (47%) dilated and 9 (26%) tortuous LV images in the lipedema group compared with 1 (4.3%) (p = 0.0005), and none (p = 0.0078) in the control group, respectively. In the thigh in 9 (26%) lipedema cases, we noticed dilated LVs compared with 1 (4.3%) in the control group.
LSC pictures of the superficial and deep lymphatic system in lower limbs in a control subject and different stages of lipedema patients.
Skin water concentration (tissues dielectric constant)
We noticed statistically significant higher skin water concentrations in the feet in lipedema patients than in control limbs and slightly higher on other limb levels. There were differences (not statistically significant) between the stages of lipedema, mostly in lower parts in the limbs (feet, ankle level, and mid-calf), with higher water concentration in more advanced lipedema (Fig. 7).

The numerical data of skin water concentration expressed as a percentage (%) at six limb levels in lipedema patients and control subjects (left), and differences between skin water concentration at six limb levels according to lipedema stages (right). Note statistically significant higher skin water concentration in the feet in lipedema patients (p = 0.000189) and higher water concentration in more advanced lipedema stages at most limb levels. *p < 0.05.
Skin tonometry (durometry)
Skin stiffness was highest at the mid-calf level and higher in lipedema patients than in the control group (not significant). There were no differences in skin stiffness between the groups on the other limb levels (Fig. 8).

Skin stiffness (left) was measured at six limb levels, and skin and subcutaneous tissue stiffness (right) at five limb levels in patients of lipedema and control subjects. Both values expressed as mean ± standard deviation in Newton (durometry) and g × 103/cm2 (deep tonometry). Note the higher skin and subcutaneous tissue stiffness in the mid-calf and higher in lipedema patients than in control subjects. *p < 0.05.
Deep tissue tonometry
In lipedema patients, more force was needed to make a 10-mm-deep indentation in all limb levels, except the ankle than in the control group, which means subcutaneous tissue in lipedema is stiffer (less elastic) than in normal limbs (Fig. 8).
Discussion
The tests we routinely performed on lymphedema patients gave us some new information about lipedema patients' superficial lymph drainage and elasticity of the skin and subcutaneous tissue.
ICG lymphography revealed (1) significantly higher number of lipedema patients with slower lymph flow along the LVs during 3 minutes of feet movement in the supine position, higher in more advanced stages, (2) higher number of lipedema patients with visualized more than 3 LVs in all limb levels during all stages of observation, (3) higher number of abnormal LV images at all limb levels and during each stage of observation with a statistically significant number of foggy and dilated LVs, and (4) statistically significant higher fluorescent intensity at all limb levels, highest in the feet.
The LSC images proved the higher number of main LVs with the calf's abnormal course (dilated, tortuous).
The additional tests to determine tissue properties showed the higher water concentration in lipedema limbs with the highest value in the feet (statistically significant), higher in more advanced lipedema cases, higher skin stiffness in the mid-calf without differences in other limb levels, and slightly less elastic (more stiff) skin and subcutaneous tissue at all limb levels, except the ankle.
Lipedema is characterized by bilateral accumulations of excess adipose tissue starting from the ankle to the hips and buttocks. Patients complain of heaviness, swelling increasing during the day, and pain. All these ailments do not involve the feet.
In our study, the skin water concentration in the feet (the sites with the highest LV density and highest lymph production) was significantly higher in lipedema patients than in the control group. The fluorescent intensity was also highest in the feet, and a number of foggy, dilated, and confluent LV images more often were seen during ICG in this region even at the first 3 minutes after dye injection. The number of abnormal LVs increased after feet movement and after walking.
These suggest a higher lymph production in the feet in lipedema patients. Al-Ghadban et al. revealed a higher number of blood microvessels in the skin in lipedema patients and a higher diameter of blood microvessels in the adipocyte tissue in these patients. 18 Other studies also demonstrate a high density of blood capillaries and increased permeability in lipedema patients compared with those of the control and obese (no lipedema) patients.19,20 These findings mean the capillary exchange surface is larger in lipedema, and there is more capillary filtrate (tissue fluid) in the intracellular space.
Bioimpedance study conducted by Crescenzi et al. revealed higher extracellular water levels in the lower limbs of patients with lipedema, even in early stages than in control groups, higher in patients with more advanced stages of lipedema. 17
More visualized LVs, the higher number of dilated and foggy LVs in ICG images, dilated, tortuous LVs in LSC, and slower lymph flow along the LVs in our study suggest overloading of functional capacity of the LVs, which leads to a constantly increased accumulation of lymph in the interstitial space.
Whether excess tissue fluid located in the interstitial space in lipedema is caused by increased capillary filtration or hyperpermeable blood capillaries 21 or the dysfunction of the lymphatic capillaries, remains unclear.
Our observations of ICG lymphography in lipedema limbs showing a more significant number of dilated and foggy images of LVs and significantly higher fluorescent intensity may also suggest increased permeability of lymphatics and accumulation of tissue fluid in the perivascular space. The changes in the structure of the LVs, called in the literature, microaneurysm, causing leakage of lymph with lipids and other components as apolipoproteins, glycerol, choline, adipokines, and leptin, from damage and high permeable LVs, may cause excessive adipogenesis in lipedema.16,18,22–26
Skin and subcutaneous tissue stiffness reflect fluid accumulation and changes in the tissue, like fibrosis and overgrowth of adipose tissue. The study conducted by Felmerer et al. revealed the increased thickness of skin epidermis and fibrosis between hypertrophied tissue in lipedema. 27 We noticed both higher skin and subcutaneous tissue stiffness and higher water concentration in our lipedema patients. The skin and subcutaneous tissue stiffness was highest in the mid-calf. In lymphedema patients, due to LV obstruction and gravity, we observed the most significant changes in skin and subcutaneous tissue stiffness, usually above the ankle area.11,28 In lipedema, the lymphatic system is functionally overloaded but not obstructed, so the elasticity of the skin and subcutaneous tissue is lower in the narrow area with a greater mass of adipose tissue (mid-calf). However, more study is needed to observe the differences between the stages of lipedema.
The limitations of our study are differences in the number of patients at different lipedema stages, especially the small number of patients with stage I lipedema. The small number of durometry and tonometry measurements made it impossible to observe the differences between the lipedema stages. It would also be interesting to compare data obtained in lipedema with a group of obese women.
Taken together, our data from the ICG investigation revealed differences in lymph flow velocity during rhythmic feet flexing in a horizontal position, number of visualized lymph vessels, number of abnormal lymph vessels, and more fluid in and around lymphatics in lipedema patients compared with gender, age, and weight-matched control group. According to our knowledge, this is the first-ever ICG study in lipedema patients. LSC images prove the previous report of some alteration in lymph vessels as their dilated and tortuous course. Additional findings are the higher skin water concentrations and higher skin and subcutaneous tissue stiffness. All these data prove the usefulness of ICG lymphography, skin water concentration, and skin and subcutaneous tissue stiffness measurements in diagnosing lipedema; however, more studies are needed for established precise diagnostic criteria.
Footnotes
Author Disclosure Statement
No competing financial interests exist.
Funding Information
No funding was received for this article.