
Abstract
FREM1 was first identified as an extracellular matrix protein that is essential for the formation of the epithelial basement membrane during embryonic development. Recent studies have shown that FREM1 also modulates innate immunity through its isoform 2 splice variant protein, known as Toll-like/interleukin-1 receptor regulator (TILRR). TILRR is a co-receptor that enhances pro-inflammatory IL-1R1 signal transduction. Our previous study identified the minor allele of a SNP, rs1552896, in the intronic region of FREM1 gene to be associated with natural resistance to HIV-1 infection in a subgroup of Kenyan sex workers in the Pumwani cohort. To study the role of FREM1 and its variants in differential susceptibility to HIV-1 infection, we generated a panel of 17 monoclonal antibodies against two recombinant proteins of FREM1, rspD and rspF. Epitope mapping using overlapping pin peptides showed that the monoclonal antibody (MAb) panel interrogated seven unique regions across five different domains, including the C-type lectin domain disulfide bond and the TILRR GAG serine attachment site. Utility of three selected FREM1 MAbs were demonstrated by FACS and immunohistochemical detection of FREM1 in 293F kidney embryonic cells, HeLa 229 cervical cells, and Sup-T1 cells. Thus, these monoclonal antibodies could be used to study the functional domains of FREM1 and its isoforms.
Introduction
T
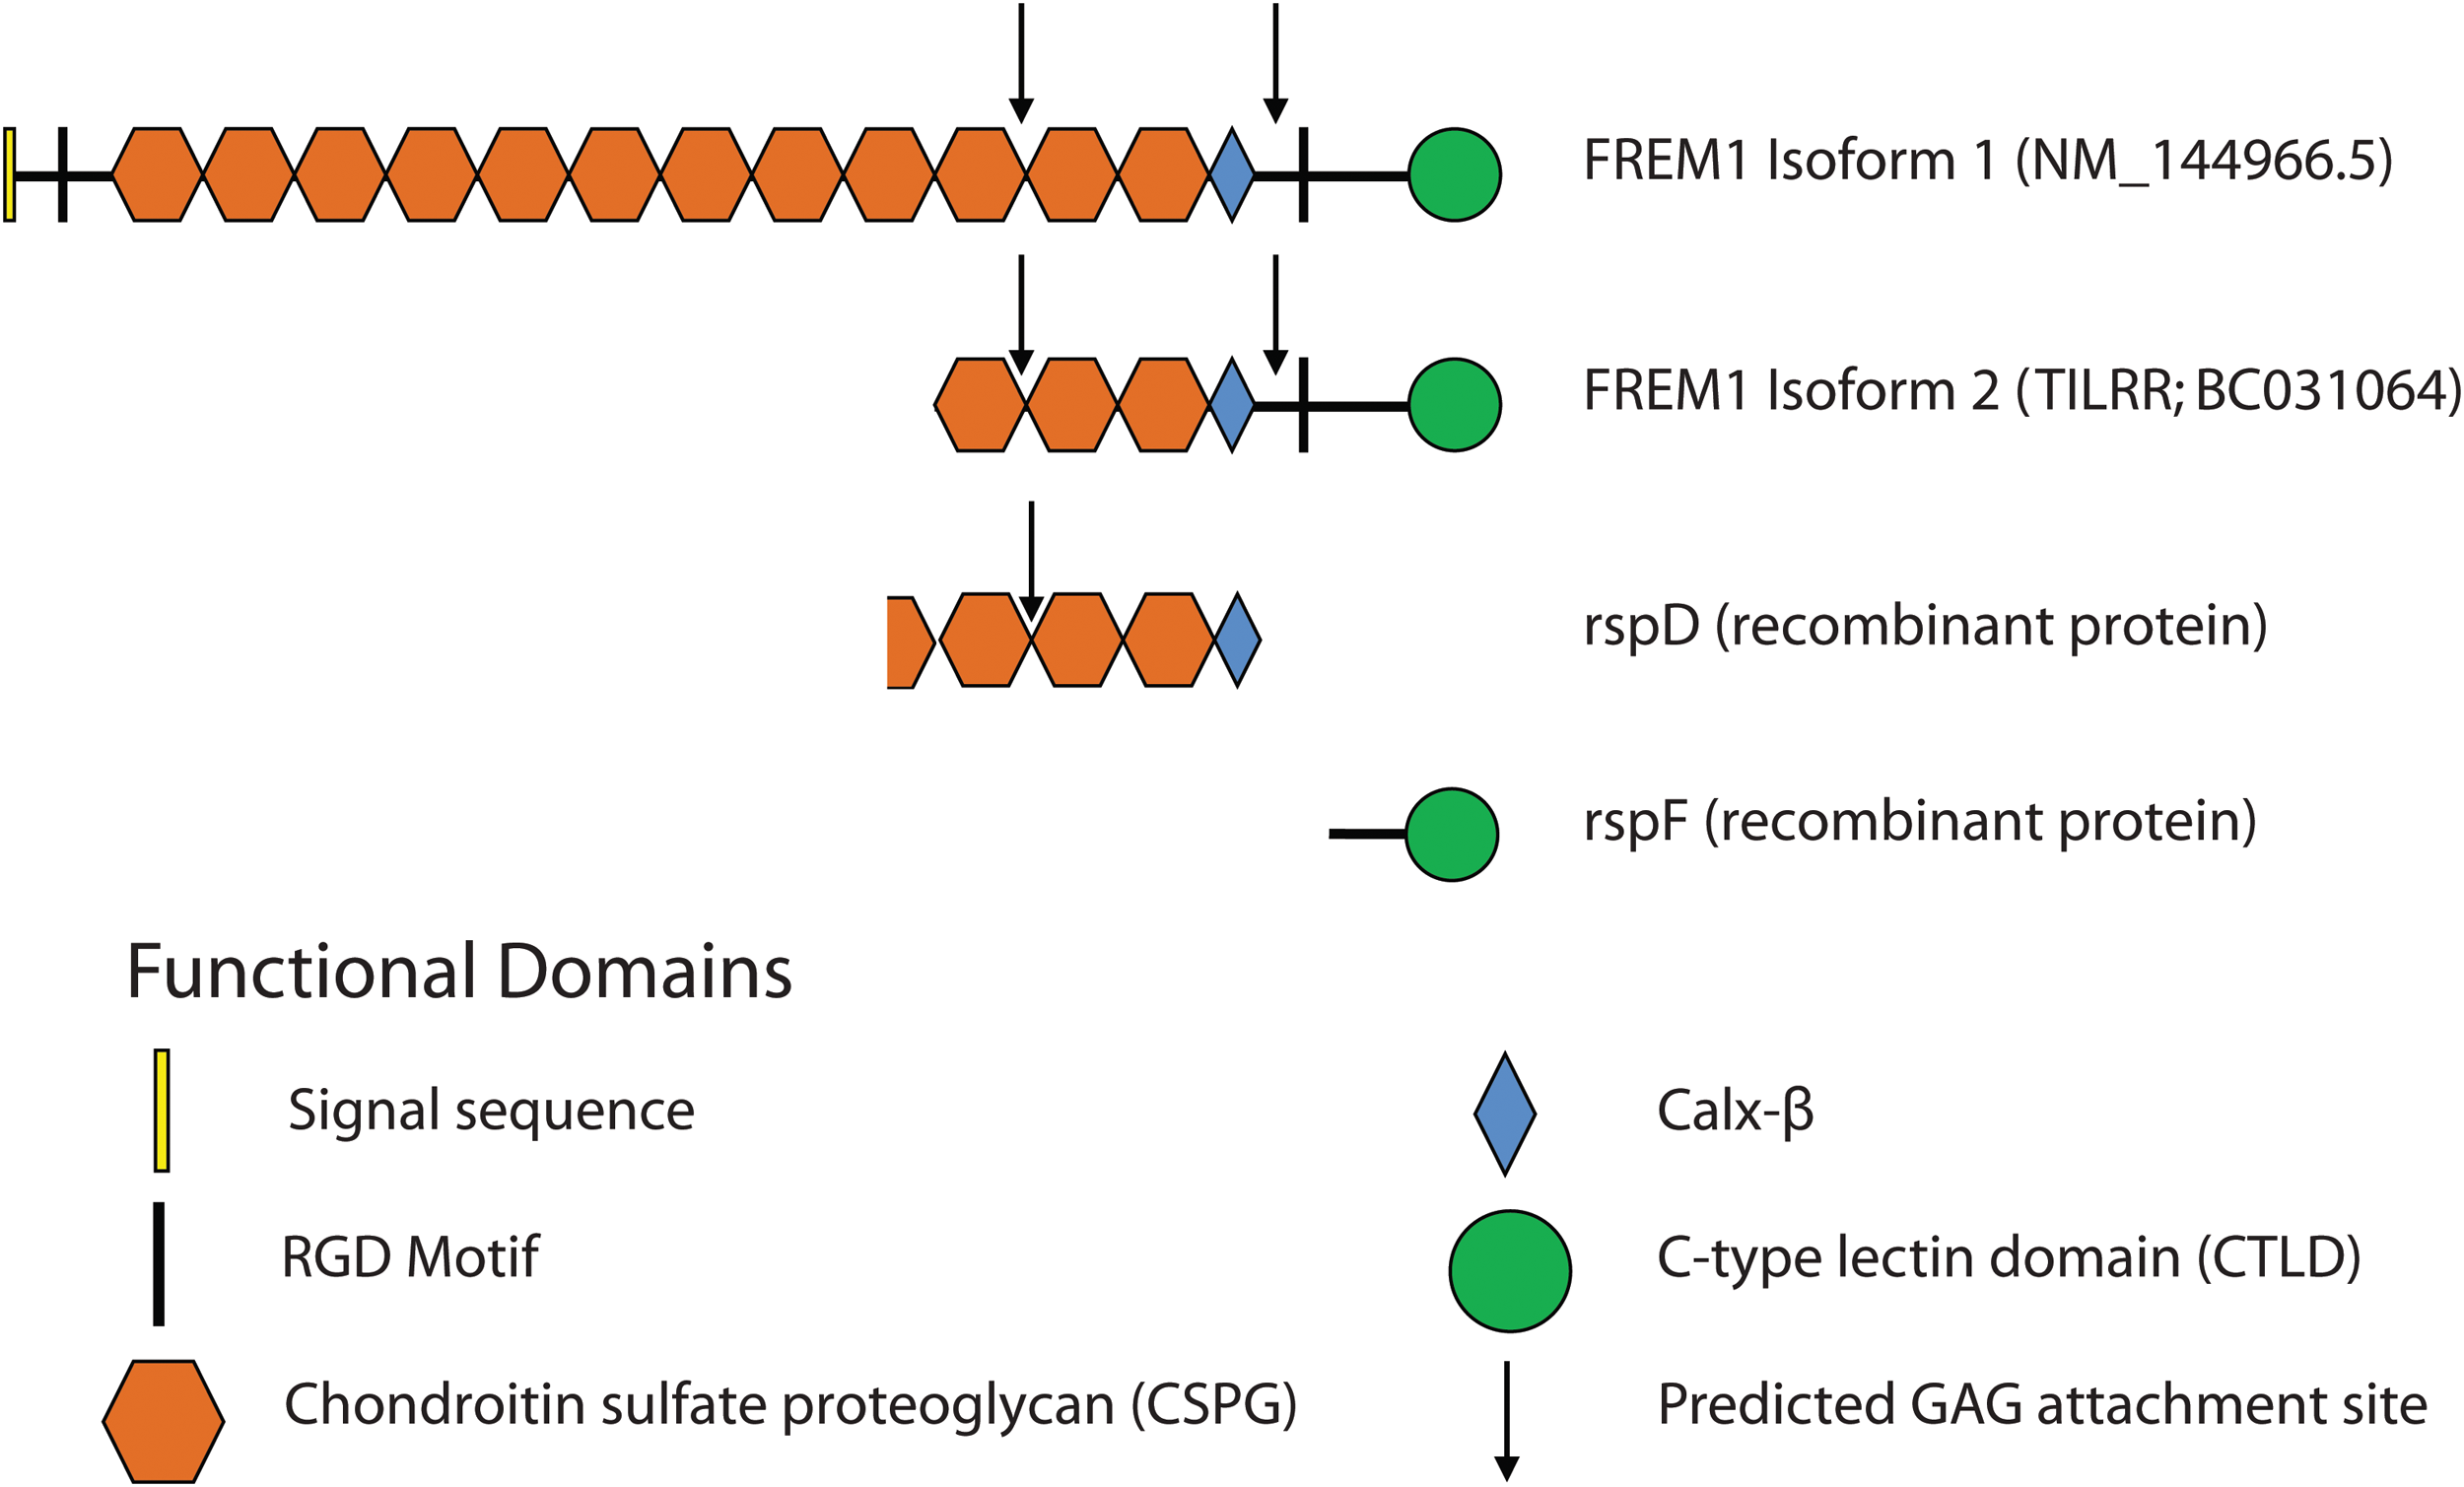
Schematic of structural motifs belonging to FREM1 canonical isoforms and recombinant protein constructs.
Recently, we have identified the minor allele of a SNP (rs1552896) within the FREM1 gene that is associated with natural resistance to HIV-1 infection in the Pumwani sex worker cohort.(11) To further study the role of FREM1 in differential susceptibility to HIV-1 infection, we have developed a panel of monoclonal antibodies. This study describes the epitope characterization of these FREM1-specific monoclonal antibodies and the utility of using these antibodies in immunohistochemistry and Western blot and FACS analyses.
Materials and Methods
Generation of recombinant FREM1 spD and spF
According to the AceView cDNA-supported gene and transcript annotation database, there are 15 alternative splicing variants for FREM1.(12) The splice variants D and F were chosen to generate recombinant proteins rspD (376 amino acids, 56.8 kDa) and rspF (255 amino acids, 29.5 kDa). The spD cDNA (based on CN425445, CD358093) contained three CSPG repeats and the Calx-β domain, whereas SpF (based on AK058190.1) contained only the CTLD. The sequence of the two recombinant proteins overlaps with FREM1 isoform 1 (NM_001177704) and most of isoform 2 (TILRR; NM_001177704) (Fig. 2). The spD and spF cDNA (Fig. 2) were synthesized (BlueHeron Biotechnology, Bothell, WA). To express rspD and rspF, the spD and spF cDNA sequences were reamplified by PCR with Kpn1 and Sal1 restriction enzyme sites incorporated into the primers and cloned into pQE-80L vector (Qiagen, Toronto, Canada). The forward and reverse primers used for spD cDNA amplification (restriction enzymes sites indicted by lowercase) were 5′-GCATGCGAGCTCggtaccGAGAAGATTTACTATGTATTTGAAAGGCTTCCCC-3′ and 3′-GACTAAGTCAAACTGGGTCGGTCGGTTTTCATCcagctgGACGTC-5′, respectively. For spF amplification, the forward and reverse primers were 5′-GCATGCGAGCTCggtaccGAGAAGATTTACTATGTATTTGAAAGGCTTCCCC-3′ and 3′-GACTAAGTCAAACTGGGTCGGTCGGTTTTCATCcagctgGACGTC-5′, respectively. The amplified PCR product was purified using High Pure PCR Product Purification kit (Roche, Indianapolis, IN) prior to vector cloning. Competent XL1-Blue strain E. coli (Agilent Technologies, Santa Clara, CA) were transformed and screened on LB agar plates in the presence of 100 μg/mL ampicillin. The plasmid DNA was isolated from the positive Escherichia coli clones using QIAprep® Spin Miniprep Kit (Qiagen) and validated by Sanger sequencing (Genomic Core, National Microbiology Laboratory, Public Health Agency of Canada).

FREM1 splice variants D and F cDNA insert into pQE-80L vector.
Expression and purification of recombinant FREM1 rspD and rspF protein
The spD or spF transformed E. coli was grown in 1 L volumes of LB broth in the presence of ampicillin (100 μg/mL) until an OD595nm of 0.6 to 0.8 was reached. 1 mM IPTG (isopropylthio-β-D-galactoside, Invitrogen, Burlington, Canada) was then added to the culture and shaken for an additional 4 h at 37°C. The cell pellets were collected after centrifugation at 5000 RPM for 10 min and stored at −80°C. The frozen cell pellets were reconstituted in phosphate buffered saline (PBS, pH 7.2) and sonicated for 2 min at maximum setting in 10 s pulses. The resulting lysates were pelleted by centrifuged at 20,000 g for 20 min at 4°C, then reconstituted in 6 M urea for 1 h with shaking to promote further solubilization. The resultant lysates were thrice washed with PBS, and pelleted at 20,000 g for 20 min at 4°C. Recombinant proteins were isolated using ProteoSpin™ Inclusion Body Protein Isolation Maxi Kit (Norgen Biotek, Thorold, Canada) and ProBond™ Nickel-chelating resin (Invitrogen) as per the manufacturer's instructions. Western blot with Penta-His HRP conjugate (Qiagen) antibodies was used for the immunodetection of rspD and rspF. SDS-PAGE was used to determine protein purity post-isolation. Protein identity was confirmed by mass spectrophotometer (Proteomics & Mass Spectrometry Core, National Microbiology Laboratory, Public Health Agency of Canada).
Immunization and cell fusion
Mice were immunized according to NCFAD standard operating procedures (ISO17025). Female BALB/c mice (5–6 weeks old; Charles River, Wilmington, NC) were immunized subcutaneously with 20 μg of rspD or rspF in PBS (pH 7.2) emulsified with an equal volume of complete Freund's adjuvant (CFA) (Difco, Mississauga, Canada). The mice were boosted subcutaneously with 20 μg of rspD or rspF emulsified in incomplete Freund's adjuvant (IFA, Difco) at days 28, 56, 84, and 112. Positive antibody response was confirmed on day 126 and the mice were further boosted by intraperitoneal injection of 5 μg of rspD or rspF in 100 μL PBS at 3 days prior to cell fusion. The mice spleens were harvested aseptically and single cell suspension was prepared. Splenocytes were fused with P3X63Ag8.653 myeloma cells (ATCC, Rockville, MD) in the presence of polyethylene glycol 1500 (Roche, Basel, Switzerland).
Screening for rspD and rspF specific hybridomas
Hybridomas were generated as described previously.(13) Two weeks after cell fusion, clones were screened for antigen specificity to rspD or rspF by indirect ELISA. 96-well ELISA plates (Nunc, Grand Island, New York) were coated with either bovine serum albumin (BSA) (800 μg/well) or antigen (rspD or rspF; 100 ng/well) in PBS overnight at 4°C, then blocked with 0.2% skim milk and 0.2% FBS in PBS (pH 7.4) for 2 h at 37°C. Hybridoma culture supernatants were incubated on antigen-coated plates at 37°C for 2 h. Immunized and pre-immunized mouse sera at 1:4000 dilutions were used as positive and negative controls, respectively. After incubation, plates were washed 8X with Milli-Q® filtered water. The secondary antibody horse-radish peroxidase (HRP)-conjugated goat anti-mouse IgG (Southern Biotechnology, Birmingham, AL) was prepared in 1:2000 dilution in PBS, 0.1% skim milk, 0.1% FBS, and 0.05% Tween-20. The plates were incubated in secondary antibody at 37°C for 1 h and then washed as described previously. The color reaction was developed with ABTS (Roche) and quantified at 405 nm using a microplate reader (Molecular Devices, Sunnyvale, CA).
Antibody production and purification
The positive hybridoma clones were cultured and expanded in 500 mL serum-free media Hyclone HyQ CCM1 (Thermo Fisher Scientific, HyClone, Logan, UT) with 1% glutamine, 1% antibiotic/antimycotic, 0.3% hybridoma fusion cloning supplement (Roche) on roller bottles (Greiner Bio-One, Frickenhausen, Germany). The culture supernatants were harvested at 7–10 days and concentrated 10-fold with Amicon™ 8400 stirred-cell Ultrafiltration-nitrogen concentrators with a Centriprep™ YM-30 membrane (Millipore, Billerica, MA). The MAbs were purified with HiTrap™ Protein A HP or Protein G HP columns (GE HealthCare, Mississauga, Canada), as per the manufacturer's instructions. Buffer was exchanged with PBS using Centriprep™ YM-30 Centrifugal Filter Units (Millipore).
Validation of antibody specificity
Antibody specificity to FREM1 splicing variants was validated by Western blot analysis. The purified rspD and rspF (2 μg/well), under reducing conditions, were resolved by SDS-polyacrylamide gel electrophoresis (PAGE) using 4–20% Tris-HCl Criterion™ Precast gels (Bio-Rad, Mississauga, Canada) and transferred onto polyvinylidene fluoride (PVDF) membranes (Millipore) by electroblotting. The membranes were blocked with 3% BSA in Tris-buffered saline (TBS) for 1 h at room temperature and then incubated with hybridoma culture supernatants overnight at 4°C. The membrane was washed thrice with TBS and 0.05% Tween-20 (TBST) for 10 min each. The secondary antibody 1:3000 HRP-conjugated goat anti-mouse IgG (Southern Biotechnology) in TBST was incubated with the membrane for 1 h while protected from light, washed as described previously, then developed using DAB substrate (Pierce Biotechnology, Rockford, IL).
Antibody isotyping
The murine isotyping dipstick test (Roche) was used to determine the antibody isotypes of the hybridoma clones, as per the manufacturer's instructions.
Epitope mapping by pepscan
Two linear peptide libraries, known as “pepsets,” were synthesized on polyethylene pins to form “pepblocks” (Pepscan presto, Lelystad, Finland). The spD and spF pepsets consisted of 95 and 50 15-mer peptides overlap by 10 amino acids, respectively. To facilitate specific coupling onto the polyethylene substrate, an extra cysteine residue was added to the C-terminal of each of the synthesized peptides, and internal cysteines were substituted with other residues such as alanine. The epitope mapping by pepscan strategy was conducted as described by others.(14)
The assay was carried out in a 96-well ELISA plate format. The pin-peptides were blocked with 4% w/v skim milk in PBS (200 μL/well) for 3 h, followed by 5 min wash with washing buffer (0.9% w/v sodium chloride, 0.05% v/v Tween-20) at room temperature. The pins were incubated with primary antibody diluted in 2% w/v skim milk containing 0.1% v/v Tween-20 in PBS overnight at 4°C, followed by three 10 min washes with shaking set at 100 RPM. The secondary antibody HRP-conjugated goat anti-mouse IgG (1:5000 in 2% w/v skim milk, 0.1% v/v Tween-20; Southern Biotechnology) was added and incubated for 3 h, washed thrice, and developed with ABTS (Roche). The color reaction was quantified at 405 nm using a microplate reader (Molecular Devices).
Human cell lines, culture media, and reagents
FREM1 expression was tested in three human long-term cultured (LTC) cell lines: (1) human embryonic kidney cell derivative 293Freestyle™ (Invitrogen), (2) HeLa 229 human cervical epithelial cells (ATCC, Manassas, VA), and (3) Sup-T1 human T lymphoblasts (provided by Dr. John Rutherford, Department of Medical Microbiology, University of Manitoba). The 293Freestyle cells were cultured following the manufacturer's instructions. The HeLa 229 human cervical epithelial cells and CD4+ SupT1 human T-cells were maintained in DMEM (Invitrogen) and RMPI 1640 (Invitrogen) media, respectively, supplemented with 10% FBS and 25 μg/mL penicillin.
Visualization of cell surface expression of FREM1 with immunofluorescent microscopy
Immunohistochemistry was used to visualize FREM1 surface protein expression using F218G1, F237G1, and F244G1 FREM1-specific monoclonal antibodies in human LTC cell lines. HeLa 229, Sup-T1, and 293Freestyle cells (1×10⁵ cells) were loaded on to glass slides by Cytospin® (Thermo Scientific Shandon, Waltham, MA) cytocentrifuge. Cell monolayers were fixed with Cell-Fixx™ Spray Fixative (Thermo Scientific Shandon) and dried for 5 min. The wax coating was removed by soaking slides in 95% alcohol for 15 min prior to staining. The slides were rinsed with PBS and blocked with 50% of human serum AB plasma (Sigma Life Science, Oakville, Canada) and 1% BSA in FcR blocking reagent (Miltenyi Biotec, Auburn, CA) at room temperature for 2 h. Slides were incubated overnight at 4°C with anti-spD (F218G1 or F237G1) or anti-spF (F244G1) MAbs or with an isotype control MAb (anti-CT-456, a gift from Dr. Grant McClarty, University of Manitoba) specific for a Chlamydia trachomatic antigen. The slides were incubated with a secondary antibody rat anti-mouse IgG-FITC (eBioscience, San Diego, CA) in TBST buffer for 3 h at room temperature after washing with TBST. The resultant slides were coated with mounting medium and examined with a fluorescence microscope (Olympus Canada, Toronto, Canada) after washing and air-drying.
Quantification of FREM1 expressing cells with flow cytometry
The proportion of FREM1 expressing cells was quantified by flow cytometry. The human LTC cell lines were grown at 37°C for 48 h and harvested by centrifugation at 1000 RPM for 10 min. Cells were washed twice with ice-cold PBS and treated with 50% human AB plasma (Sigma) and 1% BSA in human FcR blocking reagent (Mitenyi Biotec) for 2 h at 4°C to block nonspecific binding. Cultures were then incubated at 4°C overnight with diluted anti-spD (F218G1, F237G1) or anti-spF (F244G1) or with the isotype control MAb (anti-CT 456), followed by two washes with ice-cold PBS containing 2% FCS and 1 mM EDTA buffer. FITC-conjugated rat anti-mouse IgG (eBioscience, San Diego, CA) was incubated with the cultures at 4°C for 3 h, followed by washing and fixing using 100 μL of IC Fixation Buffer (eBioscience). BD™ LSR II flow cytometer (BD Biosciences, San Jose, CA) was used for cell sorting and FCS Express V3 software (De Novo, Los Angeles, CA) for data analysis.
Data analysis
Microsoft Excel was used to calculate the ELISA signal-to-noise thresholds and Clustal Omega was used to align cDNA, MAb epitope, and literature FREM1 isoform sequences.(15,16)
Results
Validation of FREM1 recombinant protein expression by Western blot analysis
FREM1 recombinant proteins rspD and rspF were discriminated from bacterial proteins by their polyhistidine tag. Lysates of E. coli transformed by pQE80L vector alone does not produce polyhistidine-containing proteins as shown by the absence of protein bands in polyhistidine Western blot results (Fig. 3B). However, the lysates of E. coli transformed by pQE80L containing the spD or spF insert showed protein bands that correspond to the expected molecular weight of rspD (56.8 kDa) and rspF (29.5 kDa) (Fig. 3E,H). Elongation factor Tu Western blot was used as a control for the presence of bacterial proteins (Fig. 3C,F,I), and SDS-PAGE was used to visualize the full protein profile (Fig. 3A,D,G). Ni2+-chelating affinity chromatography removed the majority of bacterial proteins for the isolation of rspD, as demonstrated by the absence of protein bands in EFTu Western blot (Fig. 3F) in the spD-pQE80L transformed E. coli despite their presence in the unpurified E. coli lysates (Fig. 3C). Residual bacterial components could be seen in partially purified rspF protein, as indicated by the presence of bands in the EFTu Western blot (Fig. 3I). The identity of rspD and rspF was confirmed as FREM1 by mass spectroscopy analysis of the excised major protein bands from rspD and rspF SDS-PAGE (Fig. 3D,G) after chymotrypsin digestion.
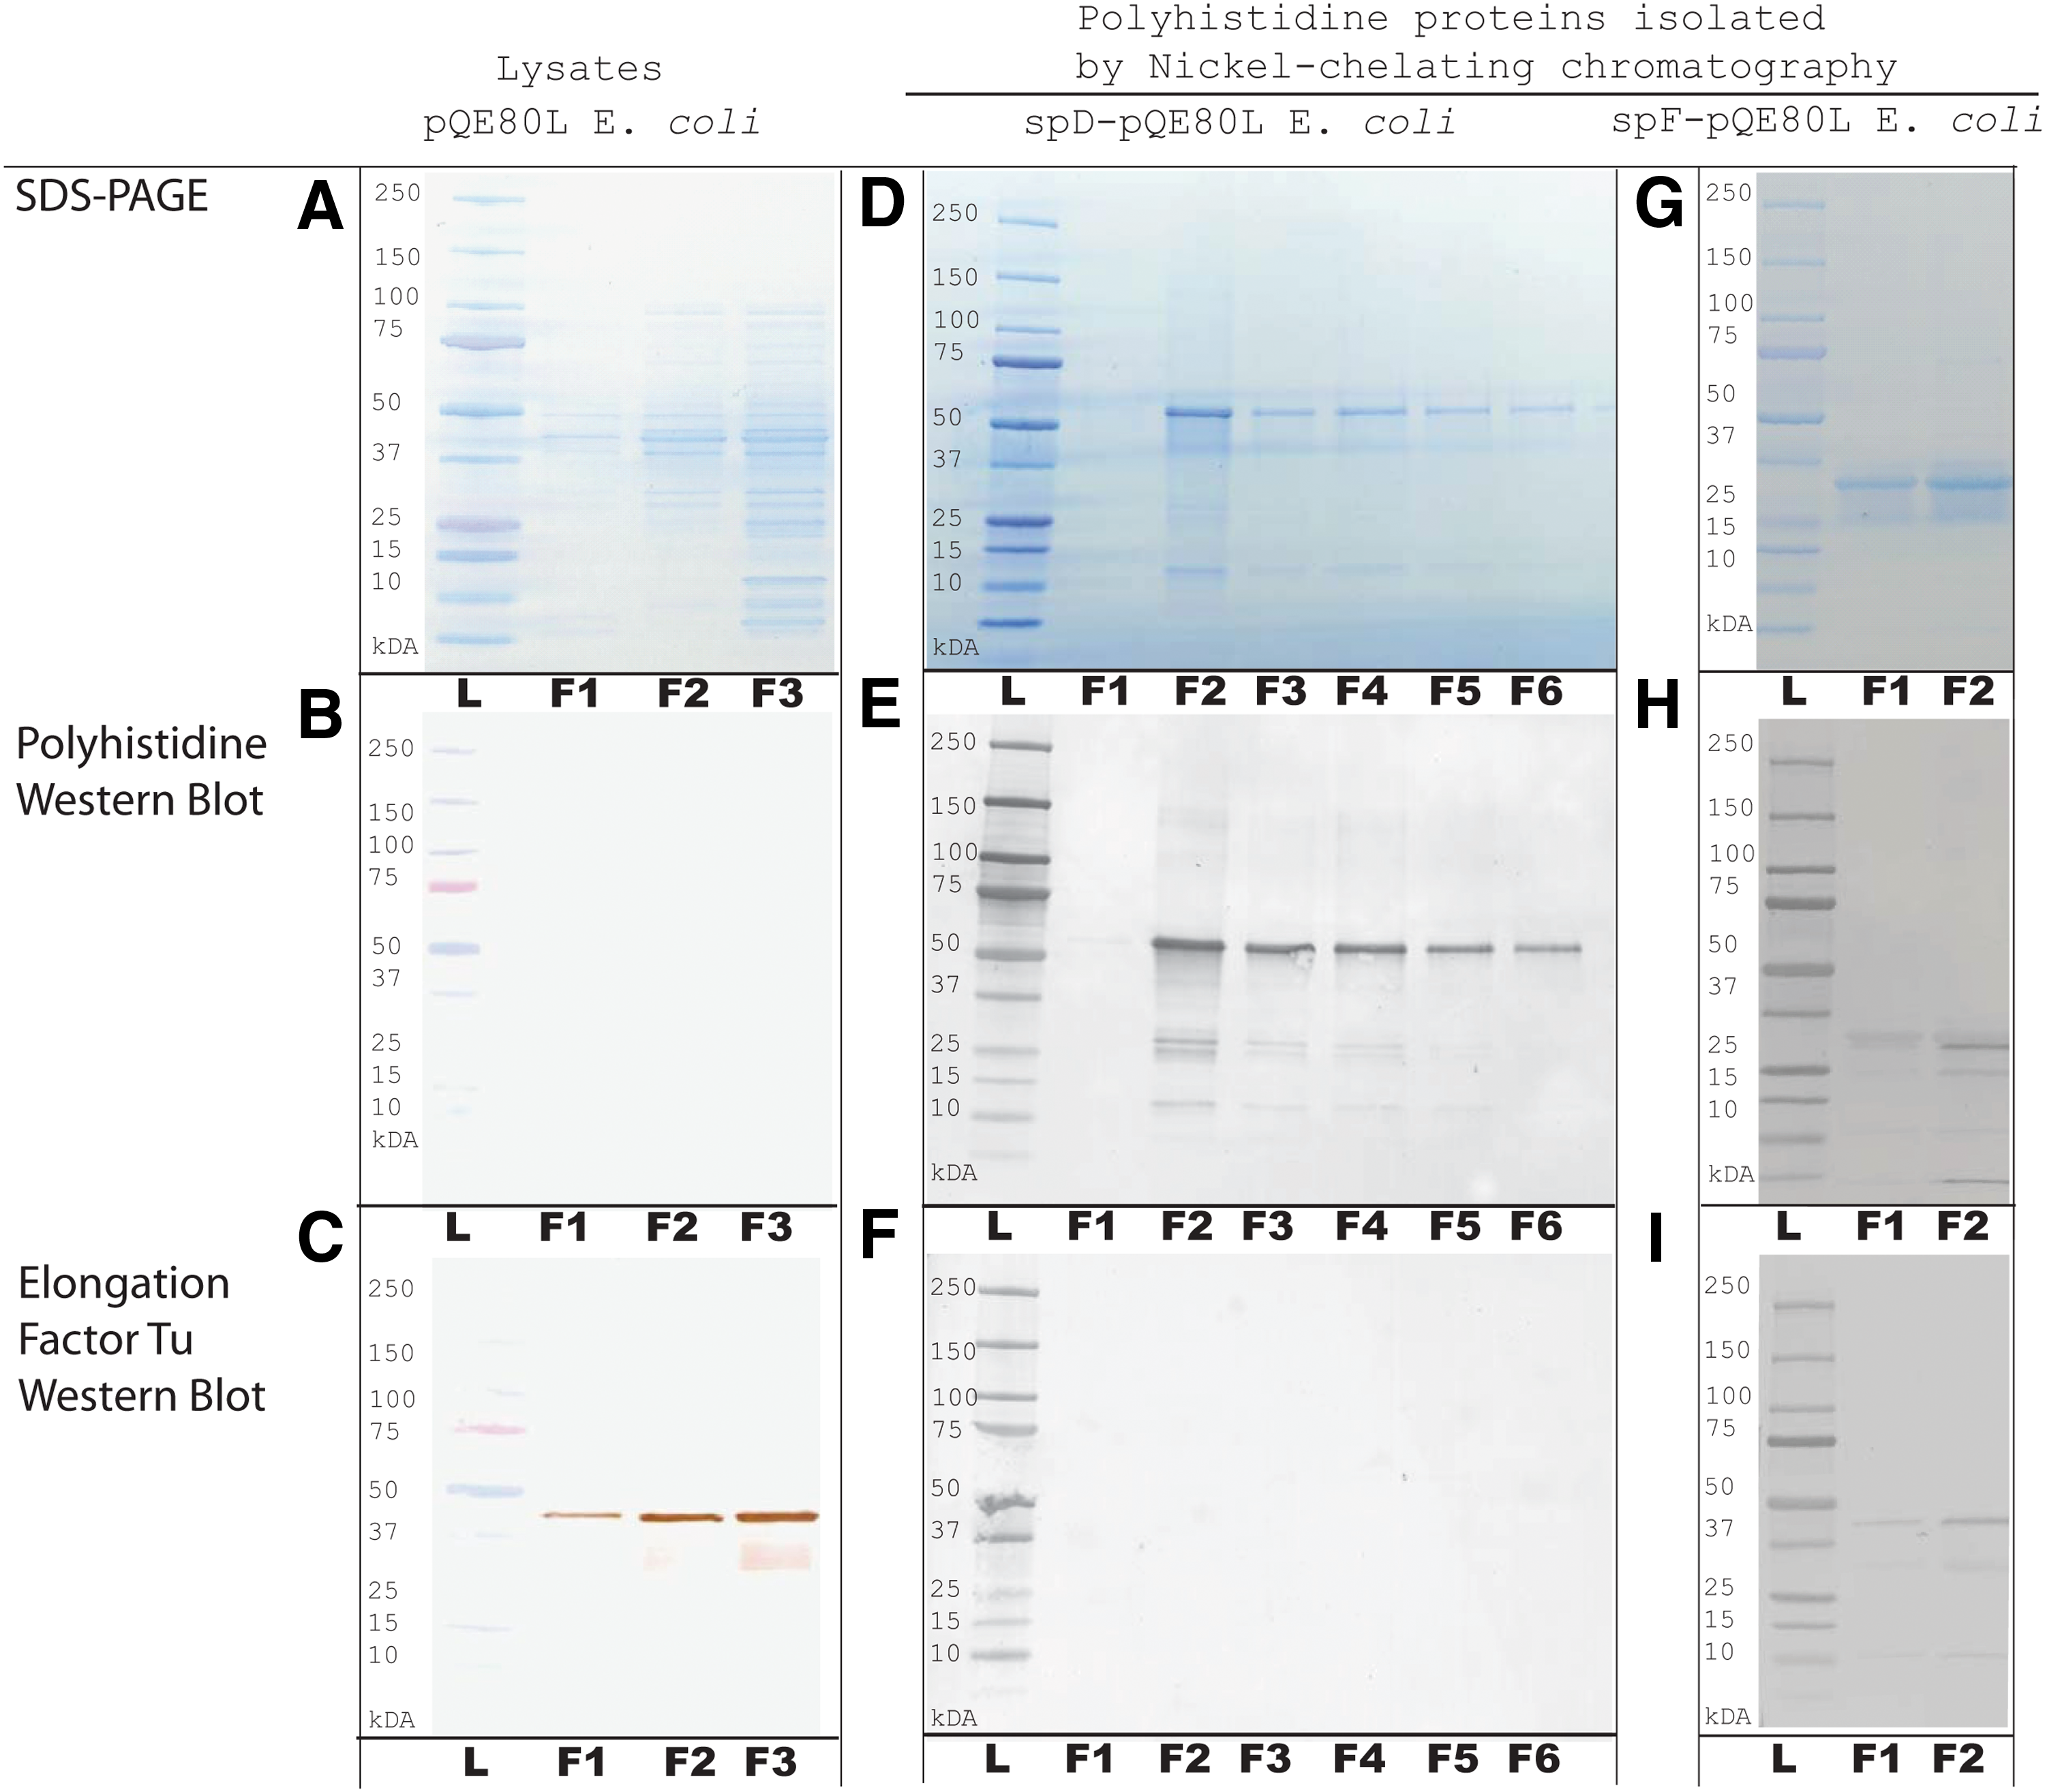
SDS-PAGE and Western blot (WB) staining for recombinant FREM1 proteins in pQE-80L vector transformed Escherichia coli. Whole cell lysates from E. coli transformed by pQE80L vector without cDNA insert (
FREM1-specific monoclonal antibodies
Overall, 16 FREM1-specific hybridoma clones were generated and isolated from rspD immunized mice, whereas only one hybridoma clone was obtained after rspF immunization. This may be due to the poorer immunogen purity of rspF compared to rspD, which would have skewed the mouse immune response against the impurities. An alternative explanation would be that the smaller size (29.5 vs. 56.8 kDa) of rspF was less immunogenic than rspD. Specificity of antibodies to FREM1 was validated by Western blot against the immunogen (Fig. 4), and by pin-peptide ELISA against synthesized overlapping peptides of the spD or spF sequence (Supplementary Fig. 1). All 17 monoclonal antibodies were IgG classes, with the predominant isotype being IgG1/κ, followed by IgG2a/κ and IgG1/λ (Table 1).

Western blot validation of monoclonal antibody specificity against rspD and rspF FREM1 recombinant proteins. 2 μg of FREM1-specific monoclonal antibodies [(
The listed OD405nm measurements of epitope-antibody combinations were ≥10σ above the sample mean of the particular antibody against the pep-block, with exceptions denoted by † in which 10σ≥×≥3σ above mean were observed
Monoclonal antibody epitope characterization
Peptide scanning strategy was used to identify monoclonal antibody epitopes (ELISA data can be found in Supplementary Fig. 1). To define the occurrence of antibody-peptide binding, the pin-peptide ELISA signal-to-noise threshold was set to

where “×” was the ELISA measurement for a particular antibody-peptide combination, “μMAb” was the mean ELISA measurements of a particular antibody against the pepblock, and “σnaïve” was the measurement variation of treatment naïve mouse sera against the pepblock. Major epitope were defined as the amino acid sequence comprised of a single or group of flanking overlapping peptides that met or exceeded the set signal-to-noise threshold and was inclusive of the peptide with the signal maxima for the tested antibody against the relevant pepset. The minor epitope was defined as the amino acid sequence of any peptide or group of flanking peptides that exceeded the significance threshold, but was not inclusive of the peptide with the signal maxima.
Of the 17 FREM1-specific monoclonal antibodies, major epitopes were defined in seven unique regions within the CSPG 9, CSPG 10, CSPG 11, Calx-β, and C-lectin domains. Regions of the CSPG 12 domain were only weakly interrogated by the antibody panel. The epitope map is depicted on Figure 5 and summarized on Tables 1 and 2.
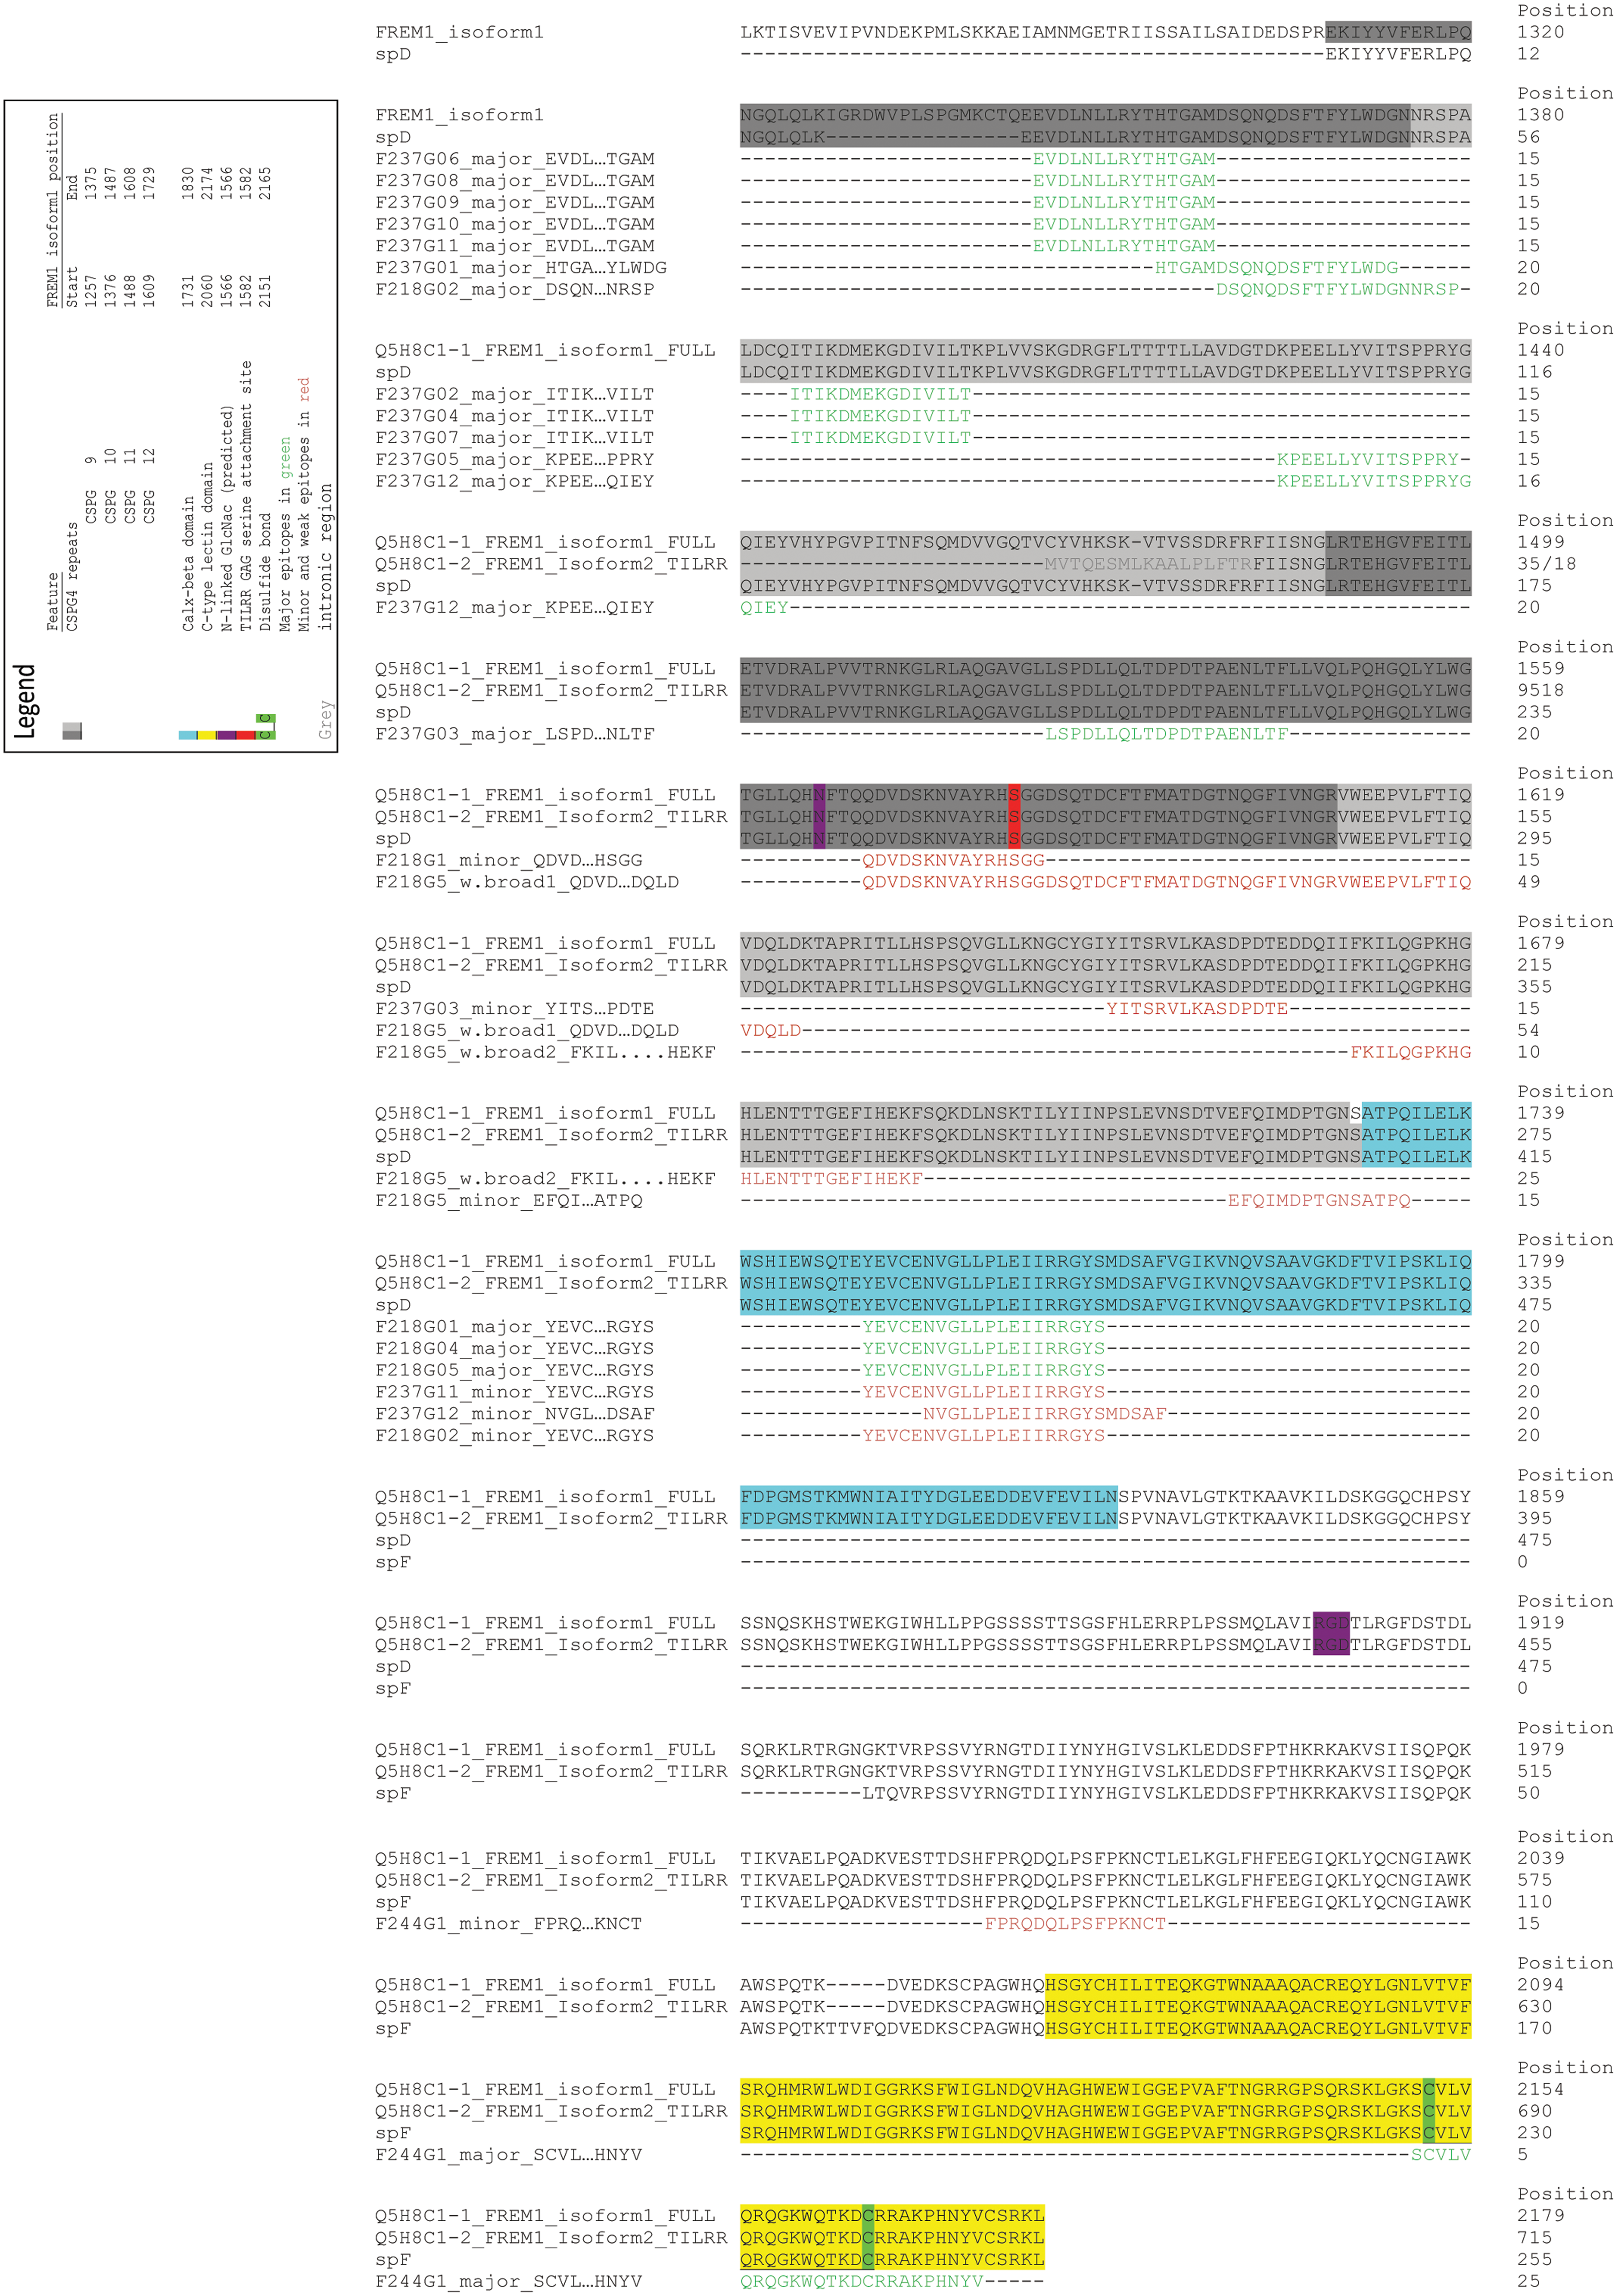
FREM1-specific monoclonal antibody epitopes mapped to FREM1 isoform sequences and domain features taken from UniProtKB/Swiss-Prot. Clustal Omega was used to overlay polypeptide sequence of FREM1 isoforms 1 and 2, recombinant proteins spD and spF, and determined monoclonal antibody epitopes. Major antibody epitopes are in green, and minor epitopes in red. Protein features are colored in accordance with the figure legends on the FREM1 canonical sequences and are taken from UniProtKB/Swiss-Prot database.
The listed OD405nm measurements of epitope-antibody combinations were ≥10σ above the sample mean of the particular antibody against the pep-block, with exceptions denoted by † in which 10σ≥×≥3σ above mean were observed
Evaluating MAb binding strength based on absolute measured fluorescence between ELISA plates is ill-advised since input quantities of MAbs were not standardized. Yet, if the MAbs had supersaturated the peptide binding sites for all assays, this would not matter. We did not test whether this was the case; thus caution should be exercised if the data were to be construed for this purpose. Regardless, qualitative assessment of antibody epitopes identity was valid.
The negative control pin-peptide ELISA for spD and spF provides a measure of background fluorescence, which was 0.114±0.009 and 0.078±0.003 units of OD405nm, respectively (Supplementary Fig. 1A,D). The mean background fluorescence varied from plate to plate; thus, we reasoned it was not appropriate to use the negative control median as the background baseline; rather the median fluorescence for each particular plate was used. The within plate variation for the negative controls was assumed to be measurement variation and thus was used to set the upper bounds threshold for a significant signal-to-noise ratio. Typically, the determined epitopes were supported by positive binding to one peptide or two overlapping peptides. For scenarios where epitopes were supported by binding to two peptides, the minimum epitope for binding can be further deduced to a resolution of 10 residues by comparison of the common overlay between positive peptides. Furthermore, the peptide sequence, when read left-to-right, was oriented as follows: NH2-peptide-COOH-substrate, which is relevant since others have noted epitope residues most proximal to the polyethylene pin substrate would not contribute to a positive binding reaction due to steric limitation of MAb accessibility.(17) This additional information may be useful if further deduction of the minimum epitope is necessary.
Interestingly, not all MAbs have only one epitope or contact point. Some MAbs have a minor epitope or, in the case of F218G5, recognize a broad region weakly. Whether this is due to MAb cross-reactivity or reveals structural information such as geometric proximity of regions in natively folded protein warrants further investigation.(14)
The pepscan analysis (Table 2) showed that CSPG 9 domain has three major epitopes for seven MAbs. F237G6 and G8-11 MAbs recognized EVDLNLLRYTHTGAM, F237G1 recognized DSQNQDSFTF, and F218G2 recognized DSFTFYLWDG. CSPG 10 domain has two major epitopes for five MAbs. F237G2, G4, and G7 recognized ITIKDMEKGDIVILT, F237G5 recognized KPEELLYVITSPPRY, and F237G12 recognized LYVITSPPRY. CSPG 11 had only one major epitope, LLQLTDPDTPA, which was recognized only by MAb F237G3. However other regions of the CSPG 11 were weakly interrogated by F218G1 and G218G5 MAbs as well. Peptide QDVDSKNVAYRHSGG was the minor epitope of F218G1 and was also the strongest binding portion of the G218G5 broad epitope. CSPG 12 domain had minor epitopes for F237G3 and F218G5 MAbs and no major epitopes. The Calx-β domain had one epitope NVGLLPLEII recognized by three MAbs, F218G1, G4, and G5. Only one MAb, F244G1, was raised against the CTLD and the major epitope was WQTKDCRRAKPHNYV.
Immunostaining and FACS analysis using developed MAbs
The suitability of these MAbs as reagents for FACS analysis and immunohistochemistry was demonstrated through their utility in detecting FREM1 in long-term cultured (LTC) human cell lines. Three MAbs were selected based on their epitopes: (1) CSPG 9 domain-specific MAb F237G1, (2) Calx-β CSPG 11 domain-specific MAb F218G1, and (3) CTLD domain-specific MAb F244G1. Three cell lines including embryonic kidney derived 293F, T-lymphoblast derived Sup-T1, and cervical epithelial–derived HeLa human LTC cell lines were used for the analysis. Chlamydia trachomatis-specific MAb CT456 was used as a negative control for non-specific binding and fluorescence. The SupT1 and HeLa cell types were chosen due to their representation of the cell types relevant to HIV-1 heterosexual transmission.
Immunohistochemistry staining detected surface FREM1 protein expression in all cell lines (293F, HeLa, and SupT1) using F237G1 and F218G1 MAbs (Fig. 6A,B), but not with F244G1 or CT456 negative control MAbs (Fig. 6C,D). This was consistent with the FACS results. The proportion of cells expressing FREM1 was determined to be 84.0% and 89.9% of 293F cells (Fig. 7A,B); 90.2% and 97.8% of SupT cells (Fig. 7D,E); and 61.3% and 64.4% of HeLa (Fig. 8G,H) using F237G1 and F218G1 MAbs, respectively. F237G1 MAb (CSPG 9 domain-specific) only interrogates epitopes for FREM1 isoform 1 (Q5H8C1-1) but not 2 (Q5H8C1-2), while F244G1 (CTCD domain-specific) and F237G1 (Calx-β/CSPG 11) interrogates epitopes inclusive of both isoforms 1 and 2 (Fig. 5). In contrast, proportion of cells stained by F244G1 ranged from 0.11 to 0.34% for all tested cell lines (Fig. 7C,F,I).
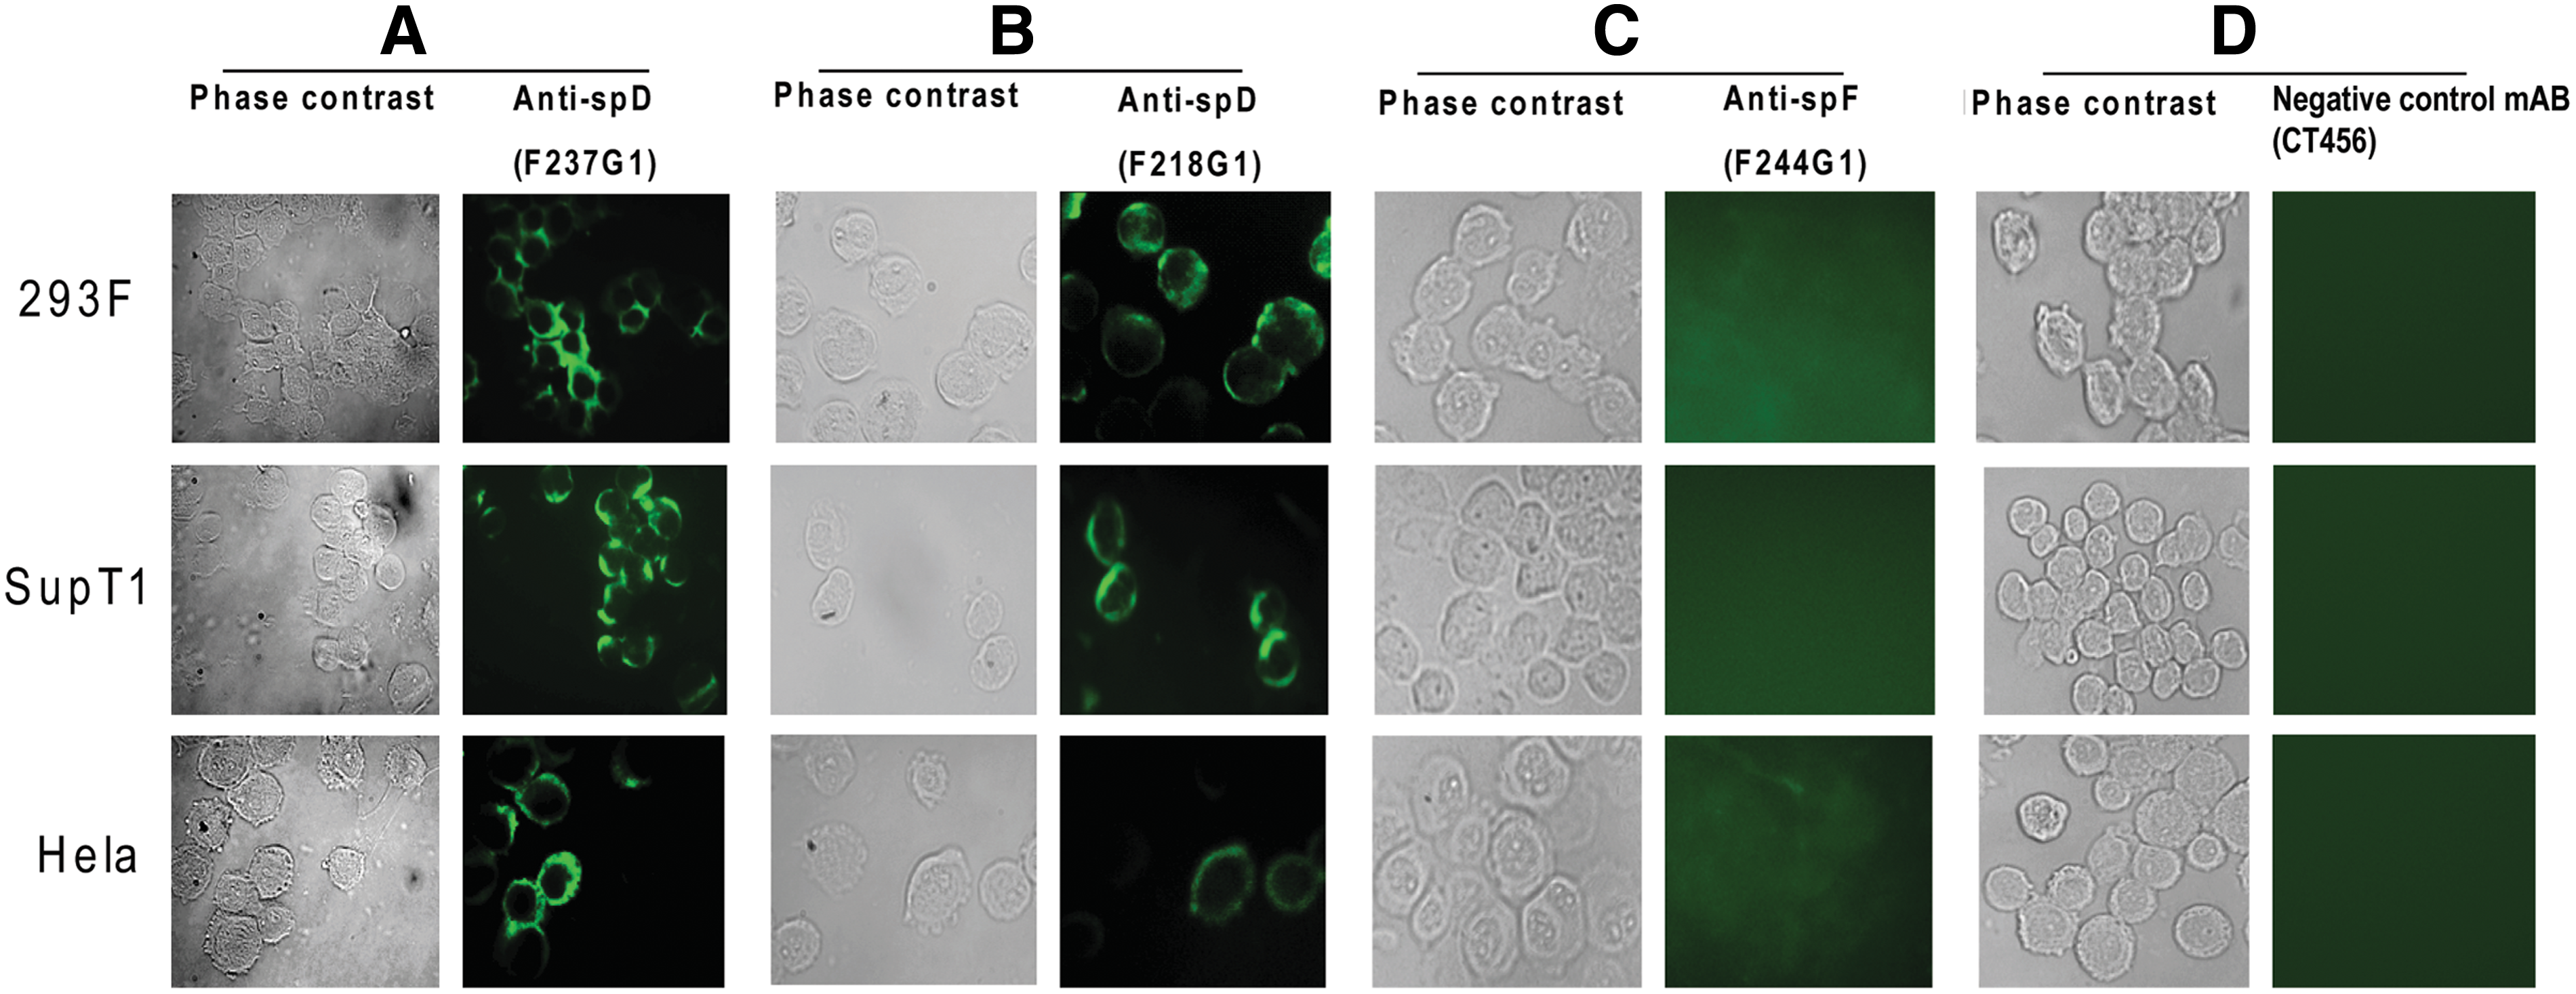
Positive staining of cell lines by anti-spD but not anti-spF MAb in immunofluorescence microscopy. Cultured human cell lines (HeLa, Sup-T1, and 293F) were loaded on slides by cytospin and stained by two anti-spD (F218G1, F237G1) MAbs, the anti-spF F244G1 MAb, or an irrelevant isotype control MAb. The secondary antibody was rat anti-mouse IgG conjugated with FITC. The phase contrast images of the cells are shown at left. Data are representative of three separate experiments.
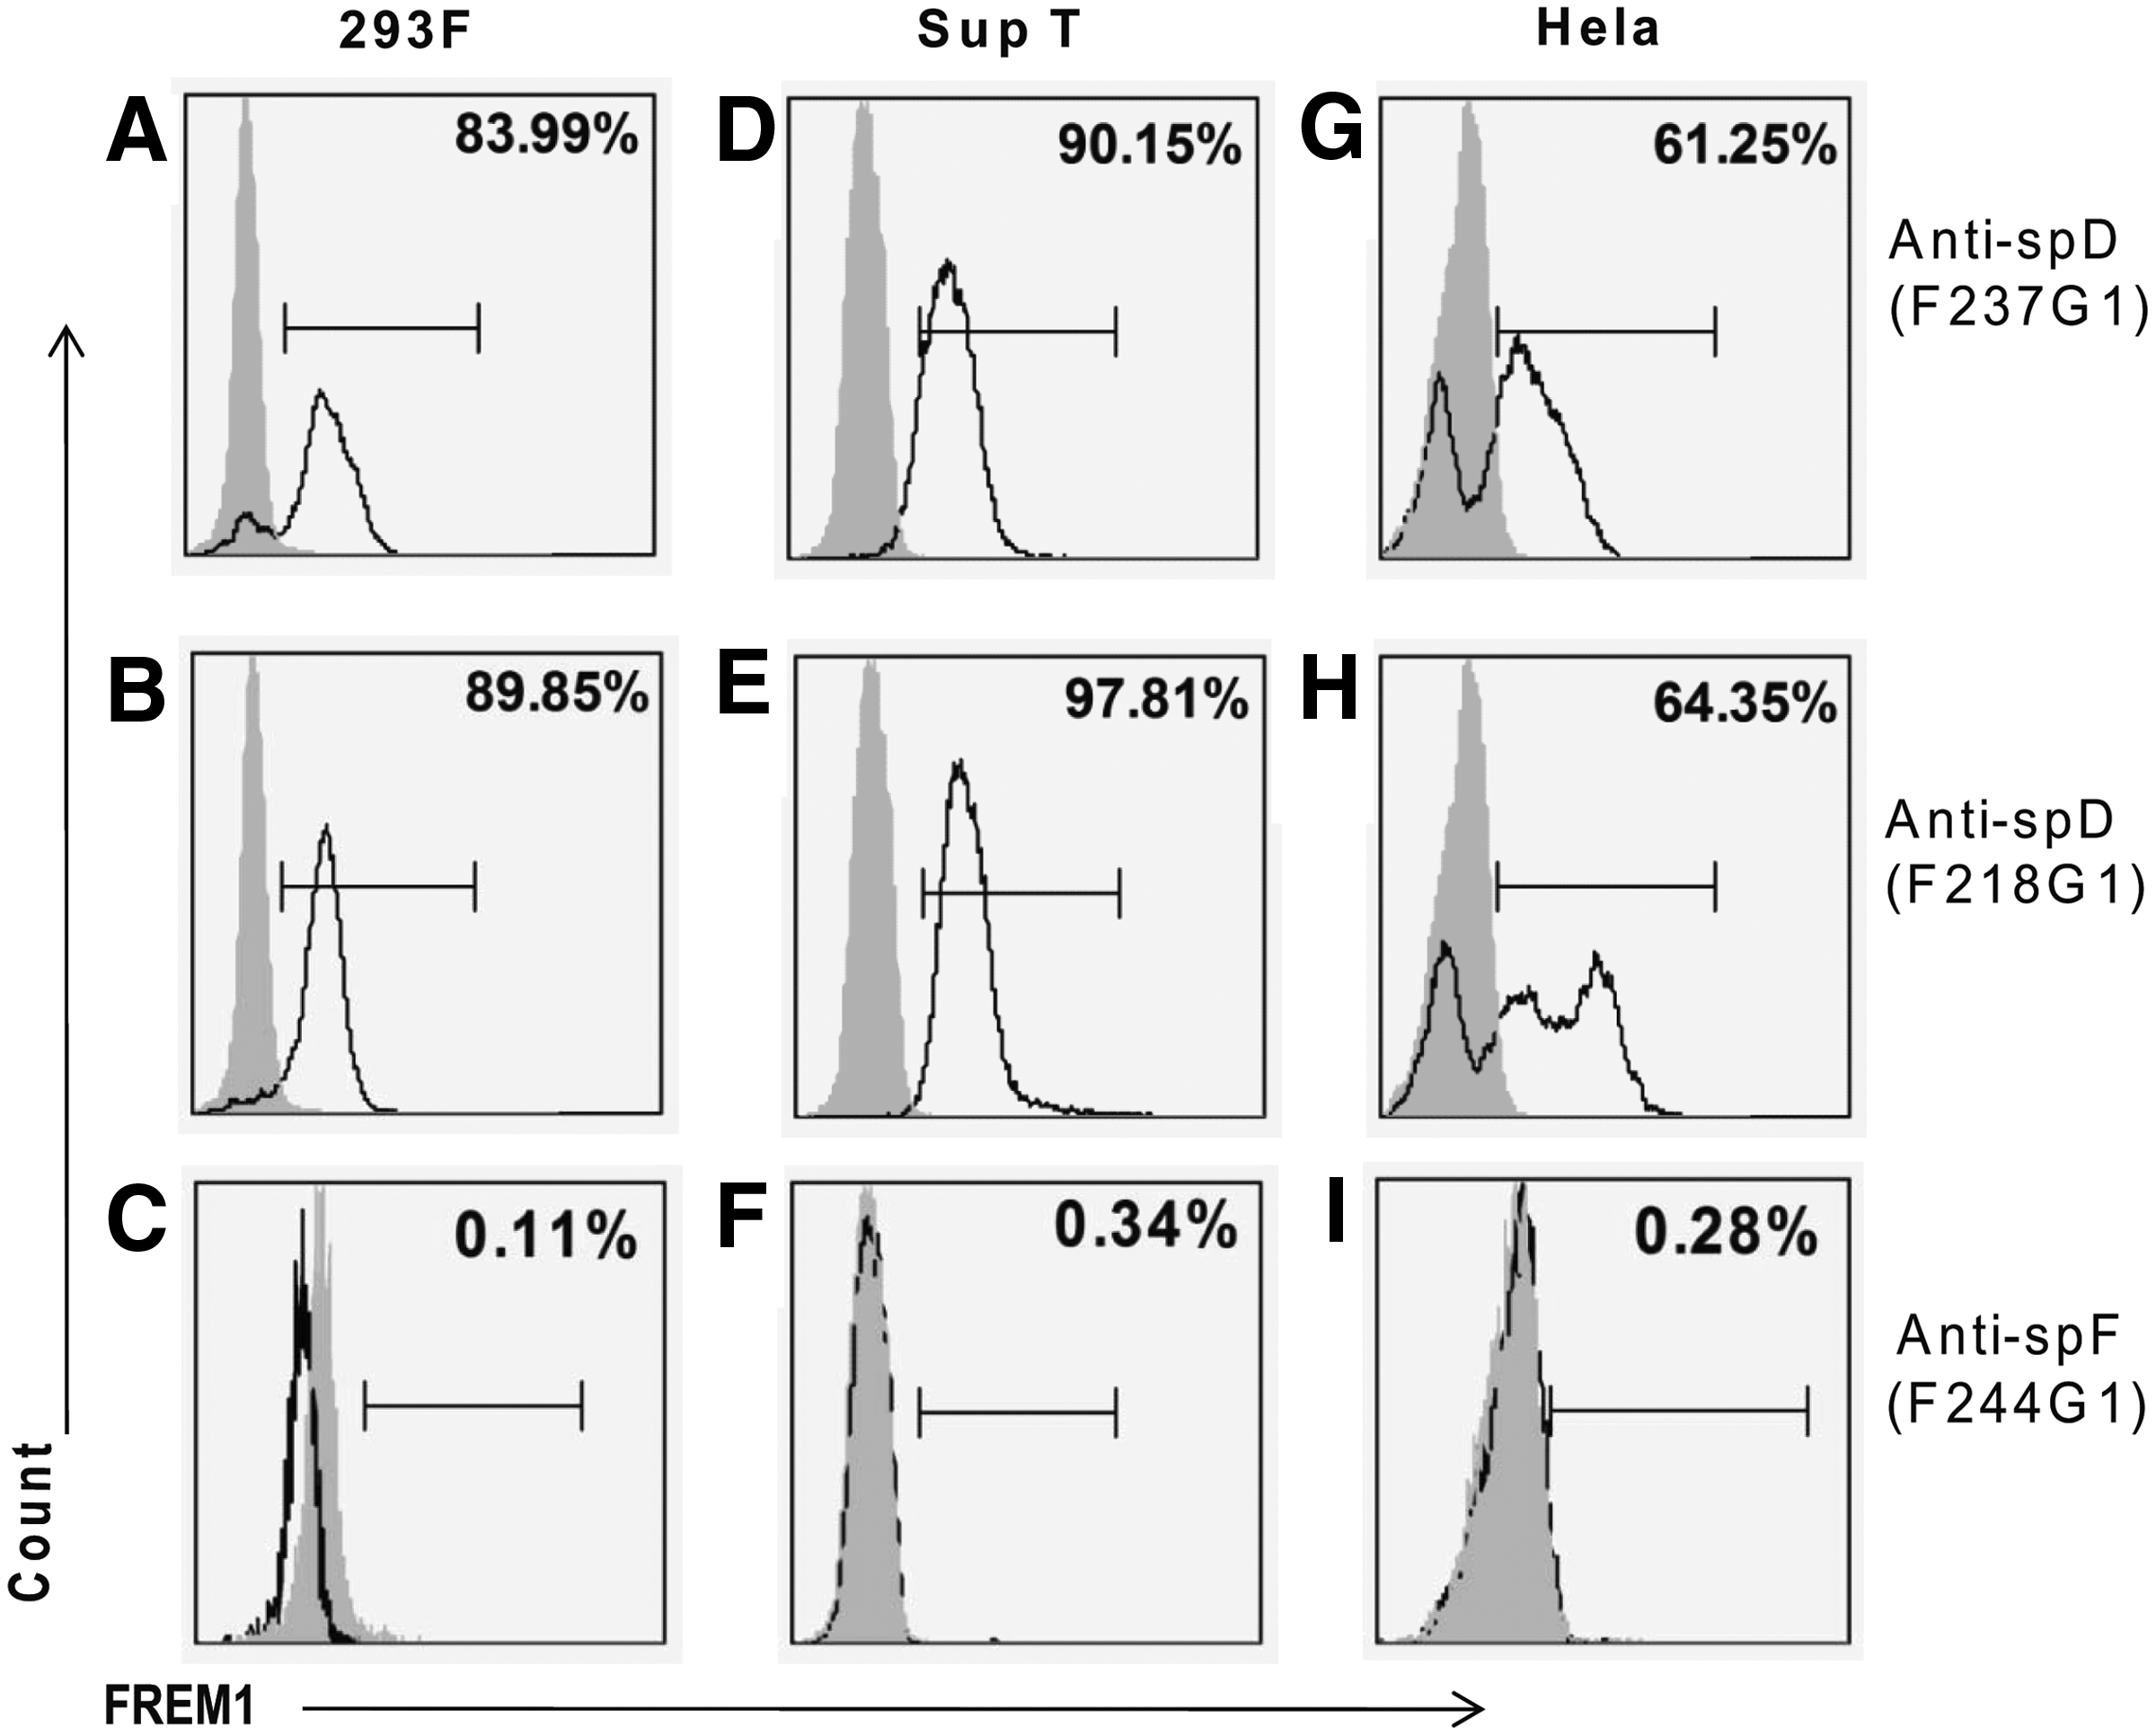
Positive staining of cell lines by anti-spD MAb but not by anti-spF MAb in flow cytometry. Three human cell lines (HeLa, Sup-T1, and 293F) were examined for surface FREM1 expression by flow cytometry. 5×10⁵ living cells were stained with MAbs of anti-spD (F218G1, F237G1), anti-spF (F244G1), and an isotype control followed by the use of secondary FITC-conjugated goat anti-mouse antibody. The percentage of positive cells is shown in the right upper corner. Data are representative of three separate experiments.
There are several possible explanations for this disparity. First, the observed staining pattern would be expected for FREM1 isoform 4 (Q5H8C1-4), which contains both the major epitopes for F237G1 and F218G1 but lacks the CTLD, according to Universal Protein Resource knowledgebase (UniProtKB). Secondly, F244 G1 may not be suitable for surface staining because the epitope might be inaccessible in natively folded protein. Also, a prokaryotic system was used to express the immunogen rspF, and thus disulfide bond chemistry was not plausible due to the reducing cytosolic environment. This disparity between the immunogen and native FREM1 is relevant since the F244G1 epitope contains a disulfide bond. To overcome this limitation, Western blot analysis using denatured conditions is recommended for immunodetection with this MAb. Thirdly, the pepscan ELISA for F244G1 had lower signal intensity (OD405nm, F244G1=0.6) compared to F237G1 or F218G1 MAb (OD405nm, F237G1=3.4; OD405nm, F218G1=3.7); therefore we cannot rule out the possibility that the amount of antibodies used was simply insufficient.
Discussion
Based on the epitope mapping results, we speculate the potential of using this panel of MAbs to study functions of FREM1 and discriminate between some of the FREM1 isoforms. The protein domains CSPG 9 and 10 were only found in FREM1 isoform 1 and not in isoform 2 (TILRR), whereas other interrogated domains were shared by both isoforms (Fig. 5, Table 1). Four MAb epitopes were included within this region (EVDLNLLRYTHTGAM, DSQNQDSFTFYLWDG, ITIKDMEKGDIVILT, and KPEELLYVITSPPRY). Antibodies that were specific to isoform 1 include F237G1, G2, and G4-G10; among them, F237G1, F237G6, and F237G9 are recommended due to the strong signal and minimal background observed by the pin-peptide ELISA (Supplementary Fig. 1). Monoclonal antibodies that interrogated both isoforms, but were not specific to isoform 1, include F237G3, F218G2, F218G4, F218G5, and F244G1. Among them, F237G3 and F218G2 might be better.
The F218G1 and G5 MAbs' minor epitope, QDVDSKNVAYRHSGG, contains the serine residue critical for glycosaminoglycan (GAG) attachment to FREM1 isoform 2, TILRR (Fig. 5). F218G5 weakly recognizes a broad region across CSPG 11/12/Calx-β domains including the TILRR GAG attachment site, unlike the other MAbs, which had either one or two well-defined FREM1 epitopes. This site is functionally interesting, others have shown that substitution mutagenesis of this serine to an alanine reduces IL-1-induced expression of IL-8 by 50%.(10) Because the association of TILRR with IL-1R1 complex enhances MyD88 signal transduction,(9) these MAbs could potentially be used to block GAG attachment and reduce TILRR-mediated enhancement of IL-1β signal transduction.
Another epitope of functional interest is recognized by F244G1 and found in the C-type lectin domain (CTLD) disulfide bond. The C-type lectin domain superfamily contains 17 members, one of which is the Calx-β and CTLD containing protein groups (CBLD).(18) FREM1 is the only known protein with the CBLD domain. Although CBLD function is not well-understood, much is known about CTLD superfamily in general. CTLDs typically have four Ca2+ binding sites, two conserved disulfide bonds that form the binding pocket and a carbohydrate-binding domain. Many CTLD families have immunological or enzymatic functions. These include selectins, which are known to be responsible for the “rolling and tumbling” movement of lymphocyte during recruitment, as well as collectins and DC-SIGN dendritic cell receptors, which are involved in sensing of pathogen associated patterns such as high-mannose groups.(18) The F244G1 could be used to study the function of FREM1's CTLD domain.
Few FREM1-specific MAbs are commercially available; to our knowledge, the commercially available anti-FREM1 antibodies are all polyclonal. The well-known advantages of monoclonal versus polyclonal antibodies include reduced variability between batches, better reproducibility of results, and better signal-to-noise ratio due to absence of non-specific antibodies, as well as defined epitopes. Furthermore, we demonstrated these antibodies are suitable for Western blot, and two of three MAbs we tested were suitable for detecting natively folded FREM1 protein in human LTC cell lines by immunofluorescent microscopy and flow cytometry. Most importantly, we have characterized the epitopes interrogated by the MAb panel. This characterized MAb panel will be useful for the study of FREM1 functional domains and isoforms in physiological and pathological conditions.
Our motivation to develop this antibody panel was to investigate FREM1 function in relation to differential host susceptibility to HIV-1 infection.(11) Since FREM1 was first identified by the Health Mammalian Gene Collection program in 2002,(21) much has been discovered about the diverse function of this apparent “moonlighting” protein. Studies have shown that FREM1 mutations cause congenital diseases such as MOTA(7) and BNAR.(8) It plays an important role in dermal-epidermal formation during embryonic development(6) and as a co-receptor for pro-inflammatory cytokine IL-1β.(9) We have used a FREM1 monoclonal antibody (developed in our laboratory with a synthetic peptide) to study FREM1 expression in female cervical tissue by immunohistochemistry.(11) This panel of MAbs with defined epitopes will be very useful for detecting FREM1 expression in different cell lines and PBMCs by immunohistochemistry and flow cytometry and potentially be used to differentiate expression of different splice variants and epitopes. We hope investigators will find utility of this monoclonal antibody panel as molecular tools to design interesting experiments that will elucidate the function and role of this protein and its alternative splicing variants in susceptibility to HIV-1 infection and other diseases.
Footnotes
Acknowledgments
This research was supported by the National Microbiology Laboratory, Public Health Agency of Canada (Winnipeg, Manitoba). We thank the Monoclonal Antibody Core and Proteomics & Mass Spectrometry Core for their technical expertise and collaboration in this work.
Author Disclosure Statement
Monoclonal antibodies against FREM1 have been developed and listed for licensure by the Office of Intellectual Property Management and Business Development, Public Health Agency of Canada.
References
Supplementary Material
Please find the following supplemental material available below.
For Open Access articles published under a Creative Commons License, all supplemental material carries the same license as the article it is associated with.
For non-Open Access articles published, all supplemental material carries a non-exclusive license, and permission requests for re-use of supplemental material or any part of supplemental material shall be sent directly to the copyright owner as specified in the copyright notice associated with the article.