
Abstract
The purpose of this study is to optimize ELISA conditions to quantify the colorectal cancer antigen GA733 linked to the Fc antibody fragment fused to KDEL, an ER retention motif (GA733-FcK) expressed in transgenic plant. Variable conditions of capture antibody, blocking buffer, and detection antibody for ELISA were optimized with application of leaf extracts from transgenic plant expressing GA733-FcK. In detection antibody, anti-EpCAM/CD362 IgG recognizing the GA733 did not detect any GA733-FcK whereas anti-human Fc IgG recognizing the human Fc existed in plant leaf extracts. For blocking buffer conditions, 3% BSA buffer clearly blocked the plate, compared to the 5% skim-milk buffer. For capture antibody, monoclonal antibody (MAb) CO17-1A was applied to coat the plate with different amounts (1, 0.5, and 0.25 μg/well). Among the amounts of the capture antibody, 1 and 0.5 μg/well (capture antibody) showed similar absorbance, whereas 0.25 μg/well of the capture antibody showed significantly less absorbance. Taken together, the optimized conditions to quantify plant-derived GA733-FcK were 0.5 μg/well of MAb CO17-1A per well for the capture antibody, 3% BSA for blocking buffer, and anti-human Fc conjugated HRP. To confirm the optimized ELISA conditions, correlation analysis was conducted between the quantified amount of GA733-FcK in ELISA and its protein density values of different leaf samples in Western blot. The co-efficient value R2 between the ELISA quantified value and protein density was 0.85 (p<0.01), which indicates that the optimized ELISA conditions feasibly provides quantitative information of GA733-FcK expression in transgenic plant.
Introduction
C
Such recombinant vaccines have traditionally been expressed in mammalian cell cultures.(6) However, vaccine production using mammalian system has several disadvantages, which include animal pathogenic contaminants and expensive cost of production.(7) Thus, plants have emerged as bioreactors due to their feasibility for the low-cost, high-quality production of safe post-translational modified complex proteins.(8) Nevertheless, in plants, recombinant protein expression patterns vary depending on the individual plant line, biomass harvesting time, and harvested tissue portion. A proper screening method to identify transgenic line highly expressing the recombinant proteins with feasible quantification is required for efficient production of the recombinant proteins in the transgenic plant.
In general, Western blot analysis is applied to confirm the expression of specific recombinant protein and to screen transgenic line expressing the recombinant protein. Quantitative Western blot has been reported to quantify the specific recombinant protein expressed in the plant.(9) However, Western blot can test only a limited number of samples without accurate quantitative information. On the other hand, ELISA is a useful high throughput tool to quantify the expression level of a specific protein in a sample with a high level of sensitivity, robustness, and easy visualization of results.(10)
In this study, conditions of ELISA method were optimized to quantify the GA733-Fc fusion protein as a colorectal cancer vaccine candidate expressed in the transgenic plant.
Materials and Methods
Plant leaf sample preparation
Fresh leaf samples from different transgenic plants, expressing colorectal cancer antigen GA733 fused to the Fc antibody fragment complex protein fused to KDEL (GA733-FcK),(3) were collected. A 100 mg of the fresh plant leaf samples was ground in 300 μL of 1X PBS. The ground samples were centrifuged at 13,000 rpm for 3 min at 4°C. After centrifugation, the supernatant was harvested, and then used for the following experiments.
Selection of secondary detection antibody conjugated to HRP and concentration optimization to detect GA733-FcK expressed in plant leaf
Maxisorp 96-well micro plates (Nunc, Roskilde, Denmark) were coated overnight at 4°C with 50 μL per well of carbonate-bicarbonate (Sigma-Aldrich, St. Louis, MO) buffer, containing 5 μg/mL of MAbM CO17-1A (Centocor, West Chester, PA). After discarding the coating solution, the plant was washed four times with 1X PBS. The wells were blocked with 150 μL per well of 1X PBS containing 3% BSA (BioWorld, Dublin, OH) and were incubated overnight at 4°C. After four plate washings with 1X PBS, GA733-FcK plant sample (50 μL) was placed in the well and incubated 90 min at 37°C. After discarding the sample solution, the plate was washed four times with 1X PBS. Each well was treated with 100 μL of horseradish peroxidase-conjugated goat anti-human Fc fragment specific IgG (Jackson, West Grove, PA) and HRP-conjugated anti-EpCAM/CD326 IgG (Bioss, Woburn, MA) diluted at 1:10,000 in blocking buffer for 2 h at RT. After discarding the detection solution and final washing, each well was treated with 100 μL of 3,3′,5,5′-etramethylbenzidine (TMB) substrate solution (KPL, Gaithersburg, MD) for 5 min. Color development was stopped by the addition of 100 μL/well of TMB Stop solution (KPL). Absorbance was read at 450 nm Gen5 2.01 (BioTek, Winooski, VT).
Comparison of blocking buffers
To compare the two blocking buffer conditions, 5% skim milk (Sigma-Aldrich, Louis, MO) and 3% BSA (BioWorld) in 1X PBS, Maxisorp 96-well micro plates (Nunc, Roskilde, Denmark) were coated overnight at 4°C with 50 μL/well of carbonate-bicarbonate (Sigma-Aldrich) 1X PBS buffer with and without 5 μg/mL of MAbM CO17-1A. The wells were blocked with 150 μL per well of 1X PBS containing 5% skim milk or 3% BSA, and incubated overnight at 4°C. After washing four times, GA733-FcK plant leaf extract (50 μL) was applied to the well and incubated for 90 min at 37°C. The remaining steps were the same as described above.
Optimization of capture antibody concentrations
To optimize concentrations of the capture antibody, HRP-conjugated goat anti-human Fc fragment specific IgG, Maxisorp 96-well micro plates were coated overnight at 4°C with 50 μL/well of carbonate-bicarbonate buffer (Sigma-Aldrich) containing 1, 0.5, and 0.25 μg/mL of MAbM CO17-1A. Sample preparation and application were the same as that described above. Three percent BSA in 1X PBS was used for blocking.
Western blot analysis
Total soluble proteins in the fresh leaf homogenates were resolved by 8% sodium dodecyl sulfate–polyacrylamide gel electrophoresis (SDS-PAGE) and transferred to a nitrocellulose membrane (Millipore, Billerica, MA) by a Mini-Protean® Electrophoresis System (Bio-Rad, Hercules, CA). The membrane was blocked with 5% skim milk in 1X TBST (TBS containing 0.5 % Tween-20) overnight at 4°C and incubated for 2 h at room temperature with HRP-conjugated goat anti-human Fc fragment specific IgG (Jackson) diluted at 1:5000 in the blocking buffer, then washed three times with 1X TBST solution. Membranes were exposed to SuperSignal West Pico Chemiluminescent Substrate (Thermo Scientific, Rockford, IL) for 10 min, and the signals were detected on x-ray film (Fujifilm, Tokyo, Japan).
Densitometry analysis
A densitometry analysis was conducted to measure the protein band density in Western blot. Each band was digitalized by Adobe Photoshop CS5, V. 11.0 (San Jose, CA), and the density of each band was measured using ImageJ program (NIH, Bethesda, MD). The density value was represented as an absolute value.
Statistical analysis
Correlation analysis was used to quantify the degree of linear association between two variables, the absorbance value from ELISA, and the density value of purified GA733-FcK from Western blot. The statistical analysis was conducted using Minitab (Minitab, State College, PA).
Results and Discussion
The GA733-FcK expression cassette was subcloned into the HindIII sites of the binary plant expression vector pBIN-Plus.(3) GA733-FcK fusion that contains GA733 fused with human Fc fragment, including KDEL, which is ER retention signal, was expressed in the transgenic plant (Supplementary Fig. 1). Expression of GA733-FcK in transgenic plants was previously confirmed by Western blot analysis.(3) However, an immunological method, such as ELISA, has not yet been properly optimized to quantify the expression of GA733-FcK in the plant. Thus, in this study, ELISA conditions, including capture antibody detection antibody and blocking buffer, were optimized. At first, two kinds of antibody for detection antibodies conjugated to HRP, anti-EpCAM/CD362 IgG and anti-human Fc IgG, were applied to the quantify expression level of GA733-FcK in fresh leaf extracts from transgenic line. Anti-human Fc IgG conjugated to HRP (Fig. 1A, right) and anti-EpCAM/CD326 IgG conjugated to HRP (Fig. 1A, left) were applied with different amounts (1, 0.5, 0.25 μg/well) with treatment of capturing antibody MAb CO17-1A (1 μg/well). In the treatment of anti-EpCAM/CD326 IgG conjugated to HRP, the absorbance values were <0.1 over the total amount range. However, in the treatment of anti-human Fc IgG conjugated to HRP, the absorbance values were 0.93, 0.88, 0.78, and 0.71 along with decreasing amounts. These results showed that, regardless of the applied amounts, anti-human Fc IgG conjugated to HRP had a significantly higher absorbance than anti-EpCAM/CD326 IgG conjugated to HRP as a detection antibody. Both MAbM CO17-1A and anti-EpCAM/CD326 MAb recognize the same epitope regions on GA733 antigen (Fig. 1A, right). Thus, it is speculated that the GA733 binding by anti-EpCAM/CD326 MAb was interferred by MAbM CO17-1A, resulting in a signal failure. These results suggest that the antigen binding competition by two different antibodies should be avoided when the capture and detection antibodies were properly chosen.
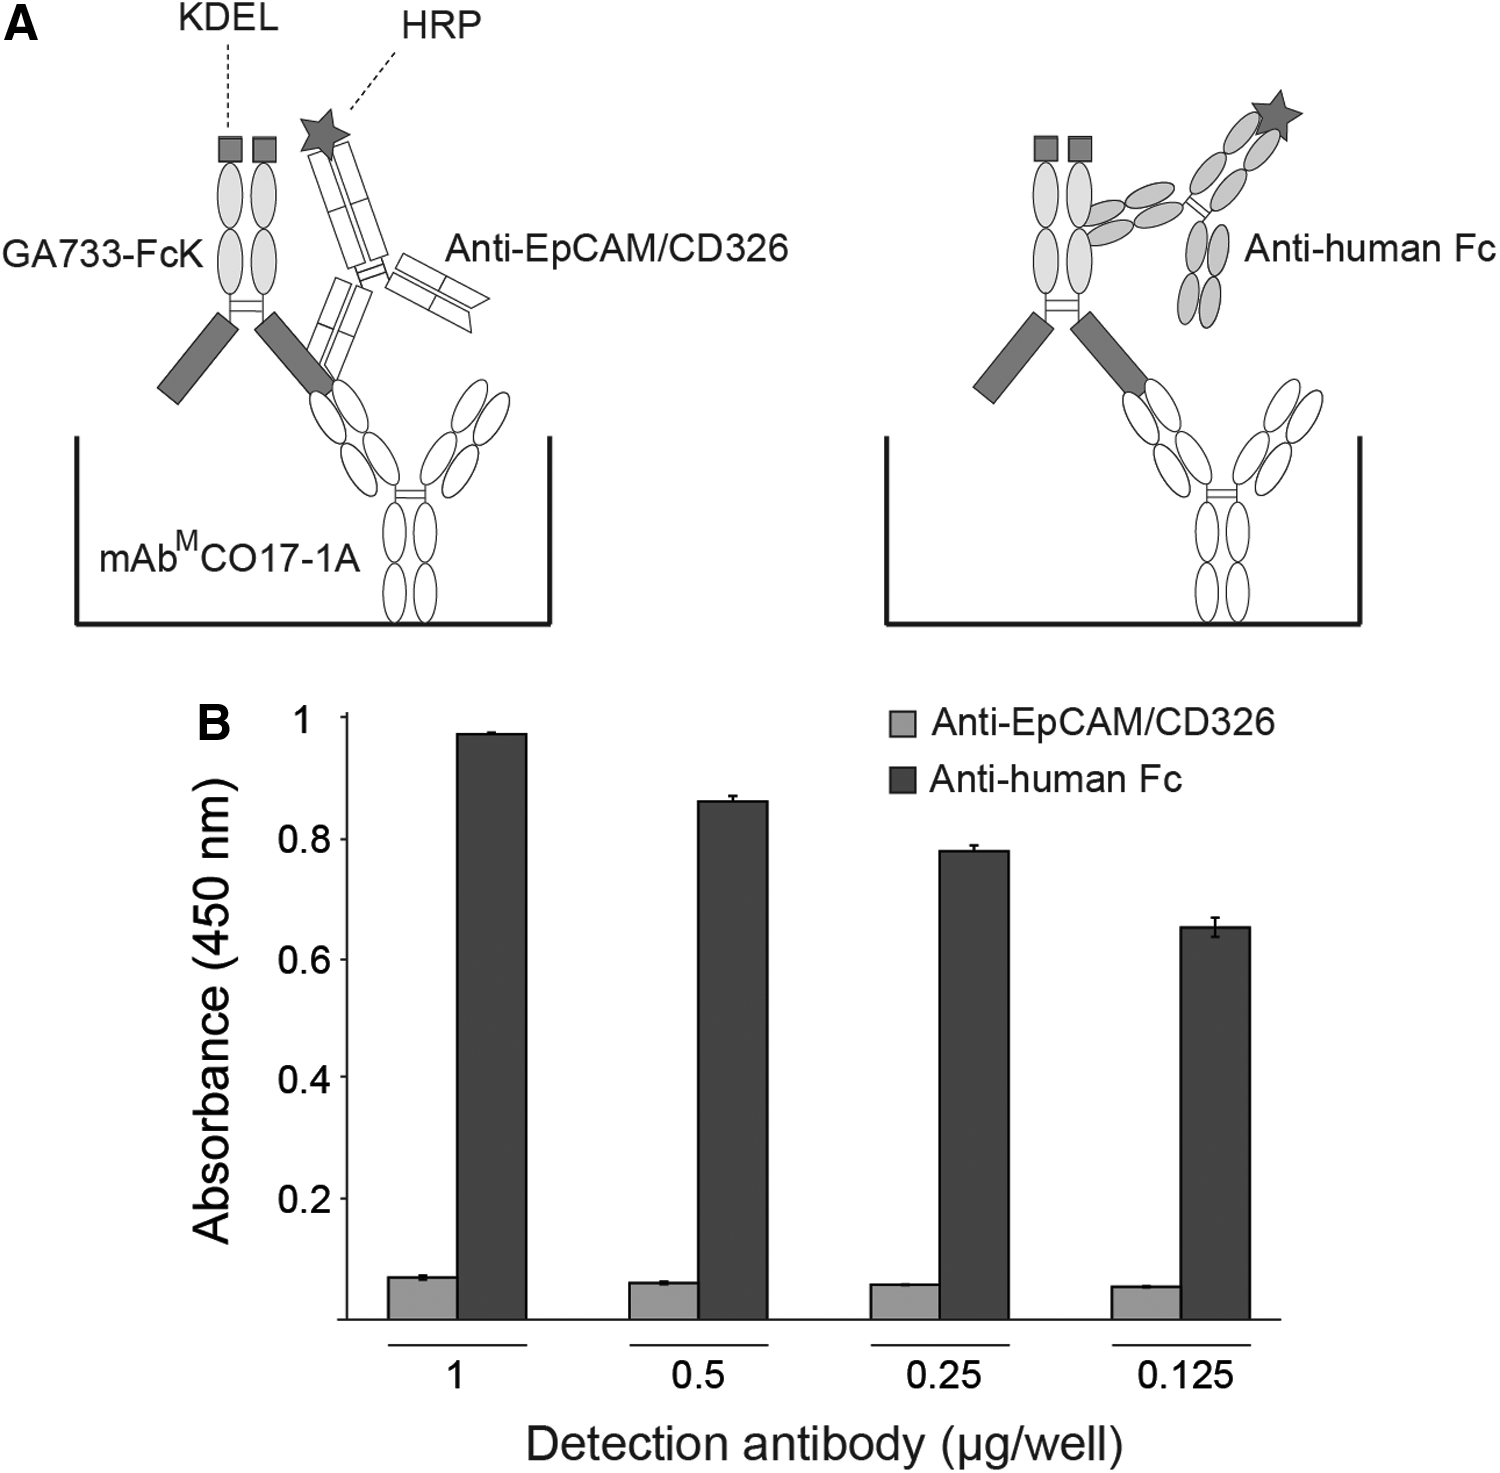
Selection of detection antibody to quantify GA733-FcK expressed in the transgenic plant in ELISA. (
In addition, two different blocking buffer conditions generally used in ELISA, 5% skim milk and 3% BSA buffers, were applied to the ELISA plate to determine which buffer conditions effectively blocked the non-specific background signals (Fig. 2). Each buffer condition was applied with or without treatment of capturing antibody MAb CO17-1AM (Fig. 2A, left and right, respectively). In 5% skim-milk buffer conditions, both conditions with and without capture antibody MAb CO17-1A showed similar absorbance signals in transgenic plant lines S1, S2, and S3 (Fig. 2B, top). In contrast, in 3% BSA blocking buffer conditions, with clearly distinctive absorbance signals, were observed with and without MAbM CO17-1A treatment (Fig. 2B, bottom). In 3% BSA blocking buffer conditions, the absorbance values, particularly, without MAb CO17-1A treatment showed <0.1. These results indicate that 3% BSA blocking buffer efficiently blocked binding of GA733-FcK to the plate surface and specifically recognize GA733-FcK expression in the plant.

Comparison of blocking buffers in ELISA. (
To optimize the concentration of the capture antibody (HRP-conjugated goat anti-human Fc fragment IgG) without reduction of sensitivity and specificity, three different concentrations (1, 0.5, and 0.25 μg/well) were applied to ELISA, using three different transgenic plant leaf samples—S1, S2, and S3 (Fig. 3). In S1, the absorbance values were 2.7, 2.4, and 1.8 at 1, 0.5, and 0.25 μg/well, respectively. In S2, the absorbance values were 3.9, 3.7, and 2.3 at 1, 0.5, and 0.25 μg/well, respectively. In S3, the absorbance values were 2.7, 2.79, and 1.65 at 1, 0.5, and 0.25 μg/well, respectively. In non-transgenic plant (NT), the absorbance values were below 0.25 at all concentrations of the capture antibody. At 0.5 μg/well, the absorbance values of all the samples had slightly changed; whereas at 0.25 μg/well, all samples showed significantly decreased absorbance values. Thus, the 0.5 μg/well of the capture antibody was applied for further study.
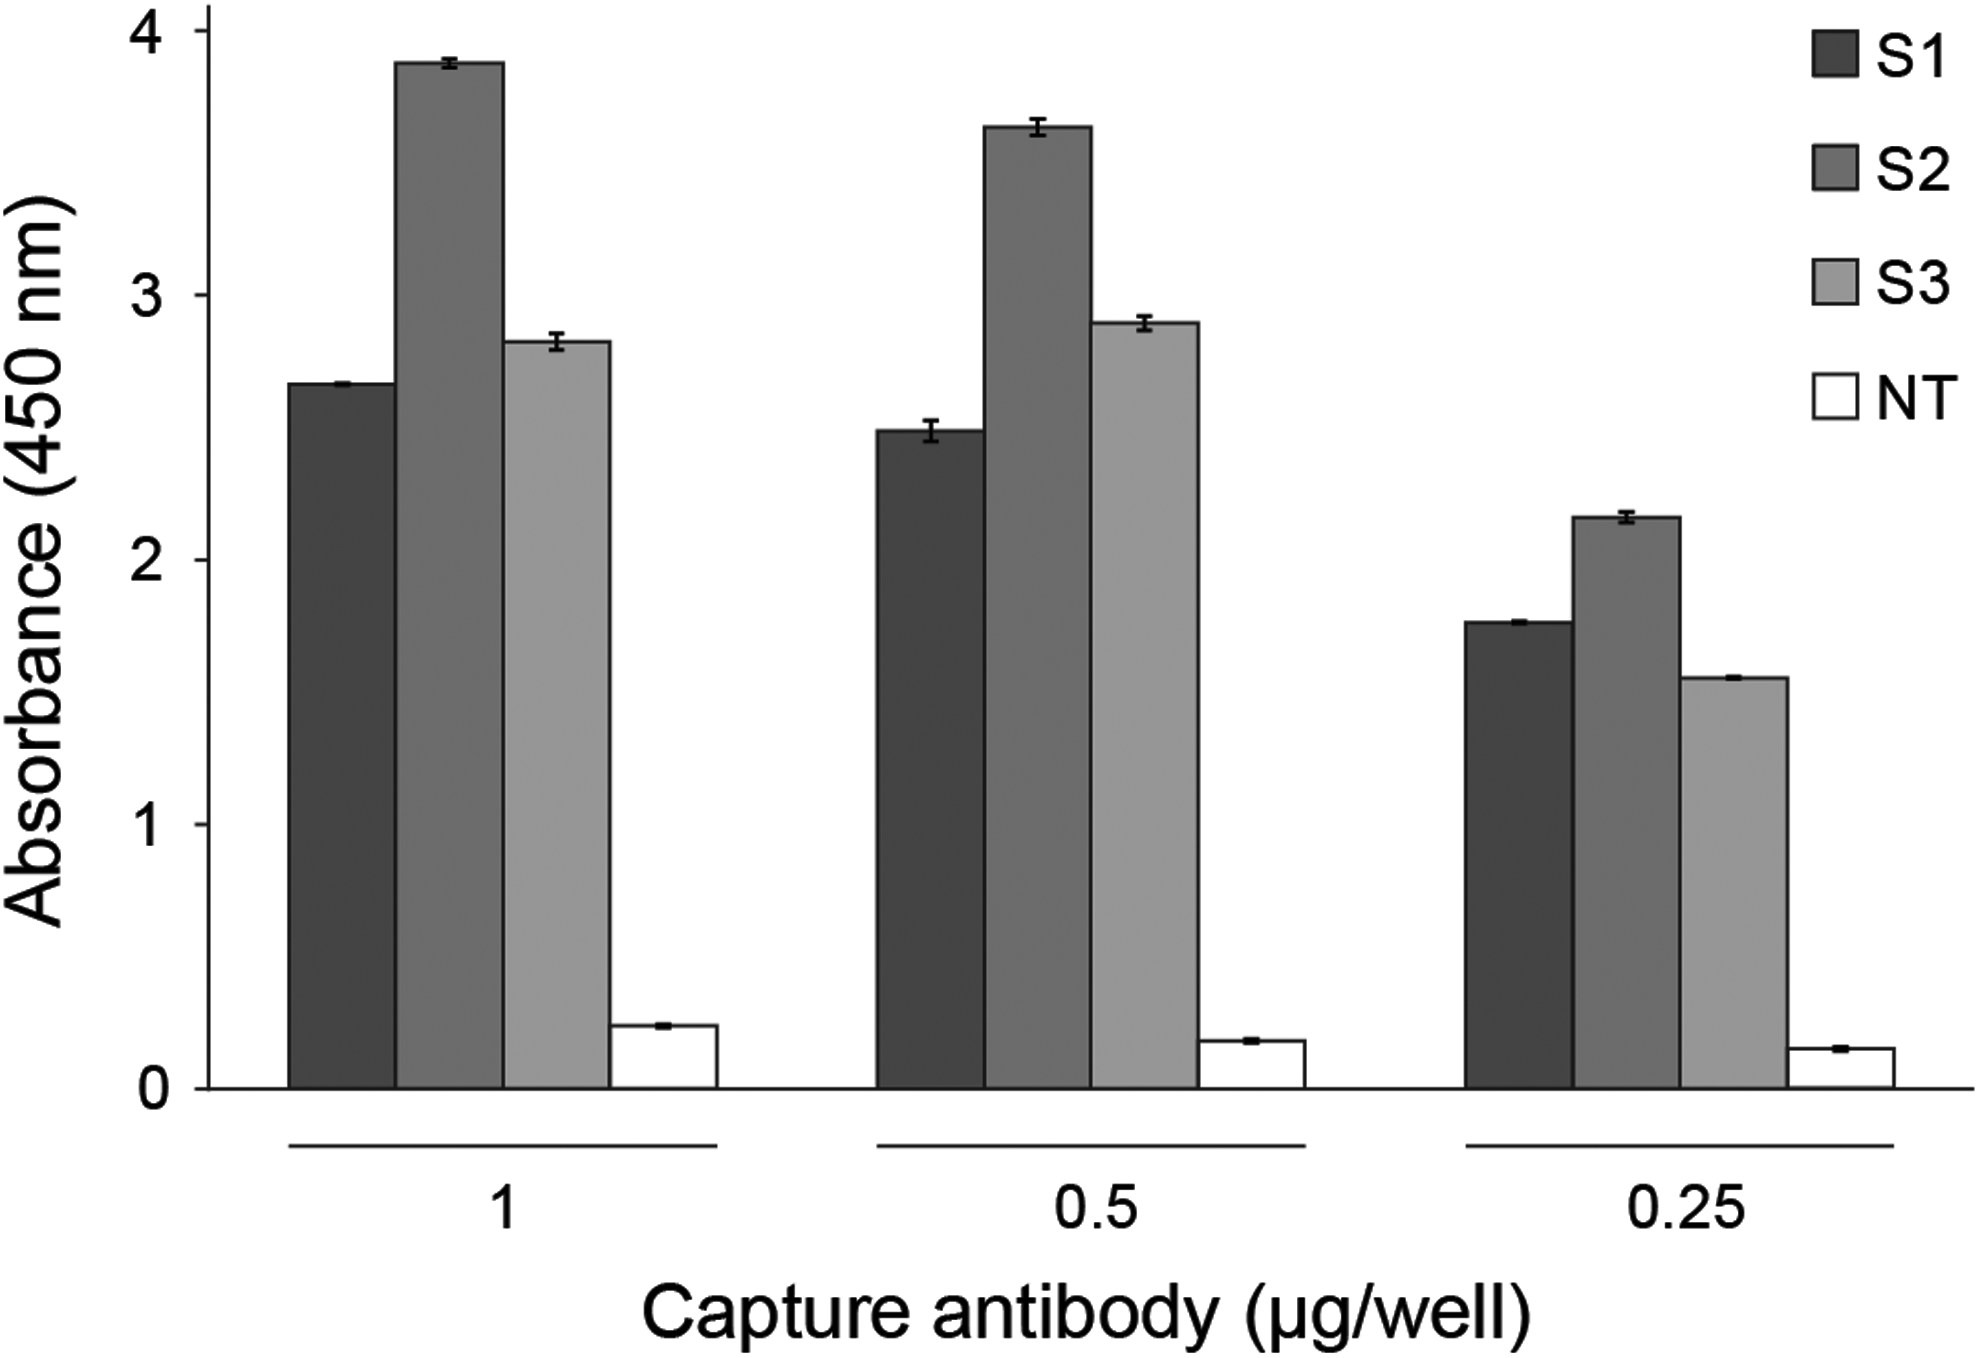
Optimization of capture antibody concentration to quantify GA733-FcK expressed in transgenic plant in ELISA. Concentration (1, 0.5, 0.25 μg/well) of capture antibody was investigated as a variation factor in ELISA.
To confirm the accuracy of optimized ELISA conditions to quantify GA733-FcK expression level in transgenic plant leaf, linear regression analysis between two variables—the expression level (ng/mg) of GA733-FcK per the fresh leaf weight obtained from the optimized ELISA conditions and the density value of the protein band from Western blot analysis—was conducted. To calculate the expression level (ng/mg) of GA733-FcK from the absorbance obtained from the ELISA, the standard curve was obtained between ng/well of GA733-FcK and absorbance (Fig. 4A). The absorbance values were proportionally distributed with the amount of GA733-FcK in the standard curve range with a squared correlation coefficient (R 2 =0.992). From the standard curve, the expression levels of GA733-FcK in each plant leaf sample were calculated (Fig. 4B). Among the six samples, in S1, S4, and S5, the expression levels were more than 1 ng/mg of fresh leaf weight. S3 showed the lowest expression level (40 ng/mg). In Western blot analysis, the density trends of GA733-FcK protein band of these samples were similar to their absorbance values. The sample groups with the strong band density were S1 (199.1), S4 (200.2), and S5 (199.6), showing high expression values, whereas the sample with the lowest band density was S3 (121.1), showing the lowest expression value (Fig. 4C). The correlation analysis confirmed that there was a significant positive correlation between the expression level (ng/mg) of GA733-FcK per the fresh leaf weight obtained from the optimized ELISA and density of the protein band from Western blot (R 2 =0.85, p<0.01).

Confirmation of optimized ELISA conditions to quantify GA733-FcK expressed in the transgenic plant leaf samples. (
Conclusions
The optimal conditions of sandwich ELISA to investigate the region-specific expression of GA733-FcK in transgenic plants were MAbM CO17-1A (5 μg/mL) as a capture antibody, 3% BSA solution as a blocking buffer, plant leaf extract sample containing GA733-FcK with 1:5 dilution, and goat anti-human Fc as a detection antibody (1:10,000) (Fig. 5).

Schematic diagram of optimized sandwich ELISA conditions with capture and detection antibody combination, including the blocking buffer. Capture antibody is MAbM CO17-1A (0.5 μg/well), blocking buffer is 3% BSA in 1X PBS, and detection antibody is goat anti-human Fc IgG (1:10,000).
Footnotes
Acknowledgments
This work was carried out with the support of the Cooperative Research Program for Agriculture Science & Technology Development (project nos. PJ009419022013 and PJ0090622013), Rural Development Administration and Korea Institute of Planning & Evaluation for Technology in Food, Agriculture, Forestry & Fisheries (111096-3).
Author Disclosure Statement
The authors have no financial interests to disclose.
References
Supplementary Material
Please find the following supplemental material available below.
For Open Access articles published under a Creative Commons License, all supplemental material carries the same license as the article it is associated with.
For non-Open Access articles published, all supplemental material carries a non-exclusive license, and permission requests for re-use of supplemental material or any part of supplemental material shall be sent directly to the copyright owner as specified in the copyright notice associated with the article.