
Abstract
Cystatin C (Cys C) has been shown to be an excellent marker of renal function, especially when evaluating the early stages of acute kidney injury. It is less affected by age, gender, muscle mass, and ethnicity. The detection of Cys C is important and has broad application prospects. Therefore, we have developed a panel of monoclonal antibodies against Cys C that can be used to establish an enzyme-linked immunosorbent assay (ELISA) kit and paired for further use in other methods of detecting Cys C. This study describes the preparation, application, and characterization of monoclonal antibodies used in ELISA. The antibodies were developed by PEG fusion of the SP2/0 cells with splenic B cells from Cys C immunized BALB/c mice. Antibody-producing cells were identified by ELISA and Western blot analysis. By way of cloning and screening, four hybridoma cell lines were established. Simultaneously large-scale monoclonal antibodies produced in mice ascites were prepared. The results showed that the cell clone 8D12 could be used in immunohistochemical staining. With the ELISA additivity test, we got a preliminarily finding that the monoclonal antibodies were not on the same epitope. The antibody matching test showed that 5D7 and 7A8 successfully paired with 8D12, and the optimal reaction conditions were initially identified.
Introduction
C
The detection of Cys C has a long history. In 1979, Lofberg and Grubb(11) developed an enzyme amplified single radial immunodiffusion to determine Cys C. Due to its poor sensitivity and multiple confounding factors, this method was not widely used. In 1993, Pergande and Jung(12) developed a sandwich enzyme immunoassay to determine Cys C in serum by using commercially available antibodies. Ishiguro and associates(13) developed a monoclonal antibody to detect Cys C in 1989. Its sensitivity was highly improved, but still could not be routinely used. Other methods were then developed, among which are the widely used particle-enhanced turbidimertric immunoassay (PETIA)(14) and particle-enhanced nephelometric immunoassay (PENIA).(15) At present, most of the PETIA or PENIA methods for detecting Cys C use polyclonal antibodies. Although using polyclonal antibodies may lower the cost, this might also lower the sensitivity and specificity in many cases. The assay methods using monoclonal antibodies may have the highest sensitivity and specificity. But the expensive import equipment and immunoassay kits restrict the application in China and other developing countries. Therefore, in this study, we developed monoclonal antibodies against Cys C that can be used to establish an enzyme linked immunosorbent assay (ELISA) kit and can be further applied in other detection methods.
Materials and Methods
Identification of Cys C
Nature protein Cys C (Immunetech International, Guilin, China) samples were denatured by boiling in 5× loading buffer (Vazyme, Nanjing, China) for 5 min, then resolved by sodium dodecyl sulfate-polyacrylamide gel electrophoresis (SDS-PAGE) with Coomassie Brilliant blue staining and bleaching liquid bleaching.
Immunization procedure
Two BALB/c mice (female, 6 weeks old) were immunized with Cys C. The immunizing dose was 100 μg and three intraperitoneal inoculations were made: the first (day 1) with Freund's complete adjuvant (FCA) for priming, and the second (day 14) with Freund's incomplete adjuvant (FIA) for boosting. One week after the second immunization, blood was collected by the tail vein followed by determination of antibody titers by ELISA. Subsequently, 3 days before the cell fusion, 100 μg Cys C (without any adjuvant) were injected intraperitoneally.
ELISA
Mouse serum titrations and screening of hybridoma supernatants were tested by indirect ELISA. The wells of ELISA plate (Nunc, Roskilde, Denmark) were coated with 100 μL of Cys C (1 μg/mL) dissolved in carbonate buffer solution (pH 9.6) and then incubated at 37°C for 2 h or 4°C overnight. Then the plates were washed three times with PBS containing 0.05% Tween-20 (PBST) for 3 min followed by blocking with 200 μL 2.5% bovine serum albumin (BSA) at 37°C for 2 h. Wells were then washed three times, mouse sera of a different dilution were added and incubated for 1 h, and wells were washed again with PBST. Goat anti-mouse IgG+M conjugated to horseradish peroxide (HRP, 1:10,000; Vazyme) was added to the wells and incubated for 45 min at 37°C. After washing, 50 μL of tetramethylbenzidine (TMB, Vazyme) substrate was added to each well, and the plates were incubated at room temperature. After 15 min, the reaction was stopped by adding 100 μL of stop solution (2 M H2SO4) to each well. The optical density (OD) of the reactions was measured at 450nm by an ELISA reader (Bio-Tek, Winooski, VT). The mouse with the titer of antibody that met the requirements was selected for fusion. To screen the antibody production of hybridoma cells, a similar method was used on the cell supernatants.
Hybridoma cell production
Antibodies were developed by PEG fusion of the SP2/0 cells with splenic B. Mouse myeloma Sp2/0 cells were cultured and propagated in DMEM culture medium (Gibco, Grand Island, NY) and 10% fetal bovine serum (FBS, Gibco). Spleen cells from the immunized mouse were mixed with the Sp2/0 cells at a ratio of 1:10. The mixture was washed twice with pre-warmed DMEM (37°C). Then, 50% polyethylene glycol (PEG, Roche, Mannheim, Germany) was used for fusion. Selective HAT medium (Gibco) was used for selection of hybridoma cells. The reactivity of culture supernatants was then tested by ELISA and Western blot analysis. Finally, positive hybridomas were cloned by limiting dilution process.
Monoclonal antibody production
The hybridoma cell lines that secreted antibody with high titers were massively cultured for hybridoma injection. Six BALB/c mice (female, 10 weeks old) per hybridoma cell line were intraperitoneally injected with sterile paraffin oil (0.5 mL per mouse) 7 days before the hybridoma injection. Seven days later, ascites were collected and centrifuged at 12,000 r/min for 30 min to obtain the supernatant. The titer of ascites was detected by ELISA and the specificity of monoclonal antibodies was identified by Western blotting.
Subclass determination
We used a mouse monoclonal subclass identification kit (Bofenesci, Beijing, China) to detect subclass by ELISA. The operational approach was according to the instructions.
Western blot analysis
The precipitated protein concentrations of ascites were measured by ELISA. 0.4 μg of Cys C was run on a 12% SDS-PAGE gel. After electrophoresis, resolved proteins were transferred onto PVDF membranes (Bio-Rad, Hercules, CA). The membranes were blocked with 5% non-fat milk in PBST 2 h at 37°C or overnight at 4°C. After gentle washing with PBST, ascites that had been diluted by 2000 or cell culture supernatant were added to the membrane and incubated for 1.5 h at room temperature. The PVDF membrane was washed extensively with PBST and incubated with HRP-conjugated goat anti-mouse IgG+M (1:5000, Vazyme) for 1 h at room temperature followed by washing three times with PBST for 10 min. Then, fluorescence detection reagent was added to exposure x-ray film. Last, we washed x-ray film by development and fixation.
ELISA additivity test
We got a preliminarily conclusion as to whether the monoclonal antibodies were on the same epitope by the ELISA additivity test. We ensured that the antigen be saturated with each antibody. After blocking with BSA, wells were washed three times and a mixture of two kinds of monoclonal antibody was added and incubated with conditions such as above. The OD450 value of the reactions was measured at 450nm. To evaluate the experimental results of the ELISA additivity test, an additivity index (AI) was defined for a pair of monoclonal antibodies as follows: AI = (2A1+2/(A1+A2) −1) × 100. (AI range from 0 to 100.) The AI was 100 when the monoclonal antibodies were on a different epitope. On the contrary, the AI was 0 when the monoclonal antibodies were on the same epitope. AI at 50 was thought as the cut-off value.
Rough purification of monoclonal antibodies from ascitic fluid
The main subclass of monoclonal antibodies obtained by hybridoma was IgG and IgM. The precipitation method of monoclonal antibodies that belong to the subclass IgG1, IgG2a, IgG2b was ammonium sulfate. Direct dialysis was used for the precipitation of monoclonal antibodies, which belong to the subclass IgG3, IgM. The filtration device was 0.45nm dialysis membrane. Ammonium sulfate precipitation was a useful method of immunoglobulin purification. Rough purification of antibodies generally could meet the requirements of the development of diagnostic kits. We used the ammonium sulfate precipitation, which met the needs of the experiment.
Antibody affinity purification
Monoclonal antibodies were purified from ascites by affinity chromatography using a Protein A column (GE). Ascites were added, which had been roughly purified and an equal volume 2× PBS to chromatographic column. Miscellaneous protein was eluted by PBS, and flow-through was collected until no protein remained in the flow-through. The elution was performed using glycine-HCl (0.1 M, pH 3.0). The eluted antibody was dialyzed against PBS at pH 7.4, and the required volume was concentrated using a Millipore protein enrichment tube. The titer of the antibody that had been used in affinity purification was then tested by ELISA. The purification of antibodies was identified by SDS-PAGE analysis.
Coupling of antibodies to HRP
Antibodies were coupled to HRP by periodate method. Antibodies needing HRP labeling were dialyzed in PBS to remove glycine and Tris. The operational approach was carried out according to the rapid labeling kit (Vazyme) instructions.
Antibody matching test
Preliminary selection of optimal concentration of coated antibody
Wells of the ELISA plate were coated with 100 μL purified antibodies of different gradient dilutions dissolved in carbonate buffer solution (pH 9.6) and then incubated at 37°C for 2 h. The plates were washed three times with PBST for 3 min followed by blocking with 200 μL BSA at 37°C for 2 h. Wells were then washed three times, standard Cys C protein of different gradients were added and incubated for 1 h, and wells were washed again with PBST. HRP-labeled antibodies were added to the wells and incubated for 45 min at 37°C. After washing, 100 μL TMB substrate (Vazyme) was added to each well and the plates were incubated at room temperature. After 10 min, the reaction was stopped by adding 100 μL of stop solution (2 M H2SO4) to each well. The OD450 value of the reactions was measured. We obtained the optimal concentration of coated antibody according to the OD value.
Preliminary selection of coating buffer
To determine the best coating buffer by ELISA, different coating buffers (citrate [pH 2.0], sodium citrate [pH 5.2], PBS [pH 7.4], carbonate buffer [pH 9.6]) were added to different concentrations of NaCl. The ELISA procedure was as noted above. We then obtained the optimal coating buffer according to the OD450 value.
Standard curve
The above-explored conditions were considered as the conditions of double antibody sandwich ELISA method. The standard curve was drawn according to the OD450 value of the different gradient diluted standard Cys C.
Immunohistochemical staining
We chose normal kidneys and non-functioning kidneys to perform immunohistochemical analysis using our monoclonal antibodies. Kidneys were provided by Drum Tower Hospital. After fixation, kidneys were washed in tap water, dehydrated in a graded alcohol series, embedded in paraffin, and cut into 3 μm thick sections. The paraffin sections were processed for hematoxylin-eosin staining and immunohistochemistry using the monoclonal antibodies that we obtained and the Vectastain ABC kit (Vector Laboratories, Burlingame, CA). Cys C immunoreactive areas in the cortex, cortico-medullary junction, and medulla were observed using a light microscope.
Results
Characterization of Cys C
Purity and distribution of the various forms of Cys C were checked with PAGE and Coomassie Brilliant blue staining. Figure 1 demonstrates the Cys C was about 13 kDa, and the sample was pure.

SDS-PAGE analysis for native protein Cys C. Lane 1, 1.6 μg of Cys C; lane 2, 0.8 μg; lane 3, 0.4 μg; M, protein marker.
Production of monoclonal antibody against Cys C
The ELISA titers of mice was l:256,000. After immunization of mice with Cys C, the splenocytes of the mouse were fused with Sp2/0 cells. Supernatants of growing hybridoma cells were screened based on reactivity with Cys C by ELISA. After one or two rounds of subcloning and detection, four hybridomas were established, which were named 5D7 (5D7-D8-F9), 7A8 (7A8-B8-B5), 8D12 (8D12-G5), and 8G3 (8G3-A8), and were chosen to produce MAb ascites. 5D7, 7A8, and 8G3 belong to the subclass of IgM, and 8D12 is attributed to IgG1.
Titer analysis
Serial dilutions of monoclonal antibody ascites were measured in indirect ELISA for their titers against Cys C. The results are shown in Table 1. The monoclonal antibodies against Cys C that we prepared had high titer.
SDS-PAGE analysis of monoclonal antibodies
Monoclonal antibody ascites and the 8D12 monoclonal antibody were loaded to pre-cast gels for the SDS-PAGE analysis. Figure 2 shows two bands in lane 4 with molecular masses of about 55 kDa and about 25 kDa, representing the heavy chain and light chain of antibodies, respectively. And the antibodies had high purity.
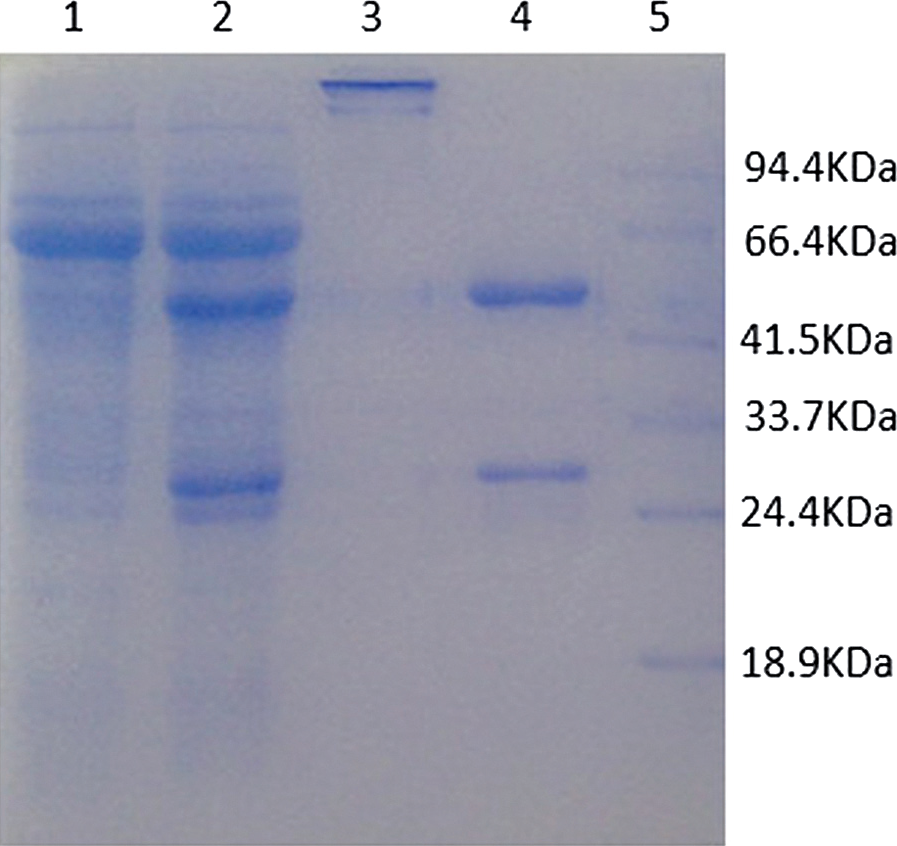
SDS-PAGE analysis of monoclonal antibodies. Lane 1, flow-through; lane 2, coarse purification of 8D12 ascites; lane 3, affinity purification samples of 8D12 (loading buffer without β-ME); lane 4, affinity purification samples of 8D12 (loading buffer with β-ME); M, protein marker.
Western blot analysis
Western blot analysis (Fig. 3) demonstrated that 8D12 and 7A8 monoclonal antibodies recognized Cys C as an approximately 13 kDa protein band. On the other hand, 5D7 and 8G3 did not show an obvious band.

Western blot analysis with monoclonal antibodies. M, protein marker; lane 1, extracts of 8D12 cells; lane 2, purifier ascites of 8D12 MAb; lane 3, extracts of 7A8 cells; lane 4, purifier ascites of 7A8 MAb.
ELISA additivity test
The four monoclonal antibodies were analyzed by ELISA additivity test (Table 2). We obtained a preliminarily result that the monoclonal antibodies were not on the same epitope. The AI of 5D7 and 7A8, 5D7 and 8D12, 7A8 and 8D12, and 8D12 and 8G3 was more than 50%, so we determined that the pair recognized different epitopes. The AI of 5D7 and 8G3, and 7A8 and 8G3 was less than 50, so we determined the pair recognized the same epitope.
Antibody matching test
According to the result of the ELISA additivity test, the AI of 5D7 and 8D12 and 7A8 and 8D12 was high. Also the titers of 5D7, 7A8, and 8D12 monoclonal antibodies were high. We chose 5D7 and 7A8 as catching antibodies that matched with 8D12. Through the direct ELISA method, we determined that the optimum diluted multiples of the HRP-labeled 8D12 monoclonal antibodies was 1:2000. The dilution of the antibodies of 5D7 and 7A8 were 1:200, 1:500, 1:1000, and 1:2000. The OD450 value of the different dilution of 5D7 was not obviously different. A similar result was obtained in the coating antibodies of 7A8. We chose 1:1000 as the optimum dilution. The OD450 value of 5D7 was larger than 7A8 so we chose 5D7 for further study. The subclass of 5D7 and 7A8 were IgM. Solubility of IgM was extensive in the solution, which contains a high concentration of salt. Then we added different concentrations of NaCl, and the OD450 values were the highest when the concentration of NaCl was 1 M. In order to compare the total amounts of antibodies adsorbed to solid phase under different coating conditions, we analyzed the binding of HRP-labeled 8D12 (coated at pH 2.0, 5.2, 7.4, and 2.0), to which a concentration 1 M of NaCl was added. The result showed that the OD values were the highest when the pH of coating buffer was 2.0. The OD450 values were higher when coating overnight at 4°C than when coating for 2 h at 37°C. The standard curve was then drawn according to the OD450 value of the different gradient diluted standard Cys C. Figure 4 shows that the OD450 value had a good linear relationship with the concentration of standard protein.
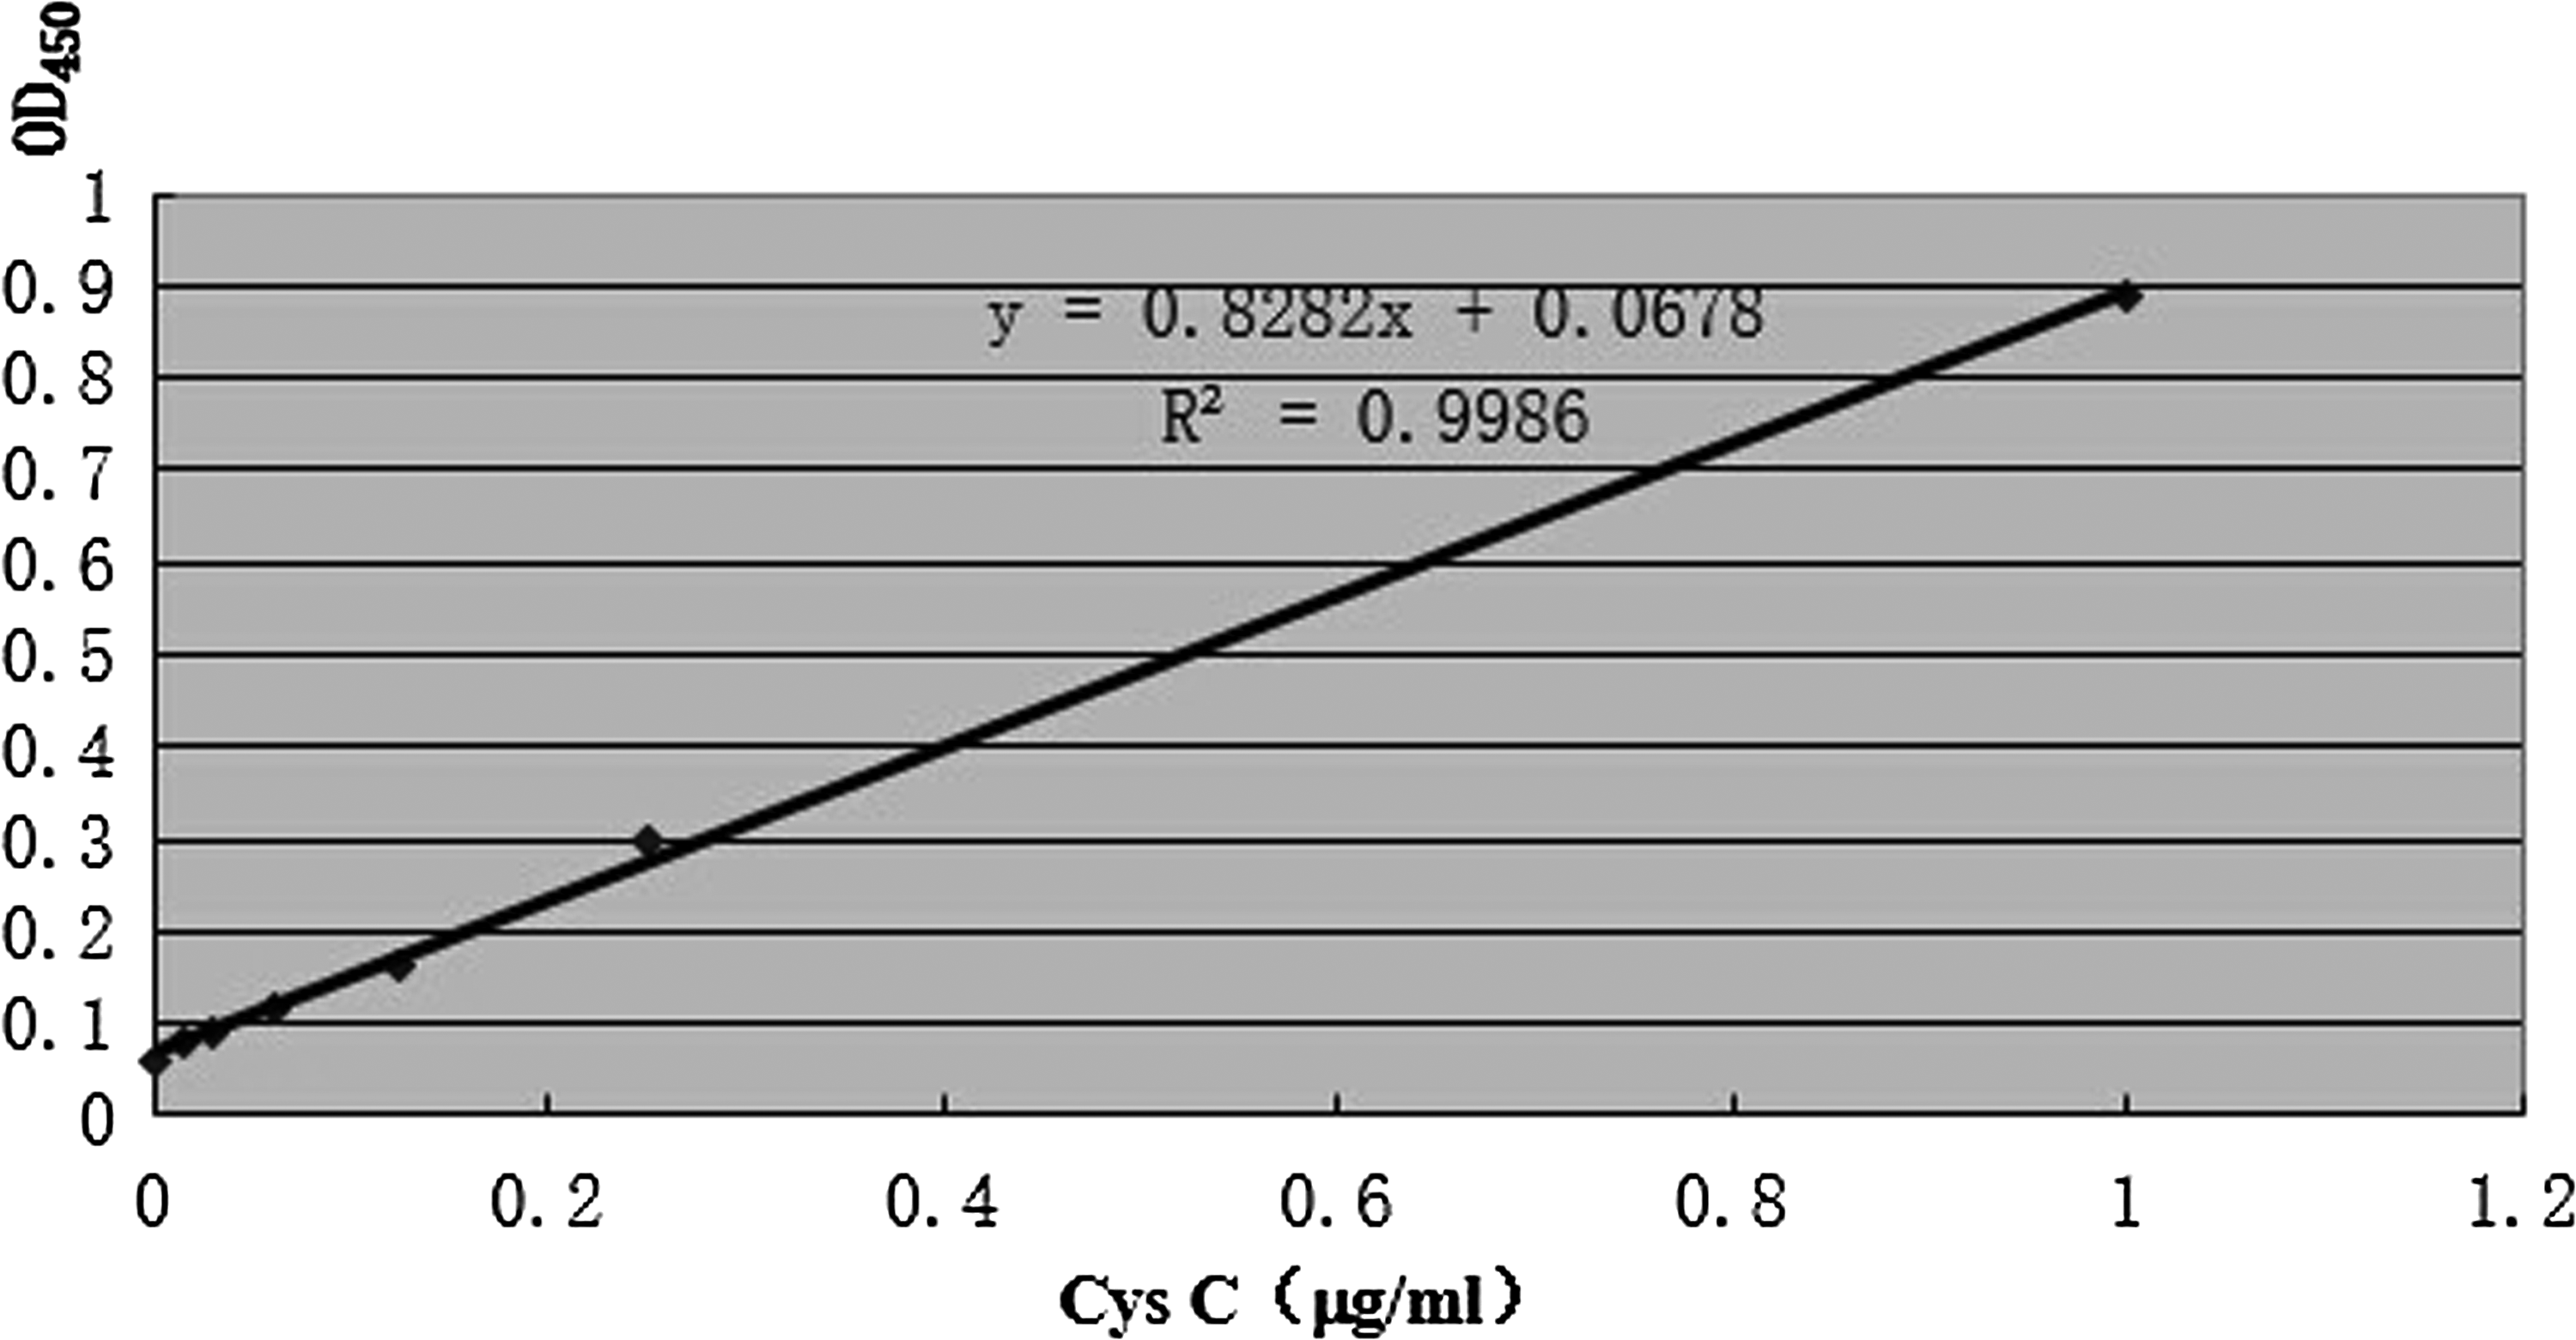
Standard curve. The wells were coated with 5D7.
Immunohistochemical staining with 8D12
To determine whether 8D12 can be used for detecting Cys C expression in fixed tissues, we analyzed formalin-fixed sections of normal and non-functioning kidneys. In normal kidneys, Cys C was localized in the renal proximal tubule of the cortex, but was hardly observed in the corticomedullary junction and medulla (Fig. 5a, b). In non-functioning kidneys, Cys C was also localized in these areas, and Cys C was also observed in the glomerular sclerosis and blood vessel endothelium (Fig. 5c, d).

Immunohistochemical staining of normal kidneys and nonfunctioning kidneys with 8D12. Cys C positive areas were seen in the proximal renal tubules in the cortex (
Discussion
With the rapid development of molecular biology techniques, there have been several new antibody preparation methods, like chimeric monoclonal antibody preparation technology, preparation of monoclonal antibody by transgenic mice, phage display technology to produce monoclonal antibodies, and other new technologies; we, however, still chose the traditional hybridoma technique for several reasons. First, the hybridoma makes massive monoclonal antibodies by hybridoma cell injection into the mice; and second, it generates high affinity antibodies with specificity and sustainability. In addition, the hybridoma method is low cost.
In this study, four hybridoma cell lines secreting anti-Cys C antibodies with high specificity and stability were obtained and characterized. Three monoclonal antibodies belonged to the subclass of IgM, and the one other was attributed to IgG1. Two of them could specifically bind with Cys C, which formed in a single protein band at a molecular weight of 13 kDa. We prepared mice ascites that was rich in Cys C monoclonal antibodies by injecting hybridoma cells intraperitoneally. We successfully purified mouse ascites by ammonium sulfate precipitation and affinity purification. The monoclonal antibodies against Cys C had high titer. The monoclonal antibodies obtained were not on the same epitope and successfully matched, which laid a foundation for establishing a double antibody sandwich ELISA method to detect Cys C.
Some factors often reduce the biological activity of adsorbed monoclonal antibodies, like improper orientation, temperature and pH changes, partial antibody denaturation, conformational changes, occasional multiple layering of coating immunoglobulin molecules, and steric hindrances at higher concentrations.(16,17) Our study showed that the OD450 values were high when the pH of coating buffer was 2.0, which was added to the concentrations of 1 M NaCl and incubated at 4°C overnight. Our conditions may better preserve the antibody activity, which helps the antibody better combine with the antigen.
In Western blot analysis, 7A8, 8D12 antibody could recognize Cys C, and specific bands formed in the molecular size of approximately 13 kDa, while 5D7 and 8G3 did not appear to band. The reason for the latter may be that 5D7 and 8G3 were for the conformation-dependent epitopes. During the ELISA test, Cys C was adsorbed to solid phase as the natural form of the protein. While in the Western blot, protein was denatured when boiled in 5×loading buffer and underwent SDS-PAGE. Conformational epitopes disappeared, which led to antibodies not being able to combine with the sample, so the band did not appear. In normal kidney, Cys C positive areas were seen in the proximal renal tubules in the cortex, but was hardly observed in the corticomedullary junction and medulla, which was consistent with previous studies using rats and humans.(18) Cys C is reabsorbed and degraded in proximal tubular epithelial cells—thus, immunohistochemical Cys C expression in the proximal tubule. Immunohistochemical Cys C expression changes in nonfunctioning kidneys, which can be characteristic of non-functioning kidneys. The result showed that 8D12 was useful in immunohistochemical staining.
Cys C is widely used in evaluating kidney function, especially in the early detection of acute kidney injury. In other instances, Cys C is also associated with neurodegenerative diseases, organ fibrosis and tumor. In a recent report, Delanaye and colleagues(19) used PENIA to determine Cys C. They concluded that Cys C significantly outperformed SCr in the detection of an impaired GFR in critically ill patients. Ristiniemi and colleagues(20) used double monoclonal design to determine Cys C. They considered that Cys C was associated with an increased risk of death and combined events in patients with nSTE-ACS. Lind and colleagues(21) found the superiority of Cys C as a marker of cardiovascular risk compared to creatinine or eGFR. Vitamin K antagonist treated patients with increased Cys C levels should be considered to be at increased risk of cardiovascular events. The method they used to measure Cys C is turbidimetric immunoassay.
In previous reports, Cys C is usually measured by PENIA, PETIA, and ELISA. The ELISA method has a reported high correlation with both the nephelometric and turbidimetric methods.(22) Hossain and colleagues(23) did a research study to determine the differences among these methods. The research showed a significant difference between the ELISA and the two other methods in accuracy and precision; in addition the turbidimetric and nephelometric assays may be used interchangeably. However, PENIA and PETIA are lower-end detection methods. The monoclonal antibody is important to develop another better detection method. We believe that our research addressed the core problem.
Due to the importance of Cys C, the demand for determining Cys C is large. Although there are commercial kits, their high price restricts their application. This work provides a foundation for the development of ELISA kits that can be industrially produced, reduce Cys C testing costs, promote its clinical applications, develop other test methods, and provide a basis for other biological effects and mechanisms of Cys C.
Footnotes
Author Disclosure Statement
The authors have no financial interests to disclose.