




Abstract
DNA immunization offers the advantage of allowing for the initiation of animal immunogenicity studies while work to produce and purify the protein of interest is completed. In this study, we sought to evaluate in vivo electroporation (EP) as a means to enhance the antigen-specific immune response from DNA immunization. Mice were immunized thrice with DNA encoding the protein of interest through intramuscular (IM) or intradermal (ID) injections. Test animals were administered an electrical pulse into the muscle or dermis at the site of injection immediately following immunization. In addition, cardiotoxin was injected into the muscle of a subset of test animals 5 days before each DNA injection. Nine weeks following the final DNA immunization, mice were immunized with the encoded purified protein emulsified in Freund's adjuvant. Sera from EP mice taken 2 weeks following the final DNA immunization showed a significant enhancement in antibody response. Specifically, those mice treated with cardiotoxin, immunized IM and given EP showed a strong response, but this was only observed versus solid phase and not solution phase antigen, suggesting the resulting antibody was of low titer and affinity. Similar testing following the protein immunization revealed a significant improvement in relative affinity versus sera taken following DNA immunization. Our results suggest EP can enhance the immune response elicited by DNA immunization.
Introduction
I
DNA constructs, alternatively, are easy to prepare, inexpensive, and stable and, as an additional benefit, may allow the protein to be expressed in its native confirmation. DNA immunization is relatively simple to perform for a range of animal species (mice, rabbits, and guinea pigs) and allows for the commencement of animal immunization while work to produce and purify the antigen of interest is completed. Significant research has been accomplished showing the capability of DNA immunization to generate an antibody response. Diverse DNA immunization protocols have been used, with variations on plasmids, as well as dose, route, and number of DNA immunizations.(1–4)
In addition, in vivo electroporation (EP) offers an approach to improve the cellular uptake and, thereby, the degree of expression of the immunized DNA.(1) With in vivo EP, a series of electrical pulses are applied to the muscle or dermis, resulting in a disruption of the cell membranes and creating an easy pathway for DNA uptake. Several groups have used EP in conjunction with intradermal (ID) or intramuscular (IM) immunization in mice and were able to generate monoclonal antibodies, some with desired affinities.(5,6)
Another older methodology used in mice involves injecting cardiotoxin (snake venom) into the targeted leg muscle several days before DNA administration.(7) Cardiotoxin triggers a breakdown of the muscle fibers and an “increase in the permeability of membranes to small ions,”(8) allowing for the enhanced uptake of DNA, similar to EP. Previous studies in our laboratory showed that mice dosed with cardiotoxin 5 days before IM DNA immunization yielded a stronger average serum antibody response to the encoded protein versus animals immunized IM without cardiotoxin (author's unpublished results, see Discussion section). In addition, in the same study, we saw a greater antibody response using IM versus ID immunizations. Using cardiotoxin and IM immunizations as our standard methodology, we sought in this study to evaluate in vivo EP as a means to further enhance the antibody response following DNA immunization.
Materials and Methods
Plasmid construction
The gene of interest was amplified by polymerase chain reaction and inserted into the EcoRV site on pVAC1 (InvivoGen) flanked by the 5′ IL2 signal sequence and the 3′ glycosylphosphatidylinositol (GPI) anchoring domain of human placental alkaline phosphatase (PLAP) (Fig. 1). Plasmids were grown in Escherichia coli Mach 1 (Life Technologies) and purified by endotoxin-free anion exchange resin (Qiagen). The concentration was assessed spectrophotometrically, and the constructs were confirmed by restriction enzyme digestion and sequencing.
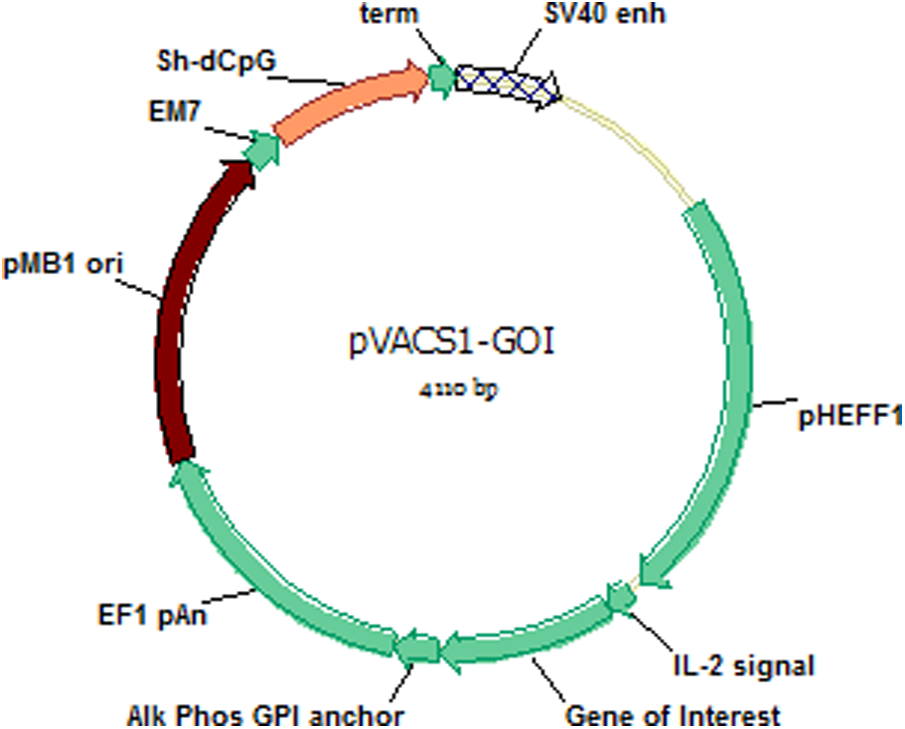
Plasmid map.
Transient expression of antigen
To determine if the antigen of interest could be expressed in vitro, plasmid DNA was transiently transfected into HEK cells (NRC) using PEI (Polysciences). Fifty milliliters of HEK-6E cells, grown in Freestyle 239 media (Invitrogen), was transfected with the pVAC plasmid encoding the antigen of interest using a ratio of 2:1 DNA:PEI. Transfections were allowed to proceed for 6 days before harvesting cells to test for the expression of antigen.
Flow cytometry
Before DNA immunization, expression of the protein of interest from pVAC1 was confirmed by transient transfection of HEK cells and staining of the cell surface expressed protein by flow cytometry using antibodies against the protein of interest. Three million transfected HEK cells were washed with phosphate-buffered saline (PBS; Invitrogen) before incubation for 30 minutes on ice with 1:50 diluted mouse sera specific for the antigen of interest (produced in-house). After two washes, the cells were further incubated on ice for 30 minutes with Alexa Fluor 488 labeled anti-mouse antibody (Invitrogen). After a final wash, cells were analyzed on the FACSAria (Becton Dickinson) flow cytometer; the FACSDiva program was used for data acquisition and analysis. Nonspecific binding was quantified using cells labeled with only the labeled anti-mouse antibody and 5000 events were analyzed for each sample.
Animal immunization
BALB/cJ mice (The Jackson Laboratory) were immunized thrice with 100 μg DNA diluted in saline through IM or ID injections. IM injections were completed as 50 μL inoculum (50 μg DNA) into each tibialis anterior (TA) muscle while ID injections were administered as 50 μL inoculum (50 μg DNA) into the dermis just above each TA. Test animals were administered an electrical pulse into the muscle or dermis at the site of each injection immediately following DNA immunization using the AgilePulse In Vivo Electroporation device (BTX Harvard Apparatus; see Tables 1 and 2 for electrical pulses used). Separate site-specific needle arrays from the vendor were used for IM and ID immunizations. In addition, 50 μL of a 5 μM solution cardiotoxin (Latoxan) was injected into each TA of a subset of test animals 5 days before each DNA injection. Sera samples were taken 2 weeks following the third DNA immunization and stored frozen until testing.
Each voltage group is applied successively.
Each voltage group is applied successively.
Nine weeks following the final DNA immunization, mice were immunized with the purified encoded antigen emulsified in AdjuLite Complete Freund's adjuvant (Pacific Immunology). The antigen was diluted to the appropriate concentration in saline and then mixed 1:1 with adjuvant until a thick stable emulsion was formed. Each animal was administered 200 μL inoculum containing 35 μg antigen. The mice were bled again 2 weeks later and sera collected for testing. Sera samples were evaluated for antibody reactivity to solid and/or solution phase antigen.
Solid and solution phase assay screening
For testing to solid phase antigen, the antigen of interest was diluted to 1 μg/mL in PBS (pH 7.2), coated onto assay plates (NUNC), and incubated overnight at room temperature. The antigen was then removed and the plates blocked with 200 μL/well blocking solution (2% w/v bovine serum albumin and 1% v/v polysorbate-20 diluted in PBS). Plates were incubated at room temperature for 30 minutes, the blocking solution removed, and then the plates washed 4 × with distilled water (dH2O). Next, serum test samples serially diluted in blocking solution were added to the assay plates (100 μL/well), incubated at room temperature for about 1 hour, removed, and the plates washed 4 × with dH2O. Horseradish peroxidase (HRP) labeled sheep anti-mouse IgG (Jackson ImmunoResearch; diluted to 200 ng/mL in block) was then added to all assay wells (100 μL/well), incubated for 30 minutes, removed, and the plates washed 4 × with dH2O. Color was developed using 100 μL/well O-phenylenediamine (OPD; Abbott Laboratories) and the signal quenched with 100 μL/well 1N sulfuric acid. Signal was read at 492 nm.
For solution phase screening, assay plates were coated with 100 μL/well sheep anti-mouse IgG, Fc fragment specific antibody (Jackson ImmunoResearch) diluted to 2 μg/mL in PBS. Plates were incubated overnight at room temperature, the capture antibody removed, and the plates blocked and washed as previously described. Next, 100 μL/well serially diluted (in block) sera samples were added, incubated for 1 hour, removed, and the plates washed 4 × with dH2O. Antigen with biotin incorporated into the c-terminus of the coding sequence (prepared in-house) was added next (1 μg/mL in block, 100 μL/well), incubated for 10 minutes, removed, and the plates washed 4 × with dH2O. HRP-labeled streptavidin (Jackson ImmunoResearch) was then added (200 ng/mL in block, 100 μL/well), incubated for 30 minutes, removed, and the plates washed 4 × with dH2O. Color was developed using 100 μL/well OPD and the signal quenched with 100 μL/well 1N sulfuric acid. Signal was read at 492 nm.
Determination of relative affinity
To determine relative affinity, a single dilution of serum antibody was tested against limiting concentrations of solution phase antigen using the procedure previously described for solution phase testing. Data were plotted in KaleidaGraph software (Synergy) and the Ag50 value (antigen concentration at half-max) calculated using the following calculation: M1 + M2 × M0/(M3 + M0); M1 = 0.05; M2 = 1; M3 = 100, where M1 = ratio at minimum antigen concentration, M2 = ratio at maximum antigen concentration (max/max), and M3 = approximate antigen concentration at 0.5 b/bmax. Data were analyzed for statistical significance using JMP 8 software (see Fig. 2, e.g., plot).
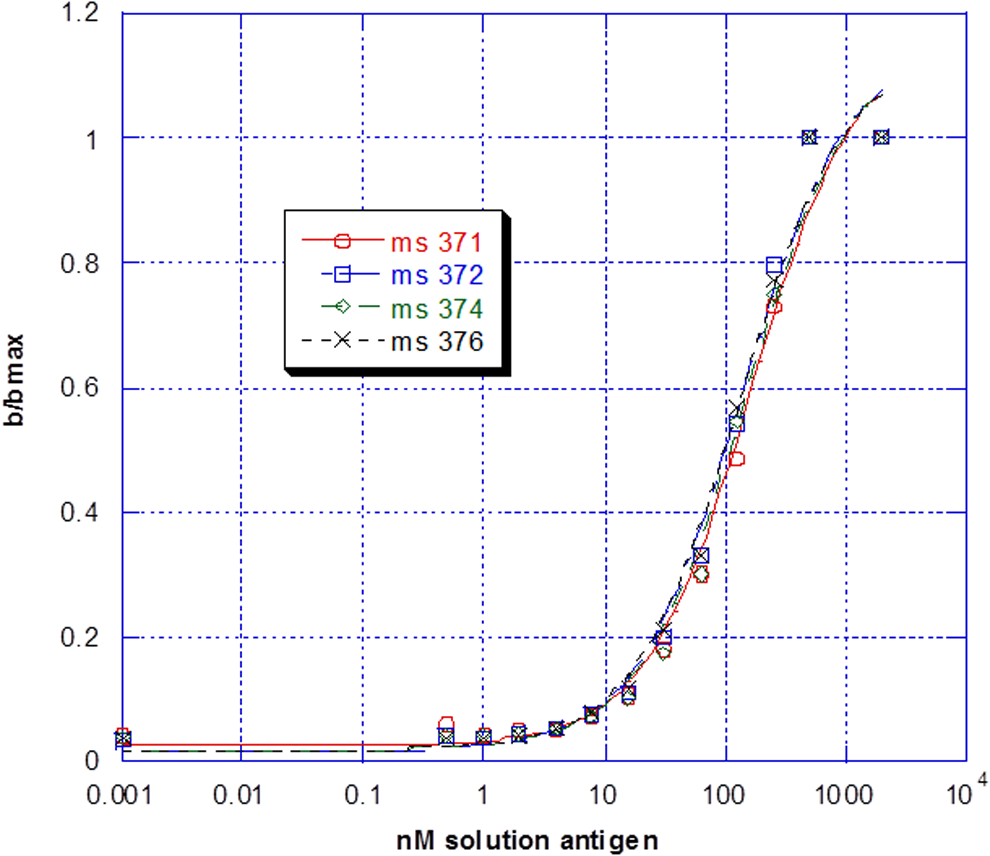
Example antigen titration curves.
Isotype assay
The antigen of interest or goat anti-mouse antibody (Southern Biotech) was diluted to 1 μg/mL in PBS; 100 μL coated onto wells and incubated overnight at room temperature. The reagents were removed and the plates blocked as previously described. Diluted test samples or normal mouse serum was added to the assay plates (100 μL/well), incubated at room temperature for about 1 hour, removed, and then washed 4 × with dH2O. Isotype-specific conjugates (Southern Biotech; diluted to 200 ng/mL in block) were then added to appropriate assay wells (100 μL/well), incubated for 30 minutes, removed, and the plates washed. Color was developed using 100 μL/well OPD and the signal quenched with 100 μL/well 1N sulfuric acid. Signal was read at 492 nm.
Results
Expression plasmid validation
To evaluate the expression of antigen from the plasmid, HEK-6 cells transiently transfected with pVAC encoding the antigen of interest were analyzed by flow cytometry (Fig. 3a, b). There was some background binding of the Alexa Fluor 488 labeled anti-mouse antibody (9.4%), but significantly higher binding of the conjugate on cells incubated with mouse sera specific for antigen of interest (92.7%). These observations suggest that the constructed plasmid was able to express the antigen of interest in vitro.

Immune response
Previous work done with DNA immunizations in our laboratory showed significantly stronger serum antibody binding to solid phase coated antigen versus solution phase antigen, indicating that the response was of relatively low titer and weak affinity. To fully evaluate the magnitude of the antibody response in the current study, samples taken following three DNA immunizations were evaluated in a similar manner.
First, results show mice immunized using a regimen consisting of a cardiotoxin predose; IM injections and EP yielded the highest average antibody signal and endpoint titer (highest dilution with signal >2 × background) to solid phase antigen versus all other test groups (Table 3 and Fig. 4). In addition, results suggest that EP provided a greater average benefit as to strength of response in IM immunized mice than did cardiotoxin. Also, mice immunized ID with EP yielded a stronger average response versus mice immunized ID without EP. Finally, IM injections trended toward a superior response versus ID injections. When these same sera samples were tested for reactivity to solution phase antigen, results showed a much lower signal across all immunization regimens, although the highest average signal was still seen in IM mice with EP (Table 3). This weak response versus solution phase antigen is most likely an indication of low antibody concentration and weak antibody affinity and was an expected result.

Mouse sera endpoint titer results.
Average signal at 1:200 sera dilution versus solid phase and solution phase antigen following three DNA immunizations. Groups (N = 5) not connected by the same letter are significantly different, p = 0.05. Solid phase and solution phase data comparisons are independent of one another.
EP, electroporation; ID, intradermal; IM, intramuscular.
Mice were subsequently administered a single immunization with the encoded antigen emulsified in AdjuLite Complete Freund's adjuvant. This was completed to drive toward a higher affinity and higher titer antibody response. While those mice immunized using a regimen consisted of a cardiotoxin predose, IM injections and EP again yielded the greatest antibody response; we saw considerable reactivity to solution phase antigen in all groups except for those mice originally administered DNA by the ID route, with no EP (Figs. 5 and 6). The relative affinity, as measured by antigen titration, of responding animals from the various test groups was also similar (Table 4). These affinities are similar to mice from a separate study, which were immunized 3 × with antigen in adjuvant only, although a direct comparison cannot be made due to variations in the two studies (unpublished results).

Mouse sera testing results versus solution phase antigen.
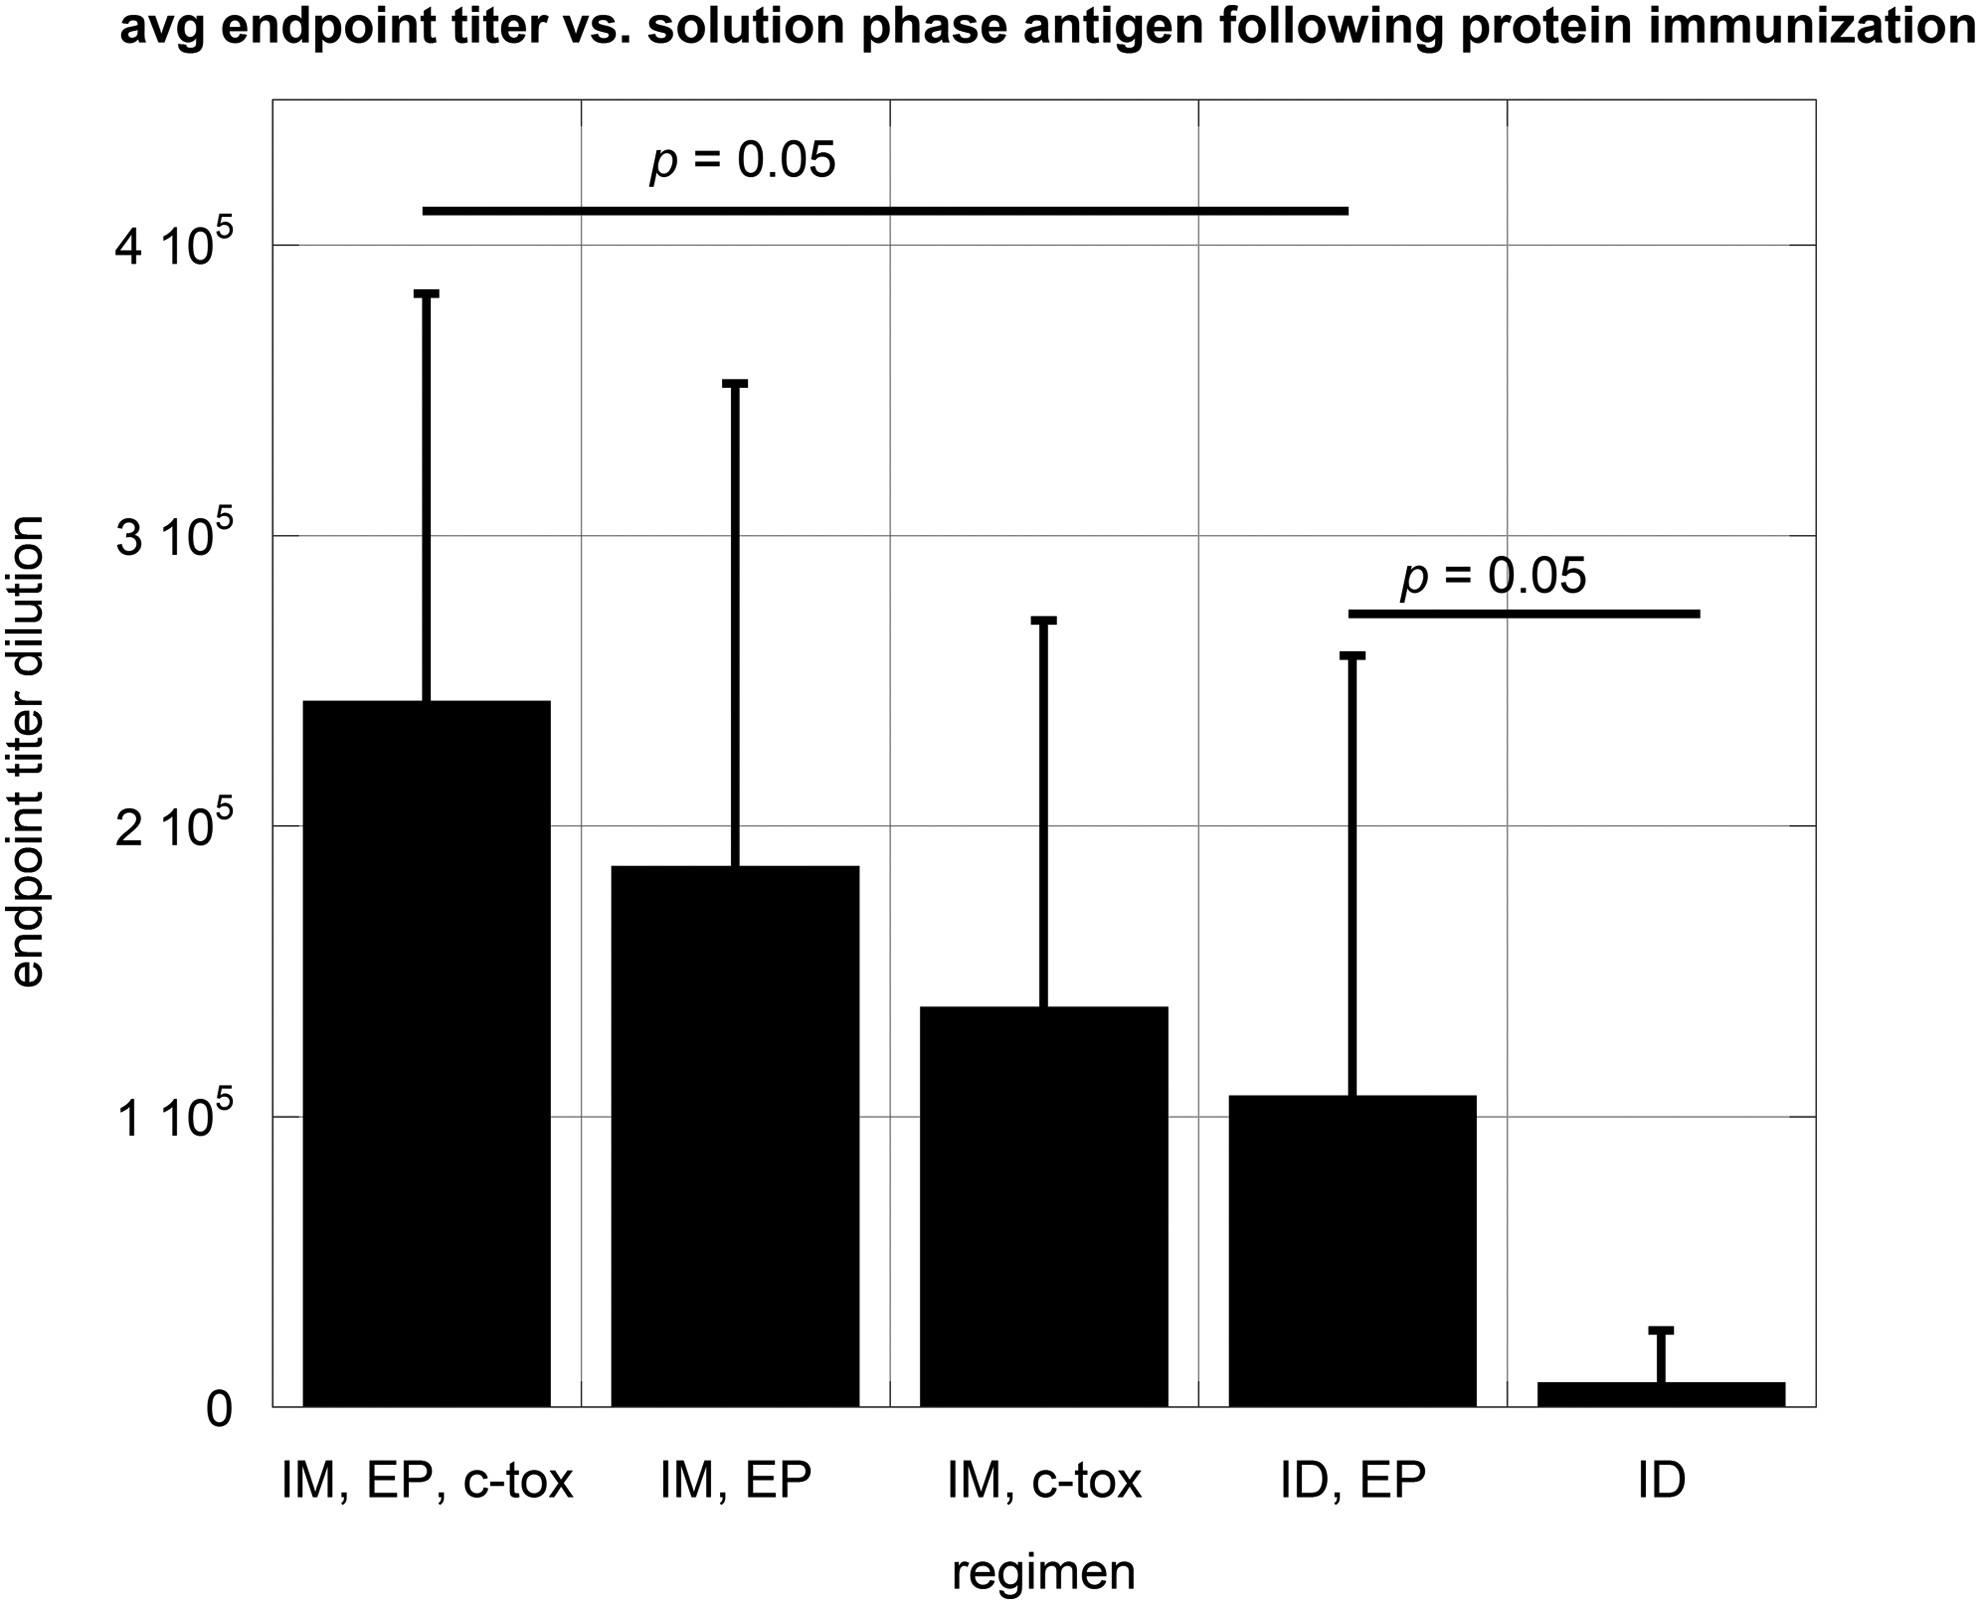
Mouse sera endpoint titer testing.
Ag50, antigen concentration at 50% maximum binding; lower Ag50 corresponds to higher relative affinity; ID, intradermal; IM, intramuscular; ND, relative affinity not determined due to weak immune response.
While IgG2a/2b isotypes dominated the immune response following DNA immunization, IgG1, 2a, and 2b were most prevalent after protein immunization with adjuvant, which is common for animals immunized with Freund's adjuvant (personal observation) (Fig. 7).
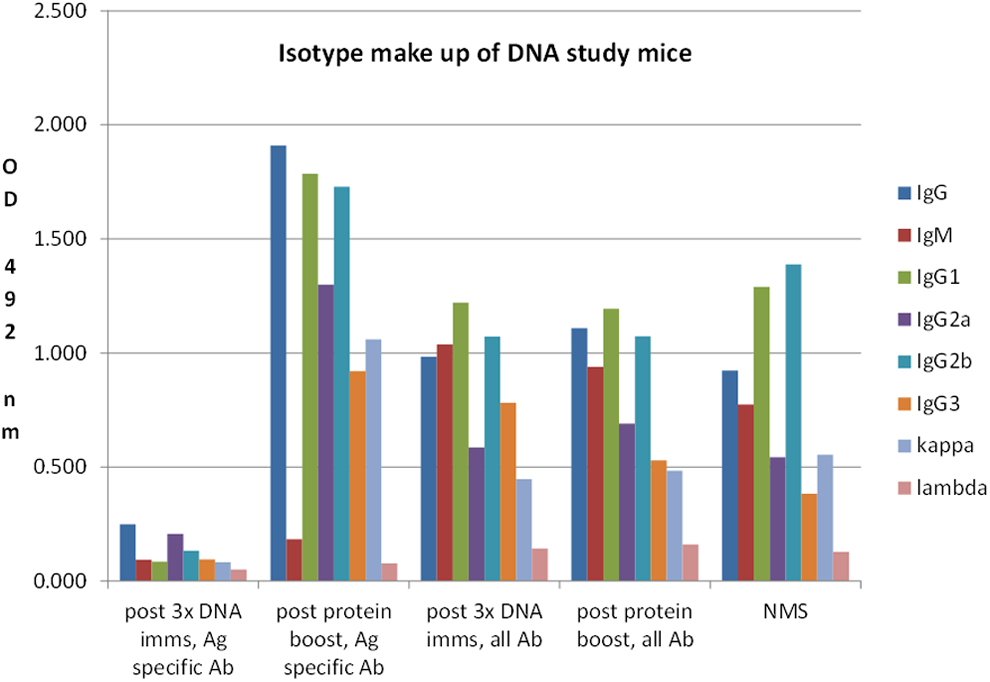
Mouse sera isotype determination.
Discussion
Previous, unpublished DNA immunization work completed in our laboratory showed mice immunized IM yielded a greater response versus those immunized ID. In addition, in the same study, we saw that the preadministration of cardiotoxin IM yielded a significant increase in the strength of the antibody response following DNA immunization. In this study, a DNA immunization study was completed to determine whether the use of EP could further enhance the antibody response compared to our laboratory's standard methodologies.
Results indicate the use of EP had a definite benefit on the resulting serum antibody response following DNA immunization. The immunization regimen using a cardiotoxin predose, IM immunizations, and EP yielded the greatest average antibody response among all test groups. This group produced the highest average maximum signal, as well as the highest average endpoint titer, when sera samples were tested for reactivity to solid phase coated antigen. Animals immunized ID with EP also yielded a higher average maximum signal and endpoint titer versus ID only mice. These findings suggest the degree of DNA uptake, and therefore, expression was substantially greater in mice where EP was used, resulting in a greater antibody response. The fact that the strongest antibody response was seen in c-tox/IM/EP mice further suggests EP and cardiotoxin work synergistically to allow for enhanced DNA uptake. Since both EP and cardiotoxin function in a similar manner, it could be that individual cells become more permeable to DNA penetration or that a greater number of cells become permeable enough to allow for sufficient DNA uptake.
The response trend we saw following three DNA immunizations continued after the administration of a single dose of protein emulsified in adjuvant, although the difference between treatment groups was not as significant. This suggests that even a weak response following DNA immunization is enough to prime the immune system and prepare it for a strong memory response following protein/adjuvant boost. Our results also show a trend toward a stronger immune response for IM versus ID immunizations. The reasoning for this is not clear, as some groups have found ID immunizations to perform superior to IM immunizations. One possibility is that the plasmid used in our study is taken up better by cells in the muscle versus those in the dermis, although other options certainly exist.
Serum IgG isotype determination was completed to establish the representation of each subclass and to observe whether there was a difference in subclass makeup post DNA immunization versus post protein/adjuvant immunization. While IgG2a represented a higher proportion of antibody following DNA immunization, IgG1 represented the highest percentage following protein/adjuvant immunization, which is what we typically see with protein/adjuvant immunizations.
To conclude, our results suggest a definite benefit to the use of EP for stimulating a strong antibody response from DNA immunization. Furthermore, the use of EP along with cardiotoxin and IM immunization yielded the strongest serum antibody response. Future variations on this work are possible to look at the dose of DNA used, number of DNA immunizations, coadministration of adjuvant with DNA, and alternate plasmids.
Footnotes
Author Disclosure Statement
No competing financial interests exist.