
Abstract
Abstract
We analyzed in vitro activities and pharmacokinetics/pharmacodynamics (PK/PD) parameters of veterinary fluoroquinolones against avian pathogenic Escherichia coli (APEC) strains from cases of avian colibacillosis. The median of minimum inhibitory concentration (MIC50) values against APEC strains for enrofloxacin (ERFX) and danofloxacin (DNFX) were 0.25 μg/ml and for norfloxacin (NFLX) and ofloxacin (OFLX) were 0.5 μg/ml. The percentage of resistant strains for ERFX, DNFX, NFLX, and OFLX were 24.4%, 23.6%, 22.8%, and 23.6%, respectively. Scattergrams of the MICs of ERFX compared to DNFX, NFLX, and OFLX for 127 strains demonstrate a clear correlation between the MIC of ERFX and that of other fluoroquinolones. The differences in amino acid substitution in GyrA may play a role in the variation of MIC values for fluoroquinolones. The ratios of peak serum concentration to MIC (Cmax:MIC) and ratios of area under the curve to MIC (AUC:MIC) were relatively high in ERFX and OFLX compared to other fluoroquinolones. These results indicate that although the in vitro activities of these fluoroquinolones against APEC isolates are slightly different, the PK/PD values vary with PK parameters. Therefore, we need to consider the PK/PD parameters in the choice of fluoroquinolones during treatment of avian colibacillosis.
Introduction
There are many published studies about minimum inhibitory concentrations (MICs) of fluoroquinolones against E. coli isolated from chickens,15,19,22,23 but the differences of in vitro activities and the differences of in vivo activities among these fluoroquinolones have not been discussed in the veterinary field. Pharmacokinetics/pharmacodynamics (PK/PD) analysis is applied to evaluate the clinical usefulness of antimicrobial agents. 5 The most popular PK parameters are the area under the plasma concentration time curve (AUC) and the maximum plasma concentration (Cmax). The most commonly used PD parameter is MIC. Fluoroquinolones are classified as a concentration-dependent drug where increasing concentrations at the site of infection improves bacterial death and the AUC:MIC and Cmax:MIC ratios are the PK/PD parameters that correlate with efficacy. 5
The aim of this study was to evaluate the MICs of four veterinary fluoroquinolones against APEC strains. In addition, we estimated the differences of in vivo activities among these fluoroquinolones in the treatment of avian colibacillosis based on PK/PD analysis.
Materials and Methods
Bacterial strains
A total of 127 strains of E. coli were used. These strains were isolated from chickens (one isolate/chicken) found to have colibacillosis between 2001 and 2007 in Japan, including 83 isolates investigated in our previous report. 15 All isolates originated from nonalimentary tissues such as heart, liver, kidney, spleen, brain, and the articular cavity. E. coli strains were isolated on desoxycholate–hydrogen sulfate–lactose agar (Eiken Co. Ltd.) and confirmed as E. coli with the API20E bacterial identification system (bioMerieux, Inc.). Isolates were stored in 10% sterile skimmed milk at −80°C until use.
Antimicrobial susceptibility testing
Five antimicrobial agents—ERFX, DNFX, NFLX, and OFLX, which are approved for use against avian colibacillosis in Japan, and nalidixic acid (NA)—were tested. MICs were determined by an agar dilution method according to the standards of the Clinical and Laboratory Standards Institute.3,4 E. coli ATCC 25922, Staphylococcus aureus ATCC 29213, Pseudomonas aeruginosa ATCC 27853, and Enterococcus faecalis ATCC 29212 were used for quality control in MIC determinations. Breakpoints established by the Clinical and Laboratory Standards Institute were used for NA, ERFX, NFLX, and OFLX. The breakpoint for DNFX was set by MIC distribution to discriminate between the different populations such as sensitive population, intermediate population, and resistant population.1,20
Sequencing of gyrA, gyrB, and parC
The quinolone-resistance determining regions of gyrA, gyrB, and parC were amplified as previously described. 7 Polymerase chain reaction products were purified using the QIAquick PCR purification kit (Qiagen) and sent to FASMAC Co. Ltd. for DNA sequencing. Dye terminator cycle sequencing was performed with the BigDye Terminator v3.1 Cycle sequencing kit and Applied Biosystems 3730xl DNA Analyzer (Applied Biosystems). Sequences obtained were compared with those previously reported for gyrA (GenBank accession no. X06373), gyrB (X04341), and parC (M58408).
PK/PD analysis
The PK/PD parameters Cmax:MIC and AUC:MIC were calculated for the four fluoroquinolones. 13 The protein binding was not considered in the calculation. The AUC0→∞ and Cmax values in chickens were taken from other studies.9–11 The dosages of these fluoroquinolones except NFLX were the same as approved dosages for chickens in Japan. The dosage of NFLX in Japan is 20 mg/kg. As PD parameters, MIC50 and MIC90 values in this study were used.
Results
Antimicrobial susceptibility
Scattergrams correlating the MIC of ERFX to DNFX, NFLX, and OFLX for the127 APEC strains are presented in Fig. 1. These results demonstrate that there is a clear correlation between the ERFX susceptibility and susceptibility to other fluoroquinolones. The number of isolates that showed identical MIC values to those of ERFX was 97 (76.4%) for DNFX, 38 (29.9%) for NFLX, and 28 (22.0%) for OFLX. The MIC of NFLX was generally higher than ERFX. The MIC values of OFLX were generally higher than ERFX when the concentration of ERFX was between 0.03 and 4 μg/ml, but OFLX MICs were lower when ERFX was 16–128 μg/ml. The MICs for DNFX exhibited a trimodal distribution with peaks of ≤0.03, 0.25, and 16 μg/ml. Therefore, the breakpoints for DNFX were as follows: sensitive, ≤0.125 μg/ml; intermediate, 0.25–2 μg/ml; resistant, ≥4 μg/ml.
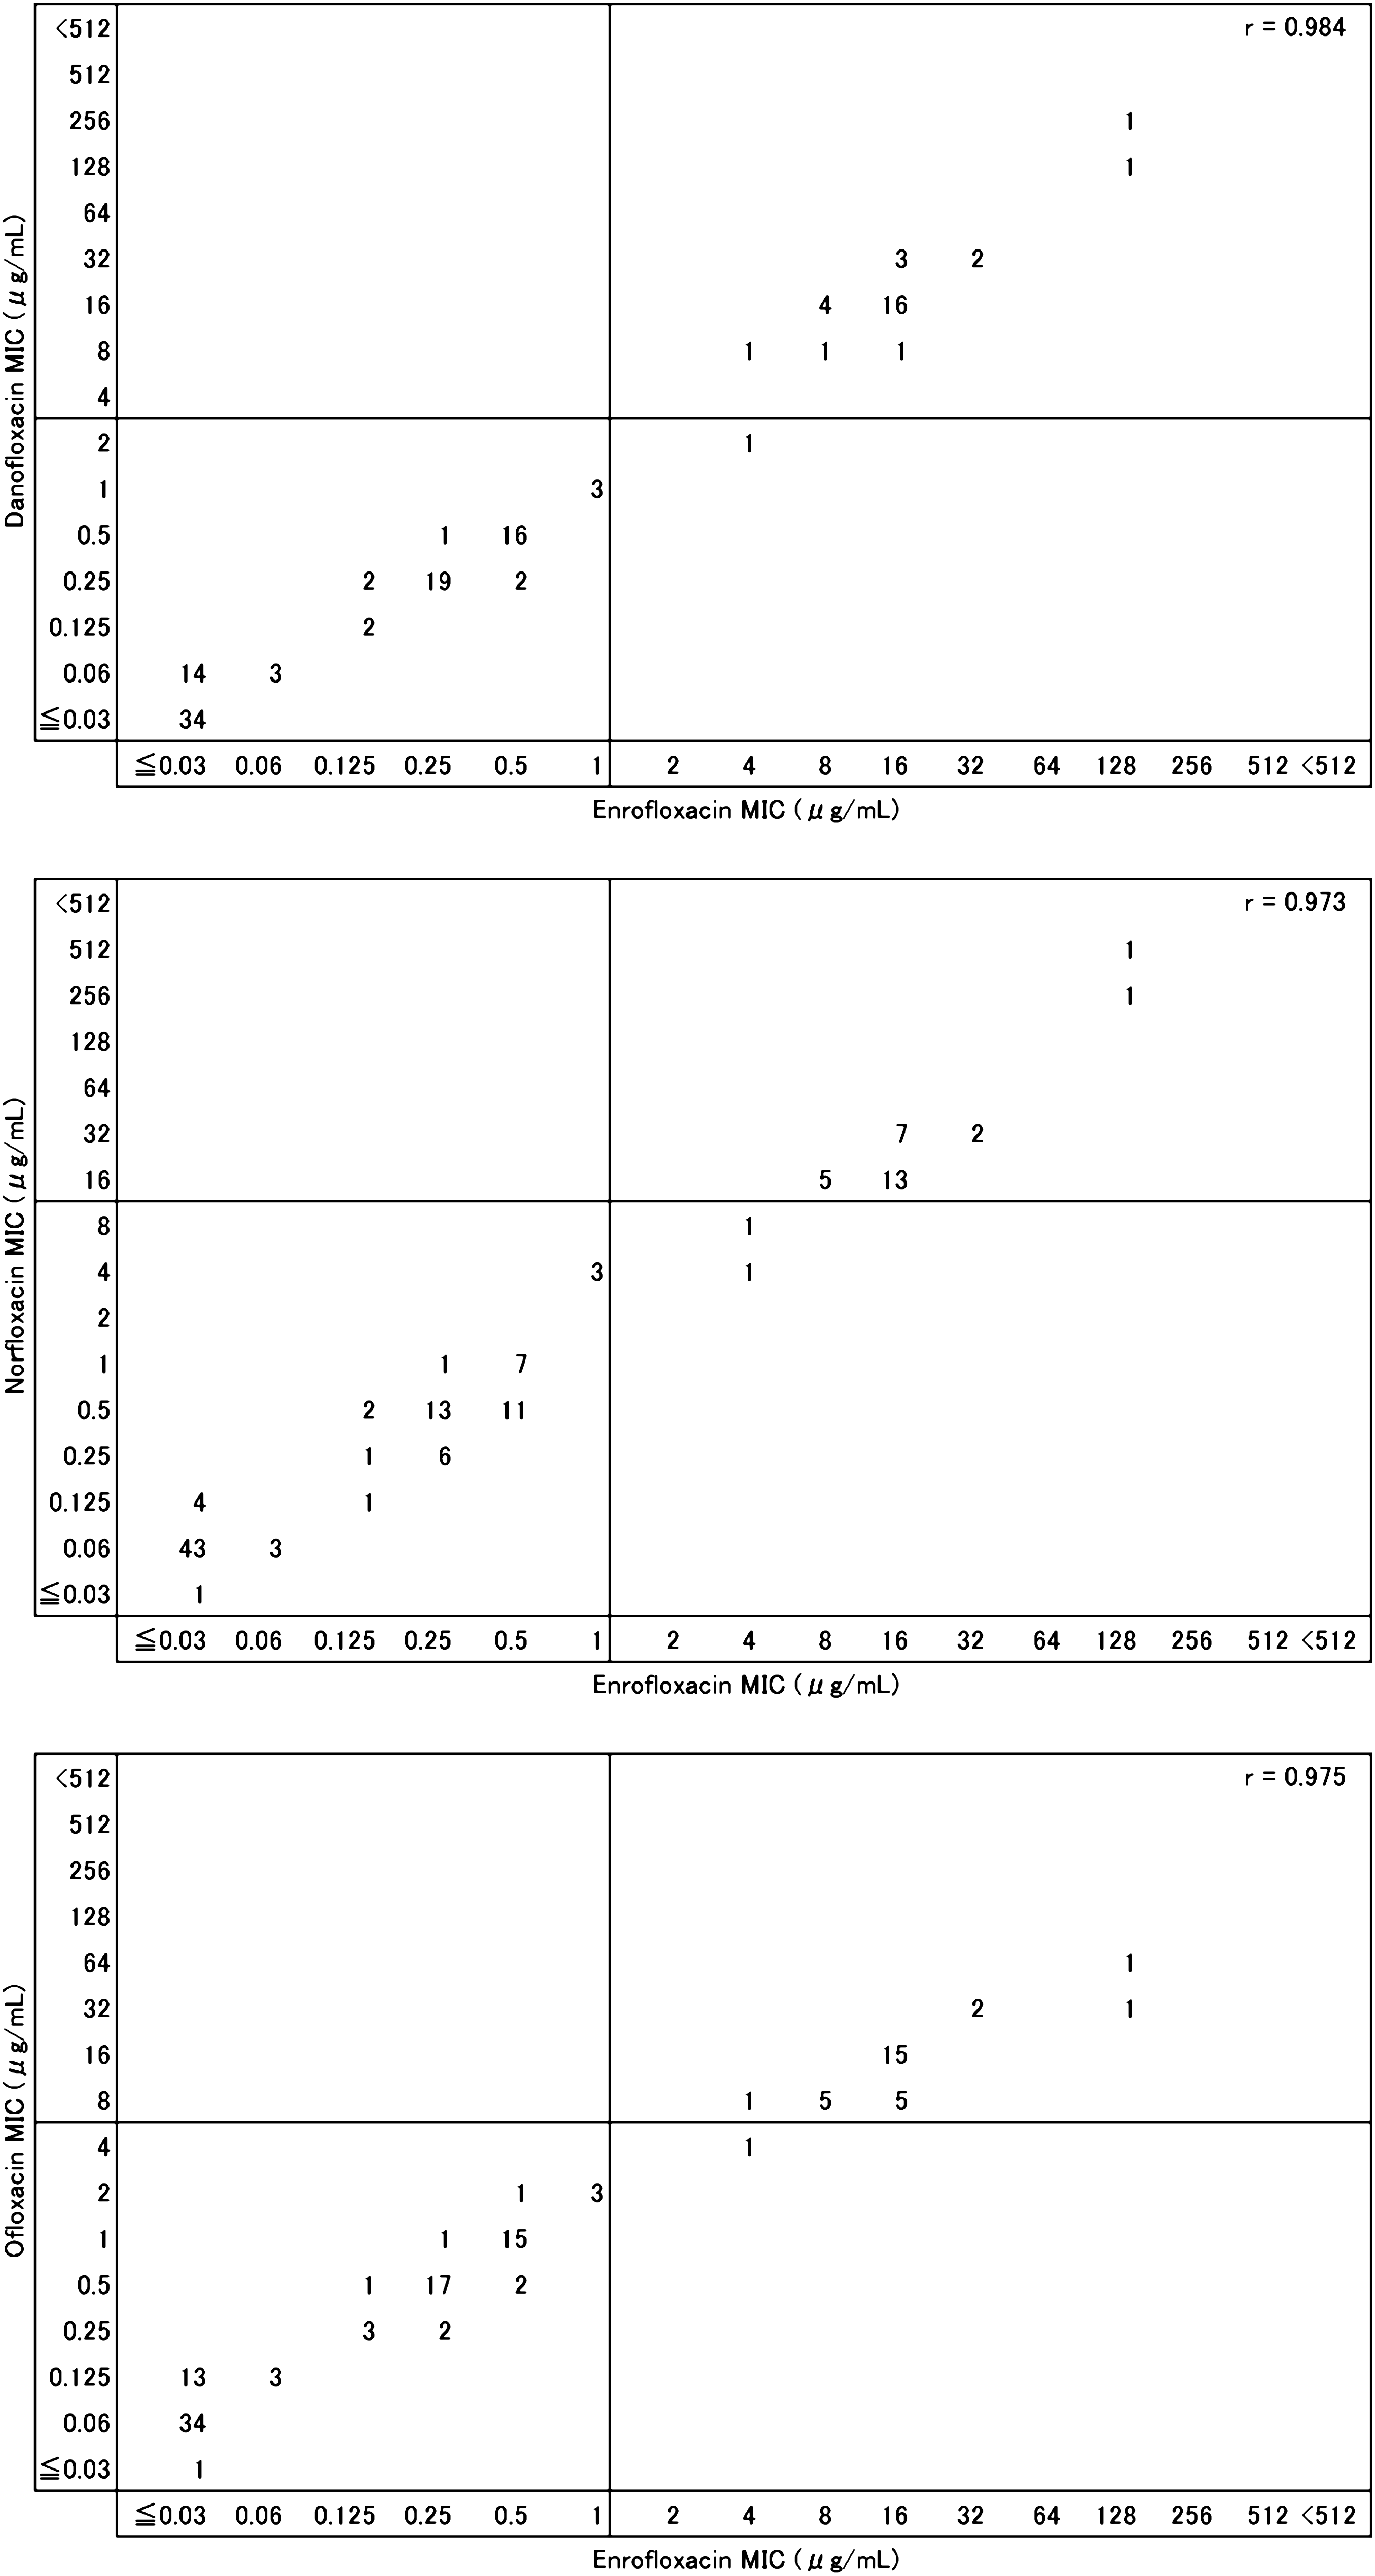
Scattergrams demonstrating the MICs of enrofloxacin compared to other fluoroquinolones. Numbers within the scattergrams indicate the numbers of avian pathogenic Escherichia coli strains. A total of 127 avian pathogenic Escherichia coli strains were investigated. The vertical lines indicate the Clinical and Laboratory Standards Institute breakpoint to enrofloxacin. The horizontal lines indicate the respective Clinical and Laboratory Standards Institute (norfloxacin and ofloxacin) or microbiological (danofloxacin) breakpoints. MICs, minimum inhibitory concentration.
Amino acid substitutions in DNA gyrase and topoisomerase IV
Table 1 shows the NA, ERFX, DNFX, NFLX, and OFLX MICs for 127 APEC isolates and deduced amino acid changes in the QRDR of GyrA, GyrB, and ParC proteins. All except one NA-resistant isolate exhibited an amino acid substitution in the GyrA protein. Two changes in the GyrA protein and at least a single change in the ParC protein were detected in all except one fluoroquinolone-resistant isolate. Our results revealed that the Asp87 → Gly substitution in the GyrA protein was associated with a lower fluoroquinolone MIC than the Asp87 → Asn change. The isolate containing the Asp87 → Gly substitution in the GyrA protein was resistant to ERFX and DNFX but susceptible to NFLX and OFLX. One isolate with a single amino acid substitution in the QRDR of GyrA (Ser83 → Leu) was resistant to ERFX and OFLX but susceptible to DNFX and NFLX. There was an NA-resistant isolate without amino acid changes in the QRDR of GyrA, GyrB, and ParC proteins (MIC, 128 μg/ml).
S, susceptible; I, intermediate; R, resistant, breakpoints for NA, ERFX, NFLX, and OFLX are according to Clinical and Laboratory Standards Institute. The breakpoints for DNFX are as follows: S, ≤0.125 μg/ml; I, 0.25–2 μg/ml; R, ≥4 μg/ml.
NT, not tested; WT, wild type; ND, not determined with primers used in this study; Ser, serine; Asp, aspartic acid; Leu, leucine; Asn, aspargine; Ile, isoleucine; Glu, glumatic acid; Gly, glycine; NA, nalidixic acid.
PK/PD analysis
The PD parameters (MIC50 and MIC90) were not so different among fluoroquinolones (Table 2). On the other hand, the PK/PD parameters varied with PK parameters. The AUC:MIC90 and Cmax:MIC90 values were very low compared to the AUC:MIC50 and Cmax:MIC50 values (Table 3).
Clinical and Laboratory Standards Institute breakpoint.
Microbiological breakpoint.
MIC, minimum inhibitory concentration; ERFX, enrofloxacin; DNFX, danofloxacin; NFLX, norfloxacin; OFLX, ofloxacin.
AUC0→∞ (not 0–24 hours).
AUC, area under the plasma concentration time curve; Cmax, maximum plasma concentration.
Discussion
The scattergrams of the MIC values for ERFX compared to those of DNFX, NFLX, and OFLX in APEC strains demonstrated that there is a clear correlation between the MIC of ERFX and other fluoroquinolones. The high correlation of ERFX and DNFX MICs may be attributed to the similarity in the drug structure of these agents. 10 The results of MIC distribution indicate that ERFX and DNFX exhibit the same levels of in vitro activity against APEC isolates. Similar results were demonstrated in E. coli strains isolated from cows 8 and chickens. 23 A previous study involving experimentally infected chickens reported that the clinical usefulness of ERFX was superior to DNFX. 2 The AUC:MIC and Cmax:MIC ratios have been shown to have a particular ability in determining the optimal activity of fluoroquinolones. 13 Our calculated AUC:MIC and Cmax:MIC ratios support the observation that ERFX is more suitable for the treatment of avian colibacillosis than DNFX. Likewise, OFLX can be more effective than DNFX. The dose of DNFX (5 mg/kg) is lower than that of other fluoroquinolones. Oral administration of 5 mg/kg DNFX to experimentally infected chickens has been shown to produce the same effect as the administration of 10 mg/kg DNFX. 16 Therefore, taking into account drug safety and drug residue levels, the lower dose should be selected.
Investigations of human clinical isolates have suggested that AUC:MIC ratios of >100 or Cmax:MIC ratios of >10 are required to prevent bacterial regrowth during treatment. 21 It is apparent that optimal AUC:MIC and Cmax:MIC ratios are achievable only for bacteria with low MIC values. Our calculated AUC:MIC90 ratios and Cmax:MIC90 ratios were very low, implying that the clinical efficacy of fluoroquinolones against APEC strains in Japan may be reducing. However, appropriate cut off values of AUC:MIC and Cmax:MIC ratios to determine the clinical efficacy of fluoroquinolones have not been established for the treatment of avian colibacillosis. Moreover, although it is important to consider protein binding in the PK/PD analysis, few data are available regarding protein binding in chickens. Although fluoroquinolones are classified as concentration-dependent drugs, Charleston et al. reported similar efficacies of continuous and pulsed regimens and suggested that the duration of exposure (time above MIC) is also important for antimicrobial effect in the treatment of avian colibacillosis. 2 Thus, the requirement of PK/PD analysis has not been fully established, and further investigation is required to predict the efficacy of veterinary fluoroquinolones for the selection of the appropriate drug.
In this study, the percentages of APEC strains resistant to these four fluoroquinolones differed. In previous studies also, the percentages of resistant strains have been reported to differ between fluoroquinolones.12,14,22,23 All isolates that were resistant to the four fluoroquinolones contained double amino acid substitutions in the GyrA protein (Ser83 → Leu and Asp87 → Asn). On the other hand, there was one strain with Ser83 → Leu and Asp87 → Gly substitutions in the GyrA protein that was resistant to ERFX and DNFX but susceptible to NFLX and OFLX. One strain that contained only a single amino acid substitution in the QRDR of GyrA (Ser83 → Leu) was resistant to ERFX and OFLX but susceptible to DNFX and NFLX. Relatively low MIC values against OFLX were observed in double GyrA and double ParC (Ser80 → Ile and Glu84 → Gly) mutants. A comparison of the OFLX MIC values in the double GyrA and ParC (Ser80 → Ile) mutants (8–32 μg/ml), and the double GyrA and double ParC (Ser80 → Ile and Glu87 → Gly) mutants (32–64 μg/ml) suggests that the amino acid substitution in position 84 of ParC may not so associated with an elevation of OFLX MIC values. As mentioned above, the variations of amino acid substitutions in the GyrA and ParC proteins may be involved in the variation of MIC values for each fluoroquinolone and result in the variation of percentages of resistant strains.
There was an NA-resistant isolate without an amino acid change in the QRDRs of GyrA, GyrB, and ParC (MIC 128 μg/ml), and there was a fluoroquinolone-resistant isolate with only a single amino acid substitution in the QRDR of GyrA (Ser83 → Leu). The possible reasons for quinolone resistance in these strains may relate to the amino acid changes without the QRDR, decreased outer-membrane permeability, overexpression of efflux systems, or plasmid-mediated quinolone resistance. 17
Conclusions
We have demonstrated that the in vitro activities of ERFX, DNFX, NFLX, and OFLX against APEC isolates are only slightly different. However, the PK/PD values vary with PK parameters. Therefore, consideration of PK/PD parameters of these fluoroquinolones would be required to choose appropriate drug in the treatment of avian colibacillosis.
Footnotes
Acknowledgment
We are grateful to the staff of the Livestock Hygiene Service Centers across Japan for providing us with E. coli strains.
Disclosure Statement
No competing financial interests exist.