
Abstract
The analysis comprised a total of 97,843 U.S. isolates from the Surveillance Network® database for the period 1996–2008. Penicillin resistance, when defined using the old Clinical Laboratory Standards Institute breakpoint (≥2 μg/ml), had an initial rise that started in 1996, peaked in 2000, declined until 2003, and rebounded through 2008 (15.6%, 23.2%, 15.4%, and 16.9%, respectively). Using the new Clinical Laboratory Standards Institute criteria and applying a breakpoint of ≥8 μg/ml to blood and bronchial isolates, resistance was unchanged (0.24% in 2003) but rose to 1.52% in 2008. Using the new meningitis criteria (≥0.12 μg/ml), resistance prevalence was 34.8% in 2008, whereas it was 12.3% using the old criteria (≥2 μg/ml) for cerebrospinal fluid isolates. The rise, fall, and subsequent rebound of penicillin resistance in the United States, presumably influenced by the introduction of the conjugate pneumococcal vaccine, is clearly seen with the old definition, but only the rebound is seen when the new criteria are applied. In the postvaccine period, isolates with minimum inhibitory concentrations of 1 and 2 μg/ml decline, whereas those with minimum inhibitory concentrations of 0.12–0.5 increase, which may signal the loss of resistant vaccine serotypes and the acquisition of resistance by nonvaccine serotypes.
Introduction
Despite the importance given to penicillin nonsusceptibility, several reviews4,8,10 had questioned the pre-2008 Clinical Laboratory Standards Institute (CLSI) 2 penicillin breakpoints, basing their conclusions on the lack of correlation between β-lactam/penicillin susceptibility and clinical or microbiological outcomes.
It is not widely understood that pre-2008 CLSI penicillin breakpoints were selected primarily because of their relevance to the treatment of meningitis, not their relevance to the treatment of respiratory tract infections. 5 Because capillaries and pulmonary alveoli are separated by no more than the thickness of two cells and a shared basement membrane, penicillin concentrations in the alveoli tend to approach those in the blood. Otitis media and sinusitis also needed redefinition of pneumococcal susceptibility; since tissues that line the middle ear and the sinuses are highly vascular and lack tight endothelial junctions that make up the blood–brain barrier, levels of penicillin achieved in these structures are likely to be closer to those in blood than those in cerebrospinal fluid (CSF).
There is nonetheless at least one review 12 that found a small detrimental effect in mortality against penicillin nonsusceptible in subjects with pneumonia (odds ratio 1.31, 95% confidence intervals [CI] 1.08–1.59).
The comparison between pre-2008 and the new 2008 revised breakpoints for meningitis, nonmeningitis intravenous, and oral administration can be seen in Table 1.
Modified from Weinstein et al. 13
Although the separation of meningitis syndrome from other conditions, and the further separation of parenteral versus oral antibiotic use in the new definition is warranted by a sound clinical rationale (Weinstein et al., 2009), the impact of the new definition on the epidemiology of penicillin resistance has not been thoroughly evaluated.
The objective of the study is to describe and contrast the differences over time in S. pneumoniae penicillin susceptibility rates when applying either the old or the new CLSI penicillin breakpoints using a large surveillance database.
Methods
The Surveillance Network® (TSN) [Eurofins Medinet] was the data source used for this investigation and analysis. TSN is an electronic database of strain-specific qualitative and quantitative antimicrobial susceptibility test data reported by clinical laboratories in North America that has been used extensively in the past 6 to evaluate various trends of penicillin nonsusceptibility in the United States. In addition to antimicrobial susceptibility profiles, other query parameters that were used individually or in any combination for analysis of antimicrobial susceptibility data included organism identification, the nine regions of the U.S. Census Bureau, age, gender, location (inpatient or outpatient), and specimen source.
This study focused specifically on S. pneumoniae and used TSN data collected from 1996 to 2008. The overall resistance prevalence of S. pneumoniae isolated from inpatient and outpatient specimens were calculated by using each patient group as the denominator.
Age was categorized into four groups: <5 years old, 5–18 years old, 19–65 years old, and older than 65. Three categories of clinical specimen source were analyzed and included CSF, which stands for meningitis syndrome; blood and nonsterile bronco-pulmonary isolates such as bronchoalveolar lavage, tracheal aspirate standing for nonmeningitis syndrome with intravenous administration of antibiotics; and ear and nasopharyngeal isolates standing for nonmeningitis syndrome via oral administration of antibiotics. Pre-2008 and 2008 CLSI breakpoints (CLSI, 2008) were used for the categorization of penicillin resistance for all years.
Three time periods are considered in the analysis: (1) before the introduction of the conjugate pneumococcal vaccine (1996–2000); (2) immediate period after the introduction of the vaccine (2000–2004); and (3) delayed period after the introduction of the vaccine (2004–2008).
The levels and trends in penicillin susceptibility, intermediate, and resistant are presented as annual prevalence plus minus a 95% CI. To evaluate these trends, cubic and linear splines were used to model the changes over time. Each antimicrobial has its own intercept and curve shape, given by a four knot cubic spline or a linear spline that hypothesizes an initial rise, a decline, and a subsequent rise in the rate of resistance in the three time periods defined above. The cubic spline is used to get the best shape for the curves and the linear splines for the significance or lack thereof of specific changes over time.
The cubic or linear splines were included in a logistic regression model to examine the association between time and various risk factors such as age group, source of the isolate, location (inpatient or outpatient), and census region. Since the data from year to year are not independent, mixed models were used to take into account the dependence of resistance prevalence from the current year to the past. STATA 11® was used to estimate adjusted resistance rates and 95% CI.
Results
The study comprised a total of 97,843 S. pneumoniae U.S. isolates for the period 1996–2008 with an average of 7,526 isolates per year and with a range of 2,207 (1996) to 10,403 (2004). Gender distribution was 56.2% male and 43.8% female, with no significant differences by gender among penicillin susceptible, intermediate, or resistant isolates. Mean age was 40.8 ± 31.5 years with those <5 years old being 26.8% of all isolates, and age groups 6–18, 19–64, and >65 were 7.3%, 38.3%, and 27.5% of all isolates, respectively.
Among all 7,483 S. pneumoniae isolates in 2008, using the old definition of ≤0.06 μg/ml, 56.2% (95% CI 55.1%–57.3%) of all isolates were susceptible to penicillin, whereas joining all three parts of the susceptible 2008 definition that proportion was 79.5% (95% CI 78.6%–80.4%). The comparison for intermediate isolates overall yielded 26.8% (95% CI 25.8%–27.8%) for the old and 11.3% (95% CI 10.6%–11.9%) for the new definition. Results for resistant isolates were 16.9% (95% CI 16.1%–17.7%) and 9.2% (95% CI 8.5%–9.8%) for the old and new definitions, respectively.
A comparison of the temporal trends of the Pre-2008 criteria of resistant (≥2 μg/ml) and the multisource new criteria using all isolates can be seen in Fig. 1. These overall comparisons, nonetheless, need to be put into the context of the three strata of the new CLSI definition.

Penicillin resistant isolates over time old (pre-2008) and new (2008) Clinical Laboratory Standards Institute definitions.
Separating the layers of the new definition (Table 1), there was no difference in the proportions of susceptible, intermediate, and resistant isolates when taking into account the pre-2008 definition for all categories of nonmeningitis oral administration syndromes and for the susceptible category of meningitis isolates (≤0.06 μg/ml).
If the new breakpoints for Intravenous antibiotic use and nonmeningitis syndromes such as bacteremia or pneumonia are applied, penicillin susceptibility levels in 2008 were 92.2% (95% CI 91.4%–92.9%), whereas using the old definition of ≤0.06 μg/ml that proportion was 58.8% (95% CI 57.4%–60.1%). The percentages for intermediate and resistant by syndrome and route of administration for the year 2008 can be seen in Table 2.
n = 11,185 (2008).
Meningitis
Meningitis isolates represented 1.4% of all S. pneumoniae isolates, and therefore their impact on the overall rates of the new definition was small. There were 72 isolates in 1996 and 107 in 2008, with an average of 149 ± 47 per year. CI are therefore very wide, and there is no statistical power to stratify estimates by age group or location.
Using the old criteria of >2 μg/ml for resistance among meningitis isolates, the maximum was reached in 2003 (28.8%, 95% CI 22.3%–26.1%) with very variable point estimates. Resistance levels were, nonetheless, significantly lower by 2008 (13.2%, 95% CI 7.0%–21.9%).
Using the new definition of >0.12 μg/ml for resistance among meningitis isolates, there is still a large amount of variability in the point estimates, with the maximum attained in the year 2000 (58.2%, 95% CI 50.1%–66%), but with a statistically significant trend toward lower rates, the lowest being 2008 (35.2%, 95% CI 25.4%–45.9%).
Pneumonia/bacteremia (nonmeningitis syndrome IV administration)
The largest differences between the old and new criteria occur among nonmeningitis syndromes with IV administration. To investigate these differences we used 29,560 isolates from blood and bronco-pulmonary sources (presumably pneumonia/bacteremia) while excluding all CSF and sputum isolates.
Intermediate isolates according to the old criteria (0.12–1 μg/ml) had mostly nonsignificant changes with a small tendency to increase between their lowest rates in 2000 (17.6%, 95% CI 15.8%–18.4%) to their highest rates in 2006 (22.6, 95% CI 20.9%–24.3%; Fig. 2).
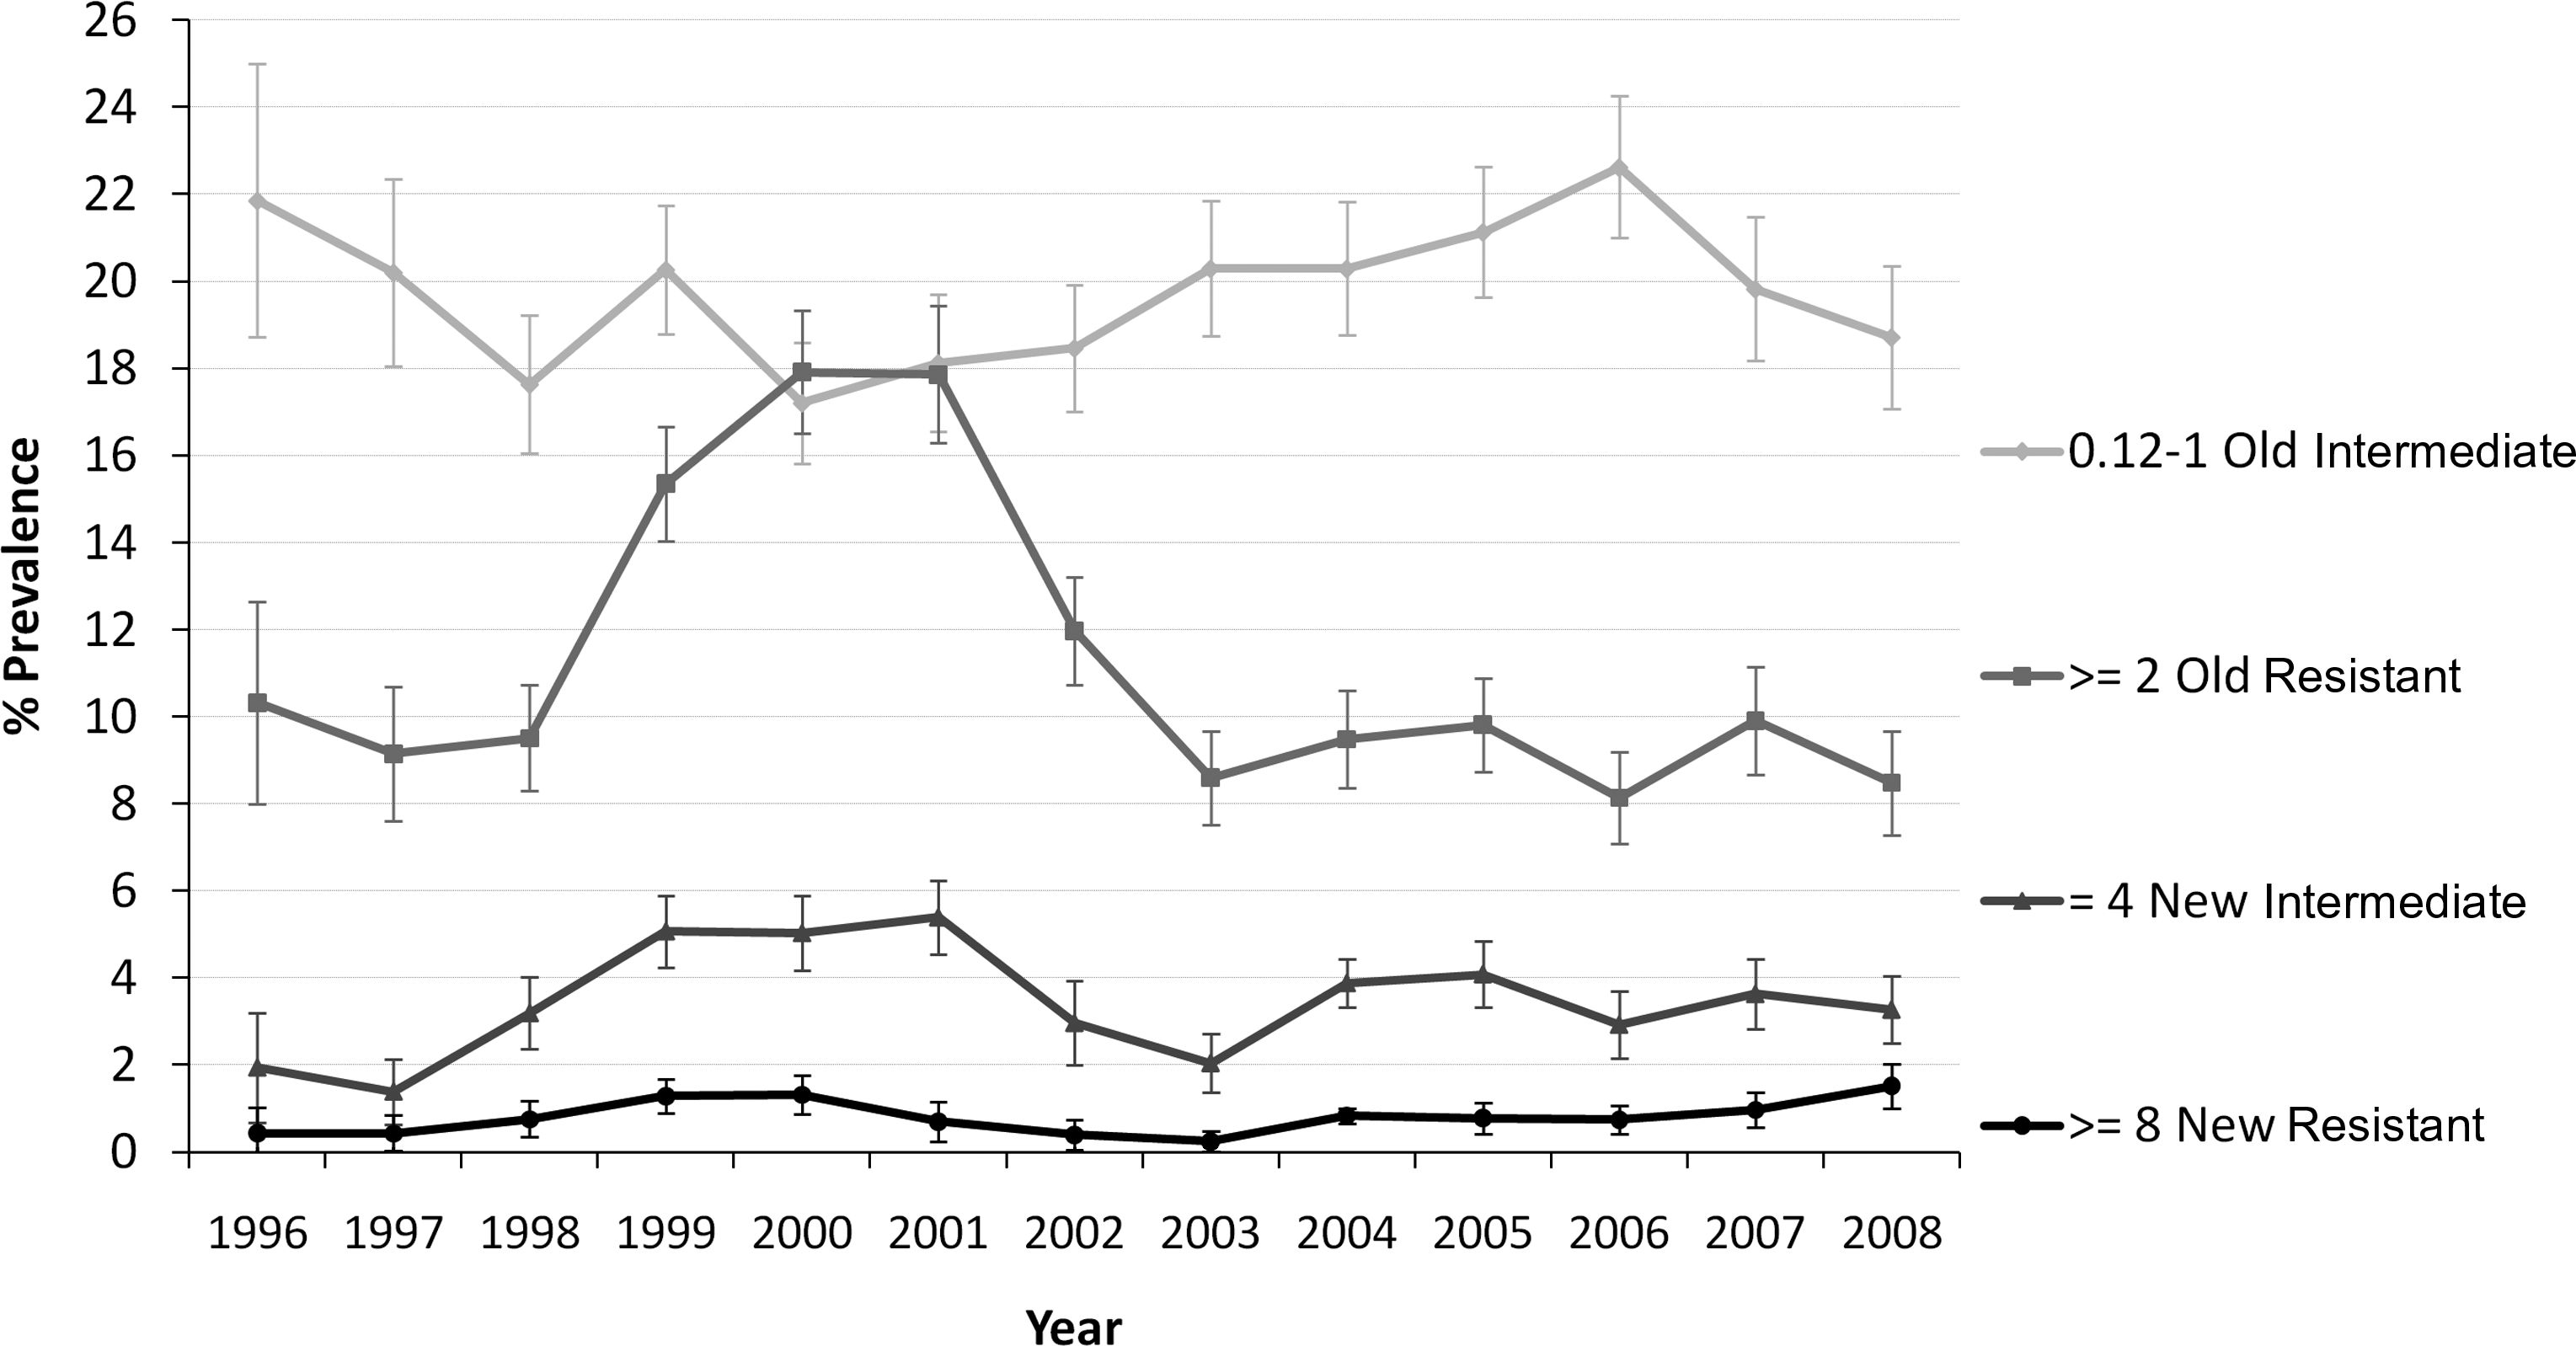
Blood isolates: intermediate and resistant according to old and new definitions.
Intermediate isolates according to the new criteria (4 μg/ml) have similar significant but more muted changes going from 1.9% in 1996 (95% CI 0.9%–3.7%) to 5.0% in 2000 (95% CI 4.2%–5.9%), then dropping to a low of 2.0% in 2003 (95% CI 1.5%–2.7%), and climbing nonsignificantly to 3.3% in 2008 (95% CI 2.6%–4.1%).
Resistant isolates according to the old criteria (≥2 μg/ml) show very large and significant differences rising from 10.3% in 1996 (95% CI 8.1%–12.9%) to 17.9% in 2000 (95% CI 16.5%–19.4%), then dropping to 8.6 in 2003 (95% CI 7.5%–9.7%) with no significant changes after that year (Fig. 2).
Resistant isolates according to the new criteria (≥8 μg/ml) follow a similar pattern but with rates around 1%, with relatively small numbers. The only difference was a sustained and significant increase from their lowest levels after 2003 (0.24% [6/2,450], 95% CI 0.09%–0.53%) to 1.52% [32/2,111] in 2008 (95% CI 1.04%–2.14%; Fig. 2).
Nonmeningitis syndrome oral administration
The third level is made by S. pneumoniae infections (otitis media, sinusitis, mastoiditis, etc.), which were presumably treated with oral antibiotics. The new and old criteria are the same for this group, intermediate 0.12–1 μg/ml and resistant >2 μg/ml.
Ear and nasopharyngeal isolates had significantly higher resistance rates than blood/bronchial isolates when compared at the same minimum inhibitory concentration (MIC) level (≥2 μg/ml). Ear/nasopharynx started at 26.8% in 1996 (95% CI 21.9%–32.1%), climbed to 37.6% in 2000 (95% CI 34.8%–40.5%), declined to 22% in 2003 (95% CI 19.5%–24.7%), and significantly rebounded to 28.9% in 2008 (95% CI 26.2%–31.6%).
Risk factors
Children <5 years old had also significantly higher resistance rates than older children, adults, and those older than 65 using any definition. On the basis of the >2 μg/ml MIC level, children <5 years old had the same pattern as those from ear/nasopharynx isolates with an initial rise from 19.8% in 1996 (95% CI 16.8%–23.1%) to 32.6% is 2000 (95% CI 30.8%–34.6%), followed by a decline to 20.7% in 2003 (95% CI 19%–22.5%) and a rebound to 29.2% in 2008 (95% CI 27.1%–31.4%).
Further insight into these complex temporal changes can be gained by ignoring for a moment the old and new definitions, and using isolates from all sources with penicillin MICs >0.12 μg/ml, and dividing those isolates into groups based on their MIC dilution level.
A multivariate model that considers three periods, one before and two after the introduction of the pneumococcal vaccine, and adjusts for age, location, and census region finds that the group made by isolates with a penicillin MIC between 0.12 and 0.5 μg/ml significantly declined from 21.8% of all isolates (95% CI 20.5%–23.2%) in 1996 to 14.7% (85% CI 14.1%–15.2%) in 2000, rebounding significantly to 21.2% (95% CI 20.8%–21.8%) in 2006 with no further statistically significant changes (Fig. 3).
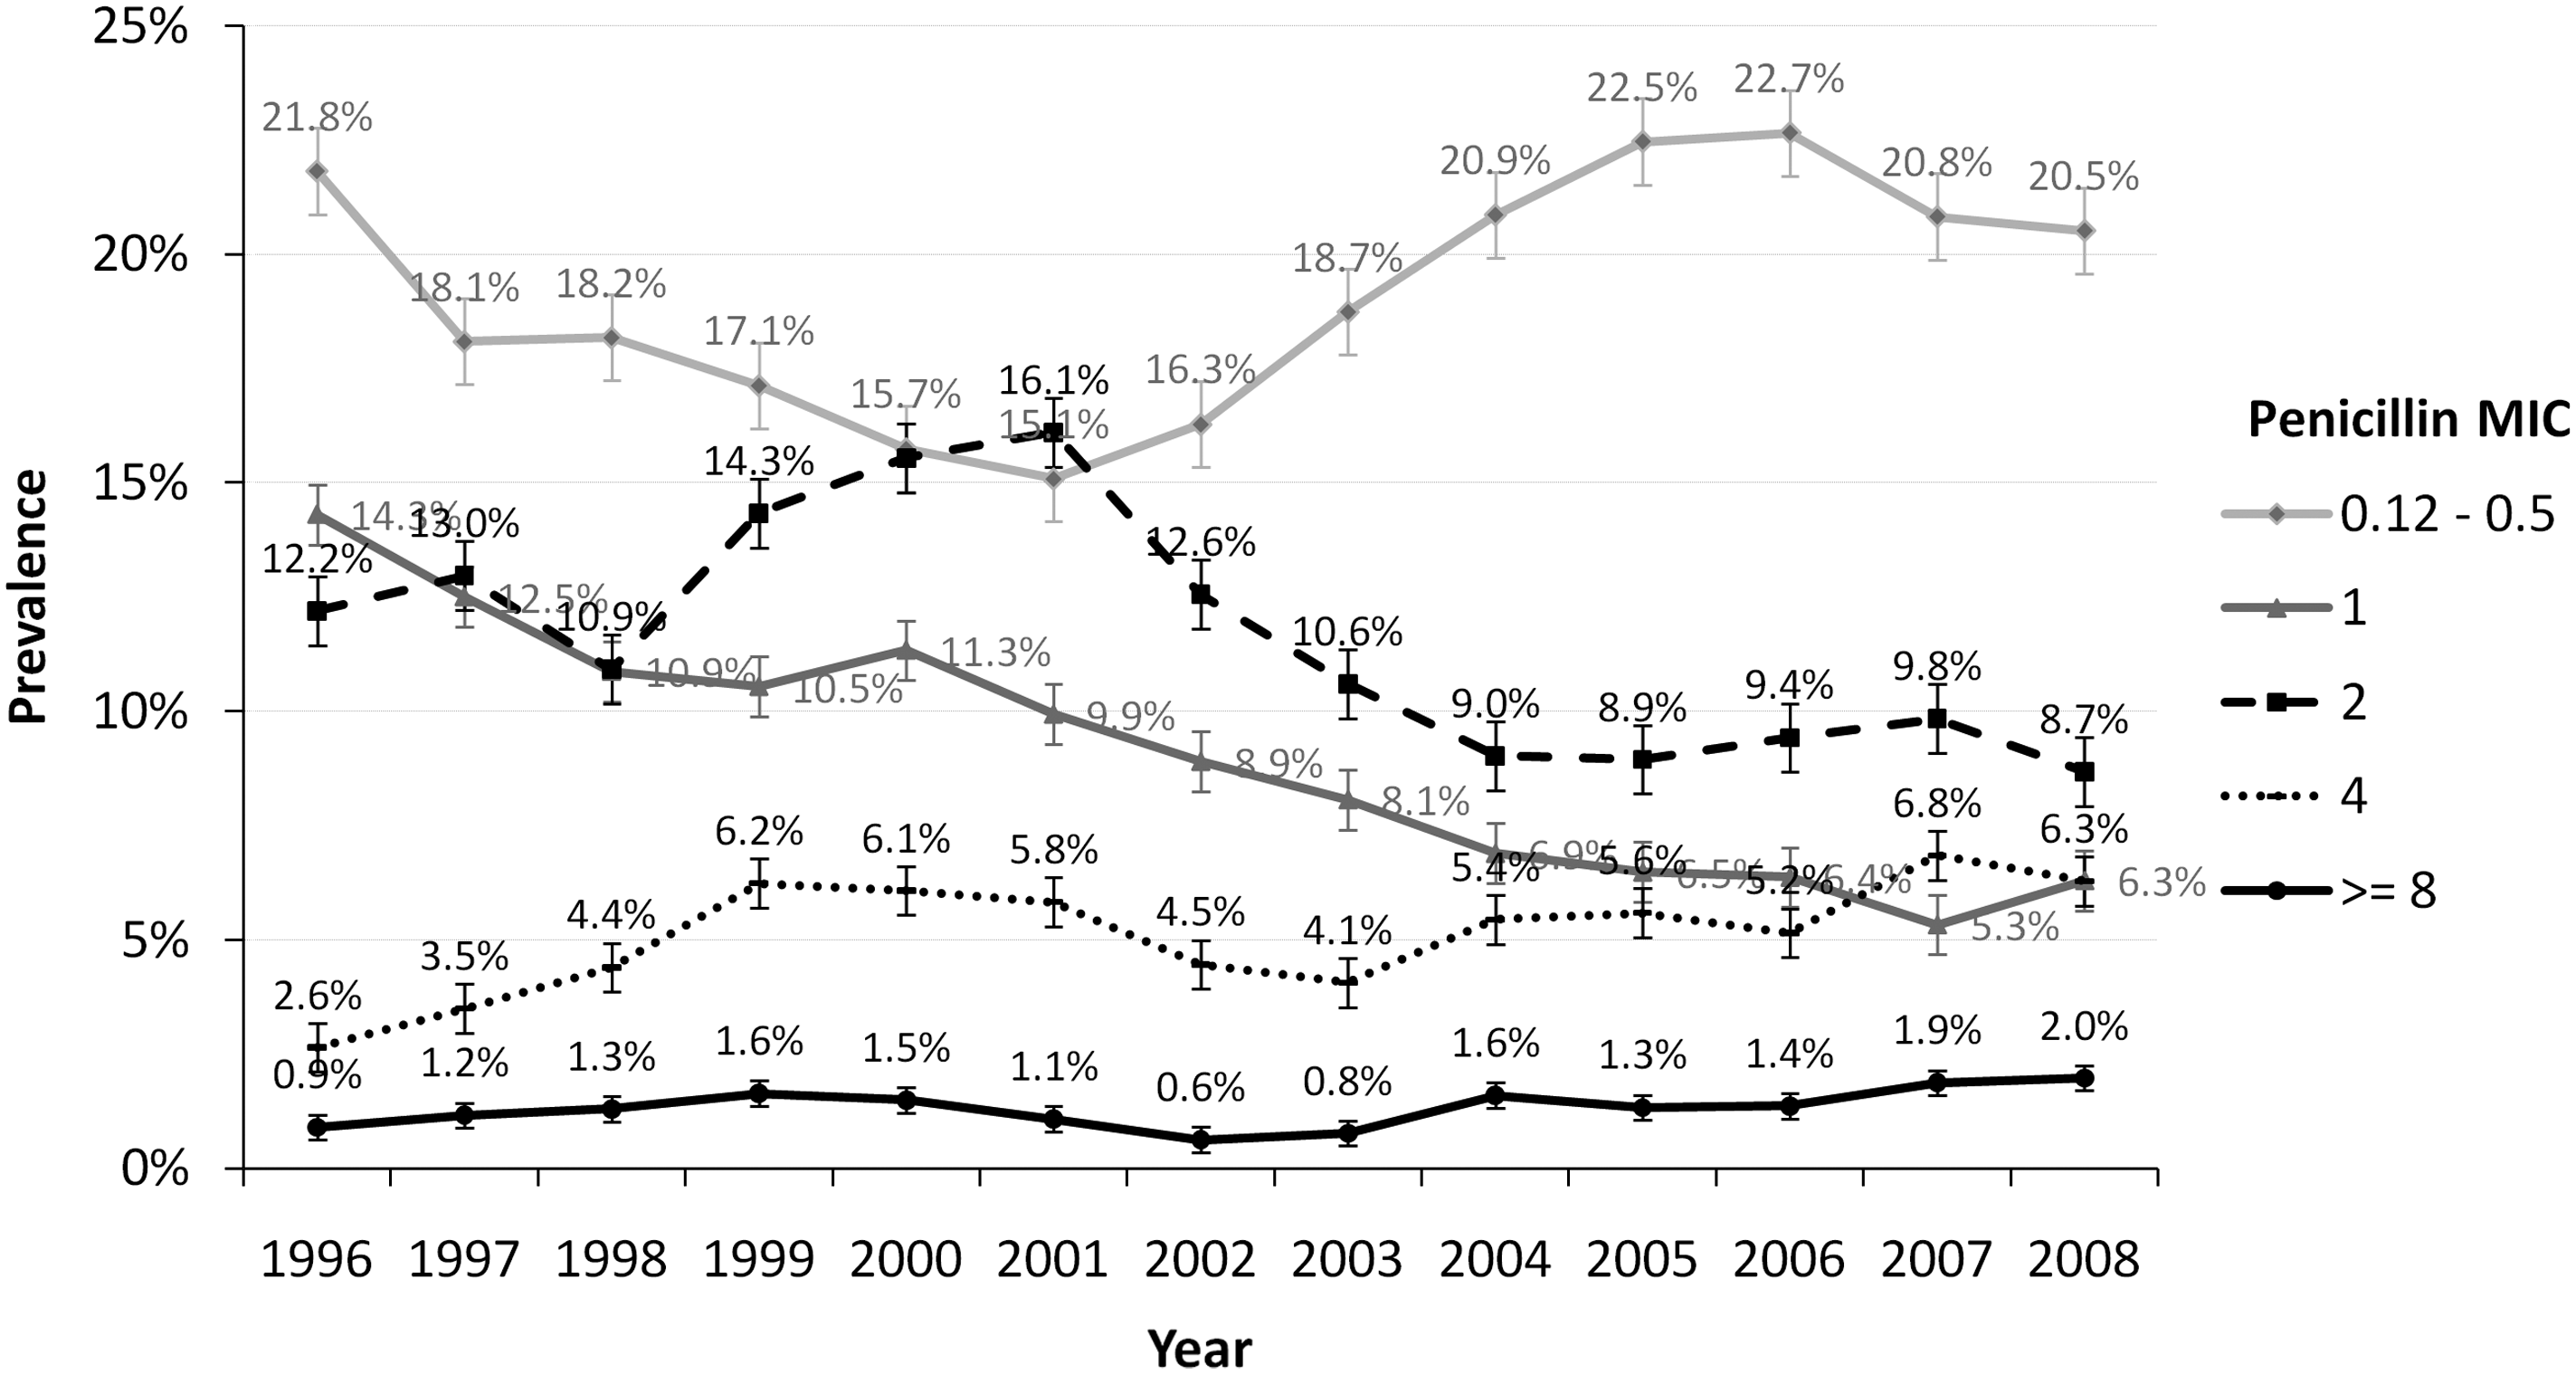
Changes in penicillin minimum inhibitory concentration (MIC) among all isolates.
A similar model for isolates with a penicillin MIC equal to 2 μg/ml found a significant rise from 10.7% (95% CI 9.8%–11.6%) of all isolates in 1996 to 16.2% (95% CI 13.8%–14.6%) in 2000, dropping steeply first and slowly after 2005 to 9.2% (95% CI 8.7%–9.6%) in 2008.
Isolates with a penicillin MIC equal to 4 μg/ml in a similar multivariate model also rose from 3.8% of all isolates in 1996 (95% CI 3.4%–4.2%) to 6.1% in 2000 (95% CI 5.7%–6.5%), declining to 4.6% in 2004 (95% CI 4.3%–4.9%) and rising again to 6.7% in 2008 (95% CI 6.3%–7.1%). All these changes were statistically significant (Fig. 3).
Isolates with a penicillin MIC of 8 μg/dl have no significant changes over time until 2003. There is a small but statistically significant increase from the adjusted rate between 2003 (1.1%, 95% CI 1.0%–1.2%) and 2008 (2.0%, 95% CI 1.8%–2.3%).
Discussion
The main impact of the CLSI penicillin breakpoints modification into a multitiered definition over the temporal trends in the resistance rates is toward a blunting of the epidemiologic changes presumably caused by the introduction of the conjugate pneumococcal vaccine.
S. pneumoniae penicillin breakpoints were established in the late 1970s with the intention to assure the success of therapy for pneumococcal meningitis. 13 As the penicillin MICs increased over time, by the year 2000, only 50.3% were considered susceptible to penicillin, whereas 26.5% and 23.2% were considered intermediate and resistant, respectively. Clinicians therefore replaced penicillin with broader-spectrum antimicrobials for the treatment of pneumonia.
A well-designed prospective study, 9 as well as multicenter studies, 14 nonetheless, established that the breakpoint established for meningitis (≤0.06 μg/ml) was not appropriate for pneumococcal pneumonia. Further, pharmacokinetic data showed that IV infusions of 2 million units of penicillin every 4 hours would support a susceptibility MIC of ≤2 μg/ml for infections other than meningitis. 13 For oral penicillin at a dosage of 250 mg every 8 hours, experimental models supported a susceptibility MIC of ≤0.06 μg/ml. 1
The annual rates of this new multitiered definition when taken together for resistant isolates were about 50%–70% lower than the old simple criteria (≤2 μg/ml), but more importantly the new curve has no rise before the introduction of the conjugate vaccine in 2000, but it showed a significant drop as well as a significant rebound. Interestingly, the yearly ratio of old/new definition climbed from 1.6 in 1996 to 2.3 in 2000 and 2.6 in 2003.
The new criteria seem to obscure some of the epidemiological changes that are clearly seen with the old definition.
Meningitis isolates, being only 1.4% of all isolates studied, had a very limited impact on the overall epidemiologic changes of the new definition, but when considered separately showed a significant drop in resistance after the year 2000, presumably caused by the conjugate vaccine.
The main driver of the epidemiologic differences between the old and new definition is the change among the nonmeningitis syndromes with IV administration (pneumonia/bacteremia). Figure 2 clearly shows the remarkable impact of the conjugate vaccine over blood/bronchial isolates for resistant isolates according to the old definition, with the corresponding increase among penicillin intermediate isolates. These changes can be explained by the loss of vaccine serotypes that were resistant as they declined in prevalence, together with the rise in nonvaccine intermediate isolates.
These changes are barely visible among blood intermediate isolates equal to 4 μg/ml and nearly disappear among resistant blood isolates ≥8 μg/ml with the new definition.
A strikingly more comprehensive view of the epidemiologic changes over time independent of the CLSI definitions can be obtained by considering only MIC levels >0.12 μg/ml and grouping the MIC levels using all isolates (Fig. 3).
Before the introduction of the conjugate vaccine, isolates with MICs of 2, 4, and 8 were rising, whereas isolates of MICs 1 or below were dropping, presumably in a period of continued acquisition of resistance. After the introduction of the vaccine, isolates with MICs of 1, 2, 4, and 8 decrease in prevalence, whereas those between 0.12 and 0.5 increase in prevalence, signaling the impact of the vaccine over resistant vaccine serotypes. 7
The last period is between 2006 and 2008 when the isolates with MICs of 4 and 8 start rising again while the rest stabilize, which may imply the end of the vaccine effect (resistant serotype replacement) and the rebound in resistance rates.
A limitation of this study is that isolates came from passive surveillance that is not population based. The isolates from different census regions may not be completely representative or the location as they are subject to selection bias. Most isolates represent subjects with a variety of infections. Vaccine status of the subject or other characteristics like prior therapy were not known.
The notable epidemiologic changes in S. pneumoniae penicillin resistance observed in the 12-year period between 1996 and 2008 are slightly masked by the new multitiered breakpoints introduced by CLSI in 2008. This can be explained by the exclusion of isolates with penicillin MIC of 2 μg/ml among blood and bronchial isolates. The recent rebound in penicillin resistance nonetheless can be clearly seen among isolates that have MICs of 4 and 8 μg/ml.
Footnotes
Acknowlegment
This work was financially supported by GlaxoSmithKline.