
Abstract
Determining herd- or flock-specific antimicrobial resistance profiles is important to guide therapeutic use of antimicrobials and to assess risk factors for the development and spread of antimicrobial resistance. As such, it is of utmost importance to optimize the sampling strategy for the determination of herd-specific antimicrobial resistance profiles. However, the multitude of prevalences measured at the same time as well as the presence of variation both at the level of the animal and the bacterial population of concern make it impossible to use conventional sample size determination methods. In this article, the use of bootstrapping techniques for sample size determination was explored. In particular, one-stage and two-stage bootstrap samplings were used to determine the optimal number of animals and the optimal number of isolates within one animal. Results show that focus should be on the number of animals sampled rather than on the number of isolates tested within one animal.
Introduction
Most internationally recognized monitoring programs, like the Danish Integrated Antimicrobial Resistance Monitoring and Research Program (DANMAP), aim at providing representative resistance profiles at a national level. 1 Therefore, they make use of a single sampled animal per herd or flock to obtain maximum diversity in the sample. 2 For broilers, this exists of one cloacal swab from one animal per flock. This sampling methodology assumes that the total number of samples from all flocks gives a representative image for the whole population. 3 However, no conclusions on flock-level antimicrobial resistance can be drawn based on these sampling schemes. 1
Herd- or flock-level resistance profiles are important to guide therapeutic use of antimicrobials and to investigate risk factors for the development and spread of antimicrobial resistance. Given the large within-herd variation in antimicrobial resistance patterns,4,21,24 a single sample per herd is not sufficient to accurately describe herd-specific antimicrobial resistance profiles. Unfortunately, no outlined sampling strategy exists for the determination of herd-level resistance profiles. 6 As a consequence, optimal sample size determination is often neglected in these situations, which hampers the accurate determination of a resistance profile.
An additional difficulty in antimicrobial resistance profile determination is the within-animal bacterial variation. Is one bacterial isolate sufficient and representative for the animal, or do we need to test more than one, thus a cluster of isolates, per animal? For antimicrobial resistance profile determination in E. coli from broiler chickens, to our knowledge, this issue has not yet been investigated. Given the huge differences in species-specific factors that might play a role in the way resistance is established and spreads in an ecosystem (e.g., age, housing, management, production cycle, medication, and feeding), extrapolation of conclusions made in other animal species is not advisable.
The sample size required in a given study depends on the sampling purpose, population size, the expected prevalence of antimicrobial resistance, and the required power of the study. 6 Epidemiological methodology is readily available to determine the optimal sample size for the estimation of one specific prevalence, given a certain expected prevalence and desired level of precision. 8 Yet, in the case of determining the (flock specific) antimicrobial resistance profile, there is not one single expected prevalence but several expected prevalences, one for each of the antimicrobials tested. To determine the sample size taking into account the multiple prevalences as well as the presence of clustering, no general methodology is available. The objective of this study was to find a methodology to estimate the optimal number animals (N) and the optimal number of bacterial isolates per animal (N) needed to determine a flock-specific antimicrobial resistance profile for E. coli in broiler chickens. To this end, the use of bootstrapping was explored.
Materials and Methods
Farms and animals
Five Belgian broiler farms were randomly selected from the Belgian identification and registration system for livestock.
27
The only selection criterion was that the flock needed to consist of more than 10,000 animals to be representative for the average Belgian broiler farm size. The farms were visited once between January and February 2007, at a time where animals were in their fifth week of age. On each farm, ∼100 animals from the same flock were sampled. The actual sampling was done by making a diagonal path throughout the stable and gradually picking up the required number of chickens. Initial sample size was determined based on an expected prevalence of resistance of 50% and an accepted error of 10% and 95% level of confidence giving a required sample size of 97 samples per flock following
where N is number of animals to be sampled, Zα is the (1−α/2) percentile of a standard normal distribution to obtain (1−α) 100% confidence level, p is the a-priori estimate of the prevalence, and L is the required precision of the estimate. 8
Sampling and bacteriological analysis
Sampling
One cloacal swab was taken from each animal to be sampled. A brief sampling overview is presented in Table 1. On one farm (farm E), multiple isolates per animal were tested.
E. coli isolation
Cloacal swabs were streaked out onto MacConkey agar plates (Oxoid) and incubated at 37°C for 24 hr. From the plates of the first flock, five lactose-positive colonies were randomly picked per sample and plated on a new MacConkey agar plate. These samples were used to determine the number of colonies per sample that need to be picked for antimicrobial susceptibility testing. From the four remaining flocks each time only one lactose positive colony was randomly picked and plated on a new MacConkey agar plate and again incubated for 24 hr at 37°C. E. coli was identified using an earlier described method. 5
Antimicrobial susceptibility testing
After identification, antimicrobial susceptibility testing was performed as described elsewhere, 23 using the Kirby Bauer disk diffusion method. A reference strain (E. coli ATCC 25922) was taken along with each batch of susceptibility tests as internal quality control. For interpretation of the results, the CLSI veterinary table from the manufacturer's guide (Guidelines for the use of Neosensitabs, 18th edition, 2005/2006, www.rosco.dk) was followed. The list of agents tested is included in Table 2.
For farm E, only data on the first collected isolate were used.
Data analysis
Results were entered into a Microsoft Excel spreadsheet. Zone diameters were converted to their respective susceptibilities (Susceptible S; intermediately susceptible I; Resistant R). For all statistical analysis, intermediate resistances were considered resistant resulting in dichotomous data: susceptible versus resistant. All analyses were performed using Matlab® software.
One-stage bootstrap sampling
The standard bootstrap procedure of resampling uniformly and with replacement observations from the observed data 10 was used to investigate the effect of the number of sampled animals N on the precision of the estimated herd-specific antimicrobial resistance profile. To this end, data on all five farms were used. For farm E, only data on the first collected isolate was used.
To explain the one-stage bootstrap, let
This process is repeated many times (B=2,000), each time generating a new bootstrap sample
To investigate the effect of the number of sampled animals N on the precision of the estimated herd-specific antimicrobial resistance profile, percentile bootstrap confidence intervals are calculated for varying sample sizes n. In particular, confidence intervals [LL(n);UL(n)] are calculated for each of the 14 antimicrobial agents using B=2,000 bootstrap samples Ab*(n) of varying sample sizes n=5,10,15,…90. Hence, given a specific sample size n, 14 confidence intervals are calculated, 1 for every antimicrobial agent. These confidence intervals are not only calculated for farm A, but also for farms B, D, C, and E (using data on first collected isolate only). As such, given a specific sample size n, a total of 70 confidence intervals (14 antimicrobial agents ×5 farms) was obtained. To summarize and jointly describe the effect of the sample size n on these 70 confidence intervals, the proportion of resistance prevalences estimated with sufficient precision, that is, of which the width of the (1−α)100% confidence intervals is smaller than a predefined width, was determined. In particular, this proportion was determined for the 95% percentile bootstrap confidence intervals using predefined widths of 0.1, 0.2, and 0.3.
Two-stage bootstrap sampling
An extension of the standard bootstrap procedure is the two-stage bootstrap procedure, involving resampling populations and then resampling observations within populations. 25 The latter procedure was employed to jointly investigate the effect of the number of animals sampled (N) and of the number of isolates sampled per animal (M) on the precision of the estimated herd-specific antimicrobial resistance profile. The data from farm E were used, containing test results for five isolates per animal.
To explain the two-stage bootstrap, let us first introduce the data from farm E. Let
Again, this process is repeated many times (B=2,000), each time generating a new bootstrap sample
To investigate the joint effect of the number of sampled animals (N) and of the number of isolater per animal (M) on the precision of the estimated herd-specific antimicrobial resistance profile, percentile bootstrap confidence intervals are calculated for varying sample sizes n and m. In particular, confidence intervals [LL(n,m);UL(n,m)] are calculated for each of the 14 antimicrobial agents using B=2,000 bootstrap samples Eb*(n,m) of orthogonally varied sample sizes n and m with n=5,10,15,…90 and m=1,2,…5.
Results
The overall estimated prevalences for the 14 different antimicrobials are given in the second leftmost column of Table 2. Highly variable resistance prevalences were observed, ranging from 0.7% for florfenicol to little over 78% for ampicillin.
Figure 1 presents the flock-specific antimicrobial resistance profiles. For several antimicrobials a high between-flock variation can be observed.

Herd-specific antimicrobial resistance profiles for flock A to E. flo, florfenicol; gen, gentamicin; apr, apramycin; amc, amoxicillin/clavulanic acid; enr, enrofloxacin; chl, chloramphenicol; neo, neomycin; flu, flumequine; cef, ceftiofur; tms, trimethoprim/sulfamethoxazole; str, streptomycin; tet, tetracycline; amp, ampicillin; nal, nalidixic acid.
The results of the one-stage bootstrap procedure regarding the number of sampled animals N on the precision of the flock-specific resistance prevalences are summarized in Fig. 2. This figure shows the proportion of flock-specific prevalences that are estimated with sufficient precision, that is, having a 95% CI width of maximal 0.3, 0.2 and 0.1, for a given sample size. For example, when using a sample size of 30, 72.86% of the flock-specific prevalences that are estimated have a 95% CI smaller than or equal to 0.3. 47.14% have a 95% CI smaller than or equal to 0.2, and 18.57% have a 95% CI smaller or equal to 0.1. These examples are indicated by the dash lines in Fig. 2. Table 2 provides an overview of the changes in 95% CI widths for the different prevalences with reduced sample sizes.
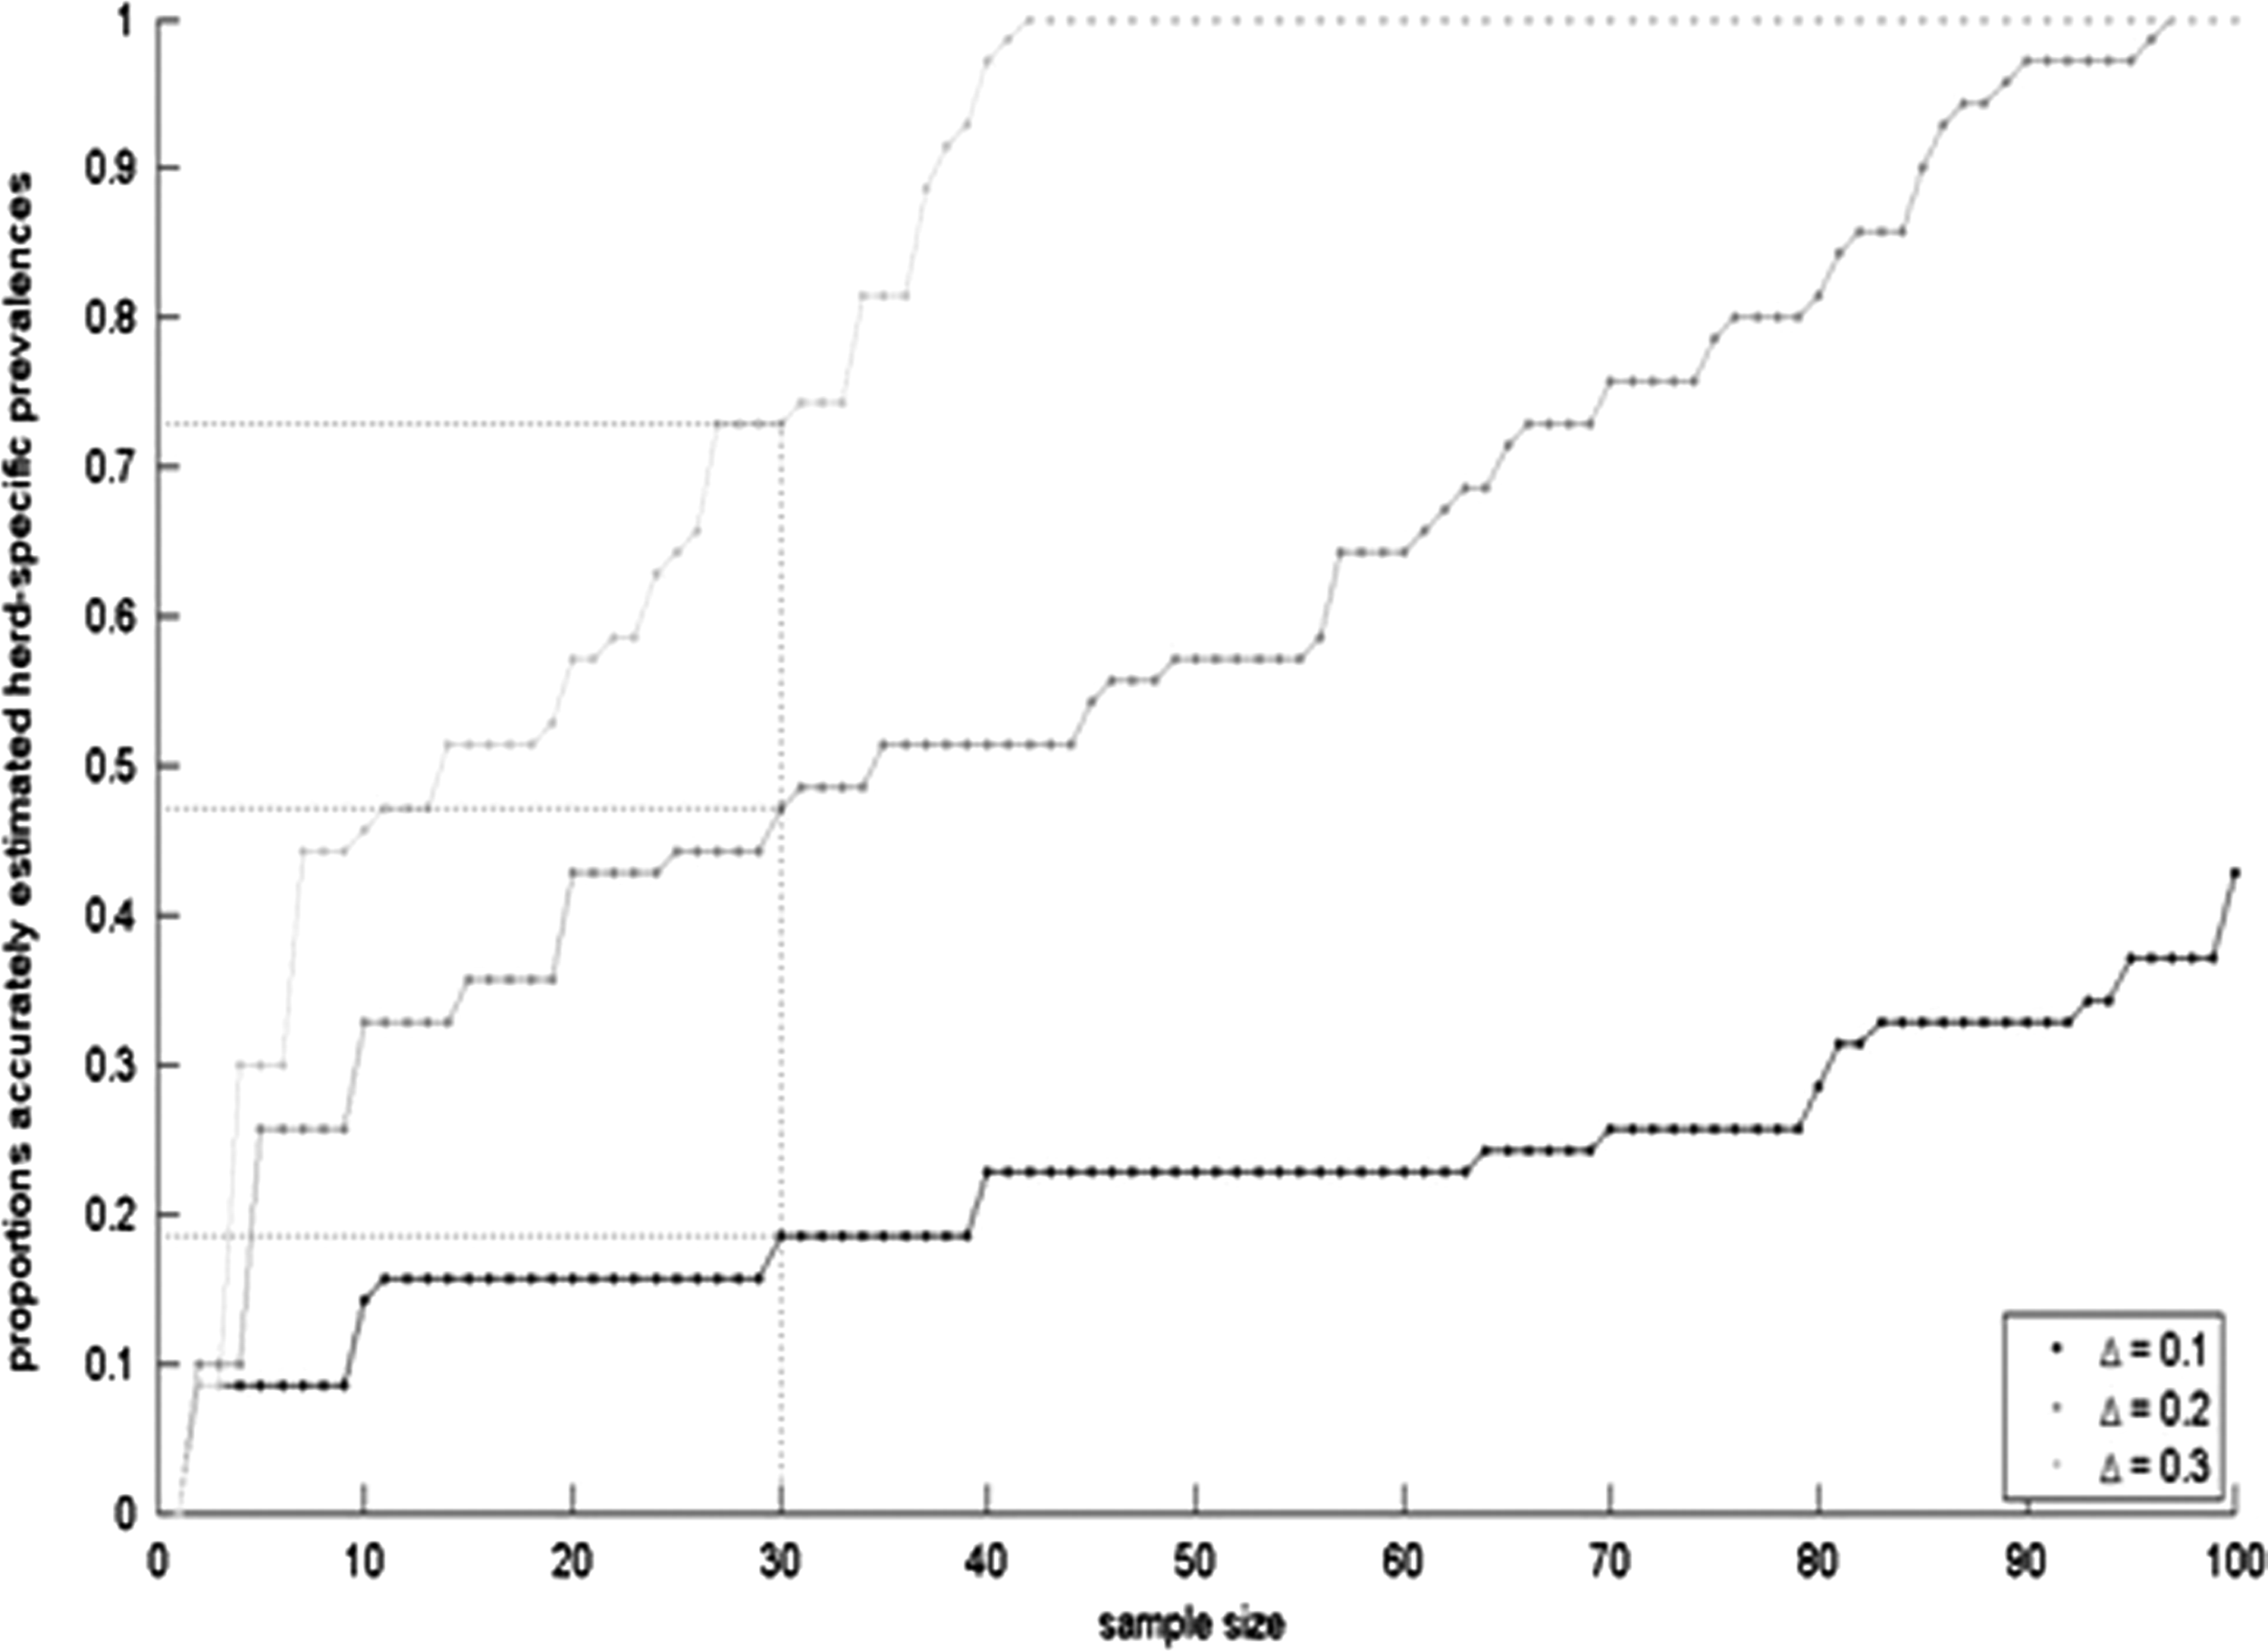
Fraction of herd-specific prevalences estimated with sufficient precision, being prevalences of which the 95% CI width (Δ) is smaller than 0.1, 0.2, and 0.3.
So far, for reasons of simplicity, we only discussed the results of the one-stage bootstrap samplings, investigating the effect of varying the number of sampled animals (N) on the precision of the (flock specific) resistance prevalences. However, also the number of isolates sampled per animal might affect the precision of the prevalences. This was investigated by means of the two-stage bootstrap procedure using the data on farm E, of which the results are graphically summarized in Figs. 3 and 4. Figure 3 contains the prevalence estimates of the 14 antimicrobials, ordered with increasing prevalences from left to right. Clearly, high prevalences were found for trimethoprim/sulfamethoxazole, streptomycin, tetracycline, ampicillin, and nalidixic acid, whereas others had rather low resistance prevalences. These prevalences as well as the corresponding 95% bootstrap CIs are calculated for the number of isolates ranging from 1 to 5 with the number of animals fixed to the original sample size (i.e., N=90). As can be seen, the confidence intervals do not vary much when the number of isolates per animal is altered. Figure 4 presents the combined effect of varying the number of animals sampled (N=30, 50, 75 and 90) and varying the number of isolates tested per animal (M=1,2,…,5). In this figure, several 95% CIs are given per prevalence estimate, each CI corresponding to a different number of animals sampled. If the number of animals sampled is decreased, the CIs become wider. This is in line with the previous findings based on the one-stage bootstrap sampling. On the contrary, irrespective of the number of animals sampled, the number of isolates sampled per animal does not affect the precision of the prevalences.
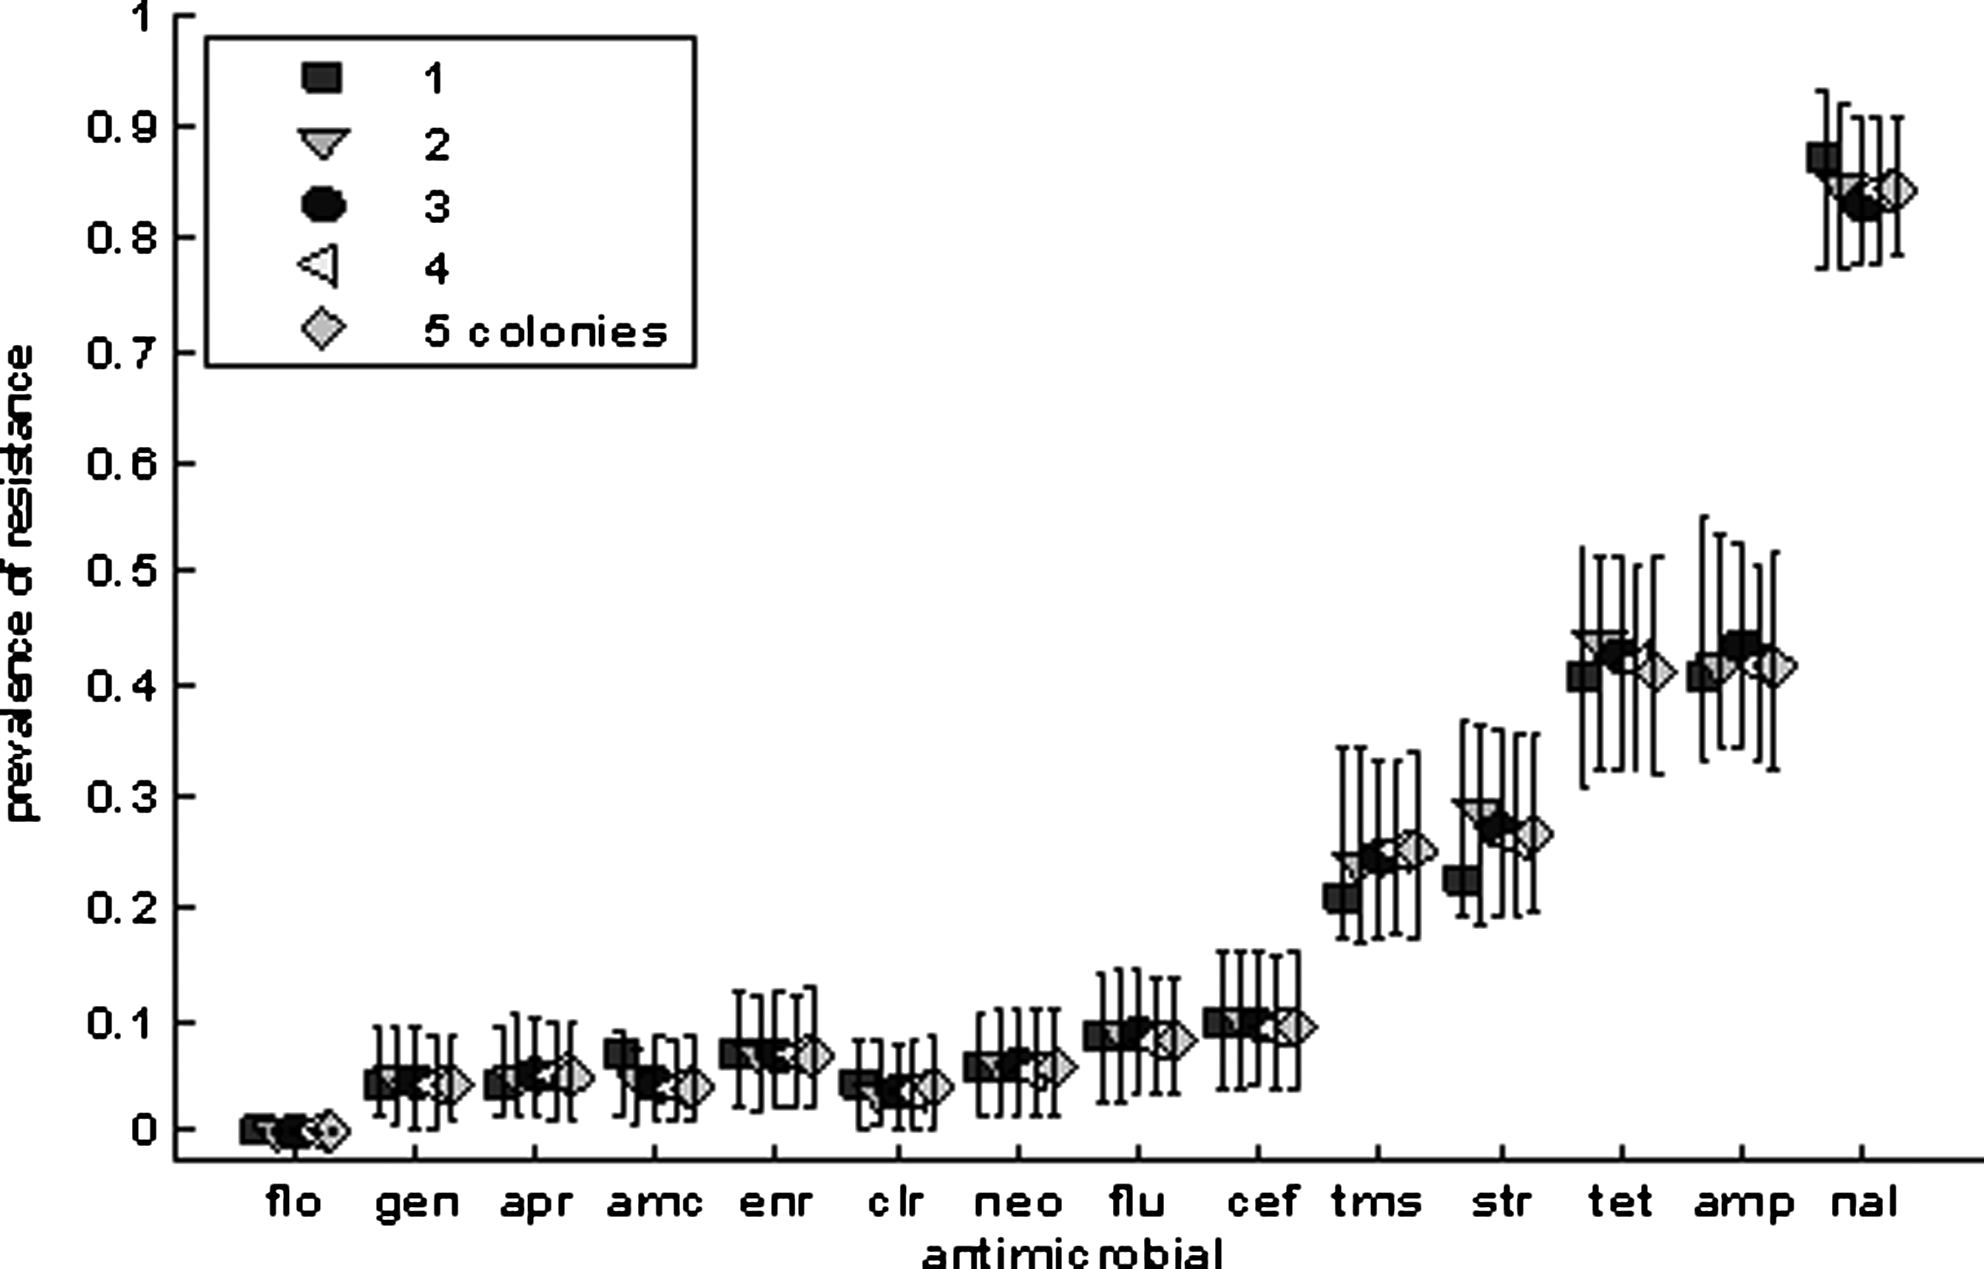
Effect of varying the numbers of isolates per animal (1–5) with the number of animals fixed to the original sample size (n=90). flo, florfenicol; gen, gentamicin; apr, apramycin; amc, amoxicillin/clavulanic acid; enr, enrofloxacin; chl, chloramphenicol; neo, neomycin; flu, flumequine; cef, ceftiofur; tms, trimethoprim/sulfamethoxazole; str, streptomycin; tet, tetracycline; amp, ampicillin; nal, nalidixic acid.

Combined effect of varying the number of isolates tested for different sample sizes (n=90, 75, 50 and 30). Error bars from small to large represent the confidence intervals for the respective sample sizes of 90, 75, 50, and 30. flo, florfenicol; gen, gentamicin; apr, apramycin; amc, amoxicillin/clavulanic acid; enr, enrofloxacin; chl, chloramphenicol; neo, neomycin; flu, flumequine; cef, ceftiofur; tms, trimethoprim/sulfamethoxazole; str, streptomycin; tet, tetracycline; amp, ampicillin; nal, nalidixic acid.
Discussion
Although a good sampling strategy is of great importance to assess the uncertainty of prevalence or incidence estimations in measuring health- or community-associated factors,13,22 only very few studies on sampling design and sampling strategies for herd- or flock-level antimicrobial resistance determination have been published. To our knowledge, this study is one of a kind in exploring and analyzing sample size for multilevel multi-prevalence flock-level antimicrobial resistance profile determination in broiler chickens.
We started from the classical epidemiological theory for sample size calculation 8 to obtain a reliable sample size for antimicrobial resistance determination. This sample size, assuming an overall expected prevalence of antimicrobial resistance of 50%, exceeds the required sample size for a large number of compounds tested, namely, for the ones with very low or very high resistance prevalence, and thus in the end results in oversampling. Moreover, such a large sample size inevitably goes together with the requirement of a large budget, mostly not available for research, monitoring or risk evaluation purposes. Due to this lack of budget, sample size is often (to be) reduced or is chosen arbitrarily, without critically evaluating the consequences that smaller sample survey will have on the reliability and precision of the outcome.
To evaluate this problem, a different approach, based on the bootstrapping technique was applied in this study. The bootstrap is a data based simulation method involving repeatedly resampling random samples from the original data with replacement. 10 Bootstrappings has been widely used because it does not require distributional assumptions and it allows obtaining results when analytical approaches are not possible. In animal science or veterinary medicine, resampling techniques have been used repeatedly for variance compound estimation,11,12,,16,17,18 to assess the genetic diversity in a horse population 14 and for herd-level measurement of E. coli antimicrobial resistance in finisher pigs. 9
Bootstrap sampling was preferred to classical sample size determination methods because it does not require prior assumptions on the true prevalence or variance. Further, for complex sampling designs (e.g., involving multiple outcomes and clustering), the analytical solution of the optimal sample size is hard to derive and would require a-priori estimates of parameters (e.g., correlation between outcomes or within clusters), which are difficult or even impossible to obtain.
Results of the current study clearly show that no important gain in precision is obtained when more than one E. coli colony per bird is tested (Fig. 3). Even when combined with a smaller subset of sampled animals (Fig. 4), no substantial increase in width of the confidence interval is observed. This indicates that the within-animal variation of E. coli antimicrobial resistance is low inclining that it is not worth the effort and cost of testing multiple isolates from the same bird. This issue has already been investigated for E. coli isolates in dairy cows and calves, but the obtained results are conflicting. Davison et al. 6 recommend to examine more than one E. coli isolate per sampled animal to obtain an accurate prevalence estimate of antimicrobial resistance in dairy cows, whereas Morley et al. 20 stated that examining a single isolate per sample gives a similar result to examining 5 or even 10 isolates for antimicrobial susceptibility testing in E. coli from calves.
This finding stands well in contrast to the between-animal variation. Table 2 clearly shows the large changes in confidence interval width as the number of animals sampled per flock is reduced, giving proof of a large between-animal variation and the substantial impact of animal sample size on the outcome's variance. Whether this variation is a consequence of the diversity in commensal E. coli strains within a flock7,28 in contrast to the much smaller diversity of E. coli commensal strains within animals 26 is a possibility, yet this was not further looked into at this stage. Similar results were found in a study on antimicrobial resistance for finisher pigs in the United Kingdom, where it was found that the between-animal and within-pen variance was of great importance, even in a very constant environment. 9
From now on, in resistance profiling E. coli from broilers at flock level, the animal can be listed as primary sampling unit rather than the bacterium.
How can we now evaluate the impact of sample size on an overall flock-level antimicrobial resistance profile? To answer this question the proportion of all determined prevalences that could be estimated within a certain 95% CI width was calculated for a given sample size (Fig. 4). Not surprisingly, 100% precision for the whole profile corresponds to the maximal sample size, the one that can be calculated using the conventional sample size formulae and assuming an expected prevalence of 50%. As already mentioned, these sample sizes are hardly realistic in daily research, so they are often limited without having a clear view of the impact on precision of the estimates. Using the proposed method it becomes possible to predict which fraction of the estimated prevalences can be estimated within a certain confidence interval width, and thus with a certain precision, adding value to obtained study results on multiple antimicrobial resistance prevalence estimation. If, for example, a sample size of 30 birds is chosen, according to Fig. 4, 73% of the prevalences will be estimated with a 95% CI width of 0.3 or less, thus allowing a reasonably accurate estimation of the resistance profile of that flock, and a good compromise between what would be ideal and what is achievable.
Conclusion
Using the proposed bootstrapping method to determine the effect of sample size on the proportion of prevalences that are estimated within a certain confidence interval allows to evaluate the precision of an antimicrobial resistance profile determination in a reliable and informed manner.
Footnotes
Acknowledgment
This work was supported by a grant from the Federal Public Service of Health, Food Chain Safety and Environment (grant number RT-06/3-ABRISK).
Disclosure Statement
No competing financial interests exist.