
Abstract
The alarming rise of ciprofloxacin-resistant Pseudomonas aeruginosa has been reported in several clinical studies. Though the mutation of resistance genes and their role in drug resistance has been researched, the process by which the bacterium acquires high-level resistance is still not well understood. How does the genomic evolution of P. aeruginosa affect resistance development? Could the exposure of antibiotics to the bacteria enrich genomic variants that lead to the development of resistance, and if so, how are these variants distributed through the genome? To answer these questions, we performed 454 pyrosequencing and a whole genome analysis both before and after exposure to ciprofloxacin. The comparative sequence data revealed 93 unique resistance strain variation sites, which included a mutation in the DNA gyrase subunit A gene. We generated variation-distribution maps comparing the wild and resistant types, and isolated 19 candidates from three discrete resistance-associated high variability regions that had available transposon mutants, to perform a ciprofloxacin exposure assay. Of these region candidates with transposon disruptions, 79% (15/19) showed a reduction in the ability to gain high-level resistance, suggesting that genes within these high variability regions might enrich for certain functions associated with resistance development.
Introduction
Studies on ciprofloxacin resistance to date have focused on the mutation of DNA gyrase/topoisomerase IV1,11,22,29 and the efflux pump regulatory genes mexR and nfxB. 16 However, the series of steps and molecular mechanisms that make antibiotic-susceptible bacteria become antibiotic-resistant still remain a mystery. Recently, Breidenstein et al. screened for mutants that exhibited an altered susceptibility using the PA14 comprehensive mutant library to reveal the extent of the ciprofloxacin “resistome” in PA. 6 However, a survey result based on individual mutants alone may not show the complete picture of PA's complex responses when it is exposed to ciprofloxacin. In a previous study, we found that when PA was continuously exposed to ciprofloxacin during its stationary growth phase (i.e., up to 48 hr), PA acquired the drug resistance in a multistage process. 26 Our data indicated that resistance development in PA is not the result of a preexisting resistance in the population, nor is it developed in a single gene mutation event. Instead, the data suggested that preexisting cellular pathways, protein modification regulation, and single nucleotide gene mutations each support the resistance development process, such that high-level resistance in PA is a stepwise, ratcheting up process. 26
Though microarray analyses of changes in gene expression 5 and changes in protein profiles 2 have been performed, the possible link between genomic variation in PA and resistance development has not been evaluated, especially after PA has been exposed to an antibiotic. If evidence suggests that high-level ciprofloxacin resistance is not preexisting but rather the result of a series of adaptive steps that produce variants, we hypothesized that those adaptive variants may provide a fitness advantage for the newly developed resistant strain. Here we examined the genome of the susceptible wild type strain and its derivative resistant strain using high throughput sequencing technology (454/Roche Applied Science). High throughput next-generation sequencing technology provides an opportunity to examine these postexposure genomic variations, which can enhance our knowledge of the evolutionary driving forces in PA's resistance development. In this report, we aim to explore the potential evolutionary variants and their distribution throughout the PA genome, after the bacteria has been exposed to antibiotics.
Materials and Methods
Materials and equipment
We used Luria agar base Miller (LA) medium (TEKnova, Inc.) and Luria broth base Miller (LB; Acros Organics) from Fisher Scientific. Ciprofloxacin, 3-[(3-cholamidopropyl)-dimethylammo- nio]-1-propanesulfonate, iodoacetamide, and dithiothreitol were procured from Sigma-Aldrich. We used the QIAGEN Genomic-tip 20/G & Genomic DNA Buffer set (QIAGEN), and Qubit® Fluorometer and Quant-iT™ dsDNA High-Sensitivity Assay Kit (Invitrogen). Genome sequencing was carried out with a 454 Life Sciences Genome Sequencer FLX instrument (Roche Applied Science) located in the UNC High Throughput Sequencing Facility.
Bacterial strains, media, culture conditions, and minimal inhibitory concentration assays
P. aeruginosa PAO1 was obtained from the University of Washington (UW) Genome Center, and UW's transposon mutant library was the source of all PA mutants used in this study. 15 All liquid cultures were grown at 35°C with aeration in a 500-ml Erlenmeyer flask with 50 ml of LB medium and supplemented with ciprofloxacin where indicated; the culture on LA medium with ciprofloxacin was grown for 48 hr at 35°C and then colony-forming units were counted. The cell culture inoculation and ciprofloxacin exposure were performed following our previously established methods. 26 Minimal inhibitory concentrations (MICs) were determined by Etest (AB bioMérieux, AB Biodisk), using the prescribed protocol. The ciprofloxacin-resistant P. aeruginosa PAO1-CipR (in our previous paper 26 we named it PAO1-6) was a derivative strain of the susceptible wild type PAO1 after 48 hr of exposure.
DNA extraction and purification
The origins of the PA strains from which the genome was sequenced are presented in Table 1. Stocks for these strains were stored at −80°C in LB broth with 15% glycerol. Freezer stocks were streaked on LA agar, and single colonies were picked to inoculate in 3 ml LB. These cultures were grown for 18 hr at 35°C with shaking at 150 rpm. DNA was extracted from 1 ml culture (around 4×10⁹ cells) using QIAGEN Genomic-tip 20/G & Genomic DNA Buffer set according to the manufacturer's instructions. DNA was eluted with 100 μl buffer EB (Qiagen) and stored at −20°C.
454 pyrosequencing and sequence analysis
Purified genomic DNA was quantified using a Quant-iT™ dsDNA High-Sensitivity Assay Kit (Invitrogen). Pyrosequencing was carried out using a 454 Life Sciences Genome Sequencer FLX instrument (Roche Applied Science).
A library of single-stranded template DNA fragments was prepared from the purified genomic DNA using the GS FLX Standard DNA Library Preparation Kit. The GS FLX Standard emPCR Kit I (Shotgun) was used for emulsion-based clonal amplification of a single-stranded template DNA library. The GS FLX Standard LR70 Sequencing Kit was used in combination with the GS FLX Standard PicoTiterPlate Kit to determine the nucleotide sequence of the immobilized and clonally amplified DNA library. All kits (Roche Applied Science) were used according to the manufacturer's instructions. We used the P. aeruginosa PAO1 complete genome (accession number NC_002516.2; GI 110645304) as a reference to assemble the genome and used GS Reference Mapper (454 runAssembly software, Version 2.3) to map and identify variants.
The DNA sequence annotation was visualized by Artemis (www.sanger.ac.uk/resources/software/artemis), and the Artemis Comparison Tool (ACT) (www.sanger.ac.uk/resources/software/act) was used as the DNA sequence comparison viewer. The genome sequence comparison information was analyzed and results were visualized using the GView Server (http://server.gview.ca/gview-server/). JMP 9.0 (www.jmp.com/software/jmp9) was used for statistical analysis and for visualizing the genomic variation distribution.
Bacterial strain selection for sequencing
Starting with our collected PAO1 strain, after 48 hr of continuous ciprofloxacin exposure at 4×the starting MIC of 0.5 μg/ml, we collected all surviving cells and transferred them into the fresh medium without adding further antibiotics. By further MIC screening, we isolated a ciprofloxacin-resistant PAO1-CipR strain, whose ciprofloxacin resistance increased almost 50-fold to an MIC of 24 μg/ml—a clinically significant level. We then used this resistant strain in our study to evaluate the relationship between genomic variation and resistance development.
Overview of genome sequencing data for PAO1-CipR
To better understand the genetic basis of the increasing ciprofloxacin resistance in PAO1-CipR, the whole genomes of PAO1-CipR and its original wild type PAO1 were sequenced (Table 1). The reference genome of PAO1 (NC_002516.2) has a circular chromosome consisting of 6,264,404 bp with an average G+C content of 66%. The draft genome sequences for resistant PAO1-CipR and wild type PAO1 were obtained using 454 pyrosequencing with shotgun libraries.
Selecting candidates for ciprofloxacin resistance assay
In this study, we applied low stringency criteria to uncover a greater number of potential variants for further study. For a variant to be selected for this study, it must have had a minimum of: (1) two reads and (2) a 10% variation frequency. We performed a statistical analysis of the genomic variation distribution between the wild type and the resistant type using JMP 9.0 software, to find the regions that were altered in the resistant strain. Using the “distribution” function in JMP, we designated the genomic variation sites as the “x column” input, and the frequency variation of each variant as the “weight” input. We then set a 200,000 bp sequence window as the increment for visualizing the variation distribution through the whole genome. A smooth curve (a nonparametric density curve by kernel regression) was also generated for each distribution map (Fig. 1A). Variants with variation frequencies over 80% were selected, and their associated regions, having a continuous variation probability over 3% (i.e., the average sum of variation frequencies within a fixed 200,000 bp sequence window), were defined as the high variability regions in this study.
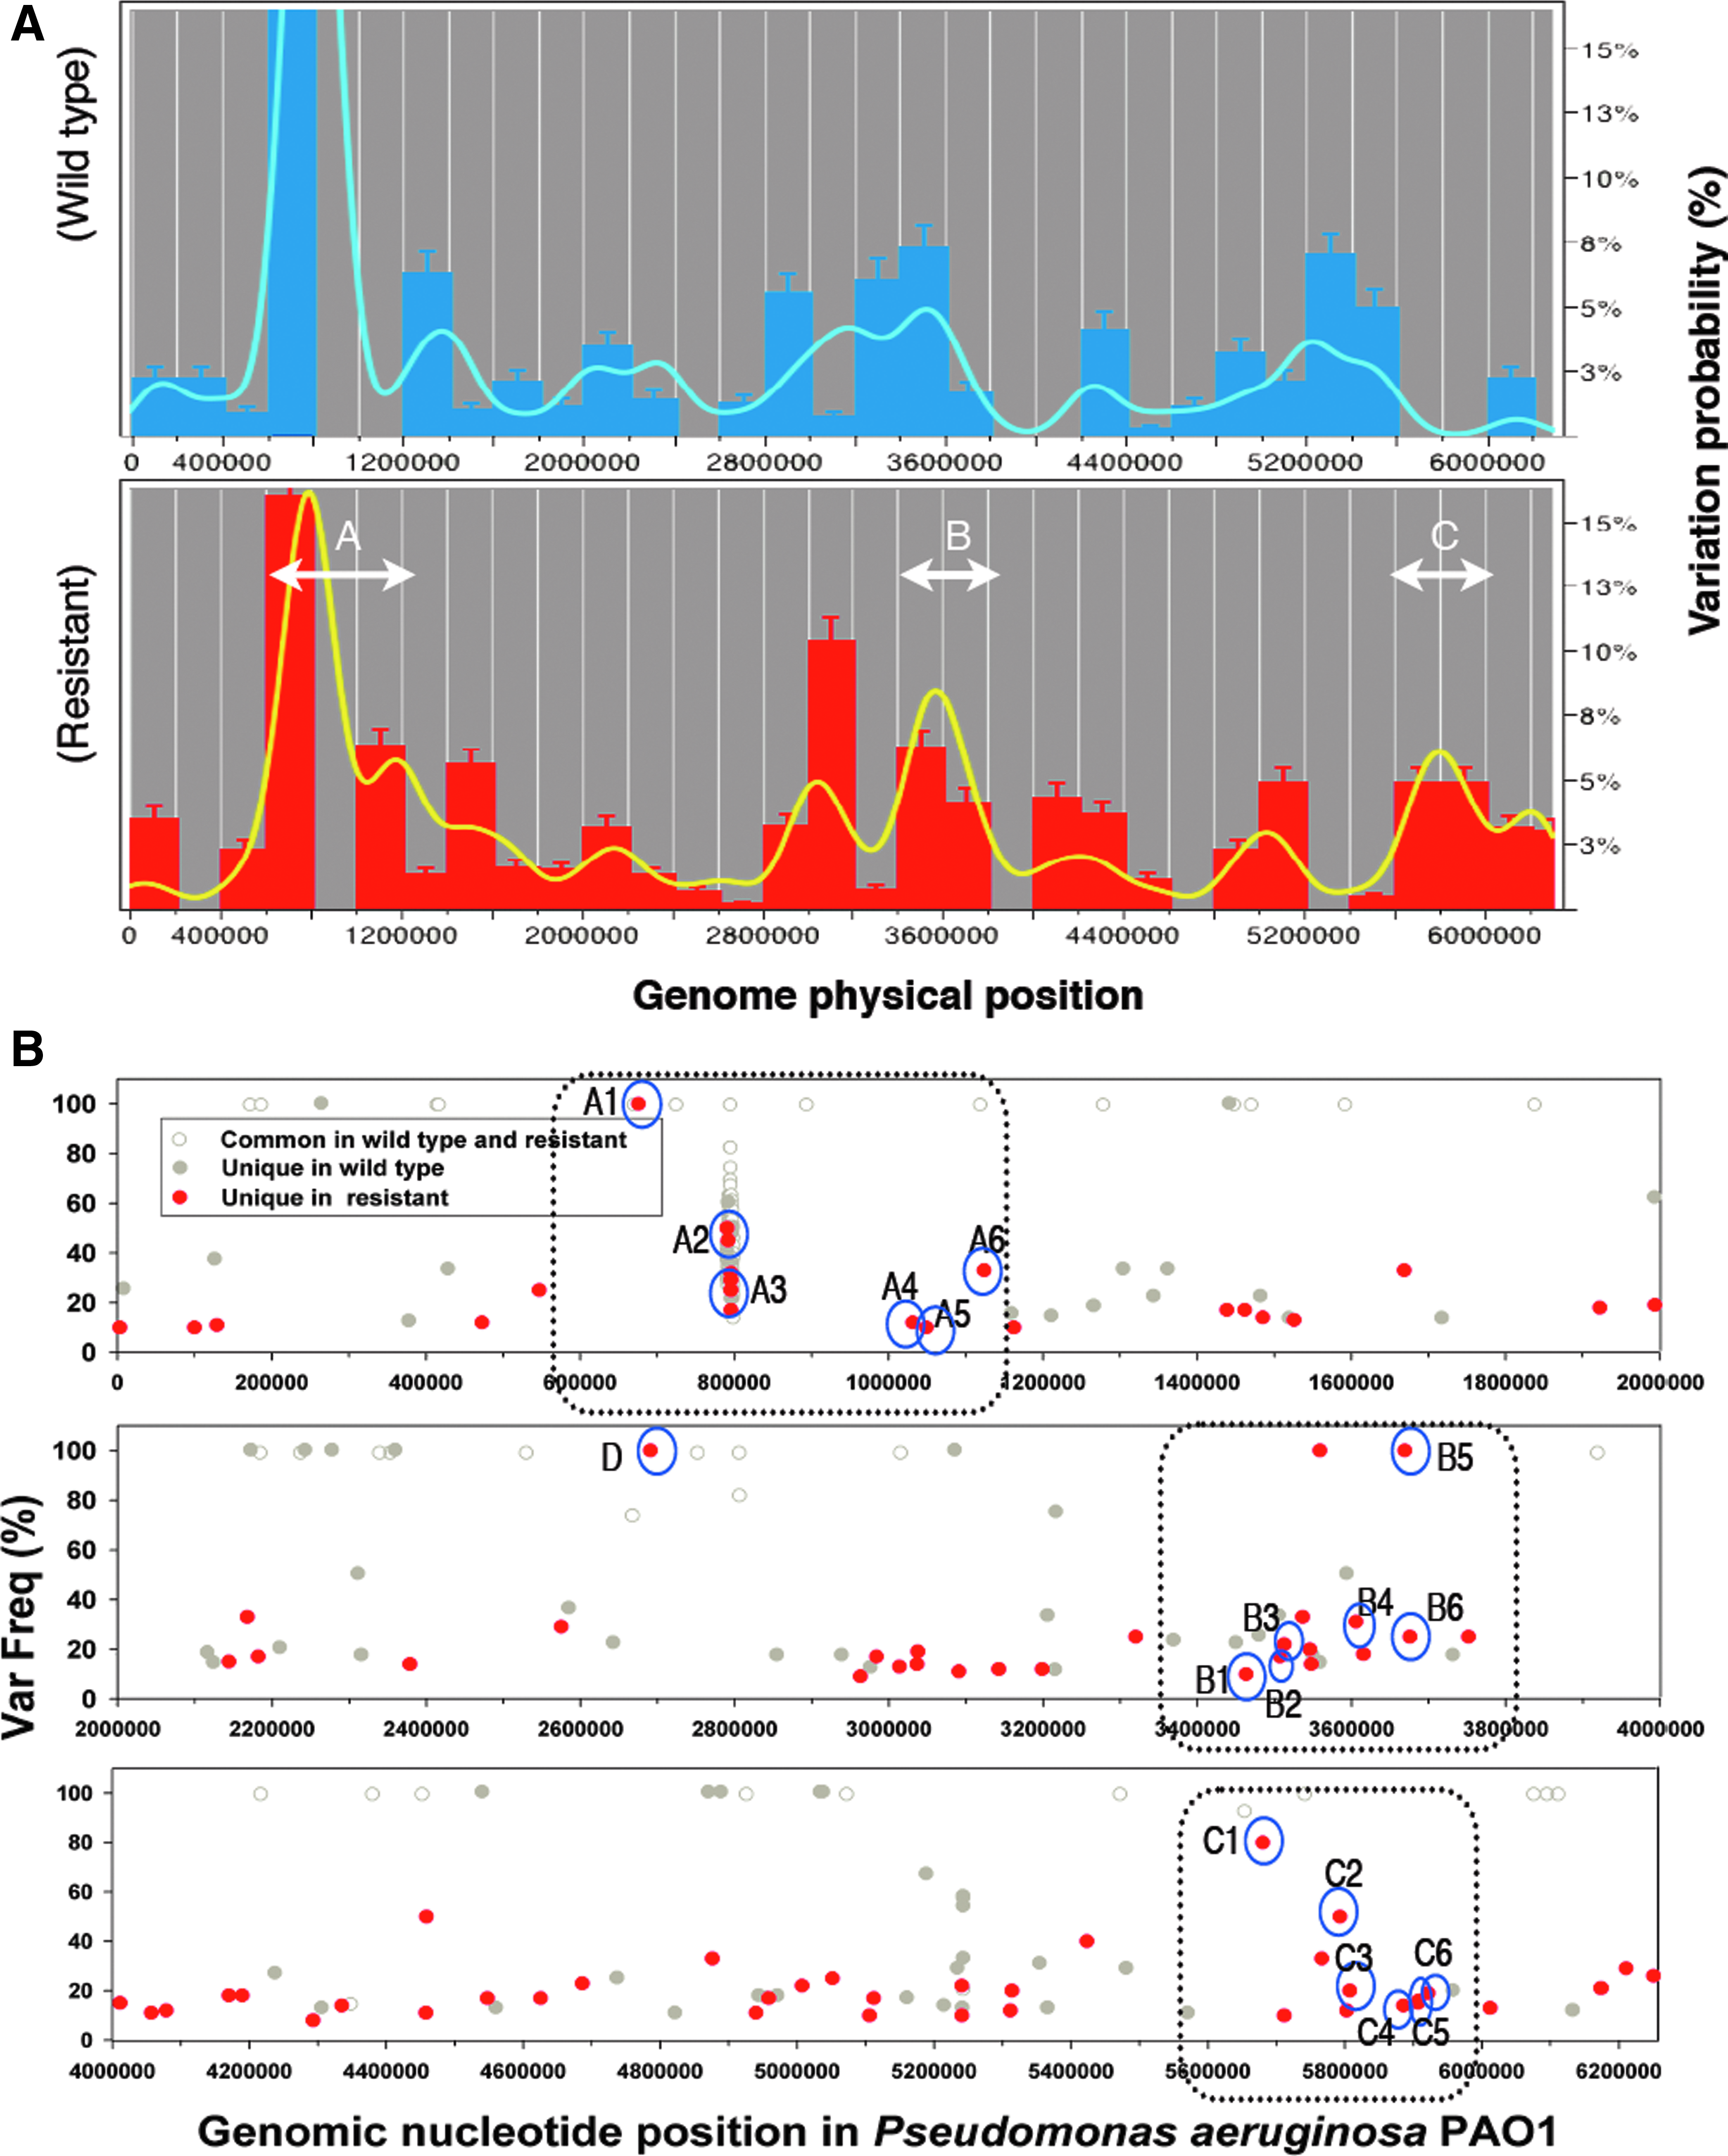
The distribution map of variation sites in resistant Pseudomonas aeruginosa (PA). We used the P. aeruginosa PAO1 genome (NC_002516.2; GI 110645304) as the reference for sequence reassemblage and variation identification of our collected wild type P. aeruginosa PAO1 and its derivative resistant strain PAO1-CipR.
After noting the established variation profiles and identifying the gene variation candidates within the high variability regions, we then checked the availability of PA transposon mutants from UW Genome Center, and requested specific gene knockout strains for further ciprofloxacin resistance assay.
Results
Comparative genomic analysis of PAO1-CipR and PAO1
The PAO1-CipR genome assembly yielded 1705 contigs with a total 12-fold sequencing average depth, while our collected wild type PAO1 genome assembly yielded 862 contigs with a total 11.3-fold sequencing average depth (all sequenced contigs have been deposited at GenBank under the accession PRJNA202063/ASJG00000000 & PRJNA201024/ASJY00000000). Interestingly, despite the fact that resistant PAO1-CipR had higher overall total read numbers, we found that it had more unmapped read sequences (381 vs. 319) and fewer assembled total bases (5,802,470 bp vs. 6,061,093 bp), when compared to the wild type PAO1. Those data indicated that PAO1-CipR had more un-closed sequence gaps than its original wild type PAO1, which may have been caused by multiple DNA insertions/deletions. 25 To discover more putative variants, we applied a low stringency approach that allowed a variant to be identified based on a very small number of reads (i.e., two reads). In cases of low read counts, sequencing errors can have a greater influence on the data, and so should be interpreted with caution in these cases. Both PAO1-CipR and the original wild type strain showed a total of 204 common variants when compared to the reference PA genome (NC_002516.2) (Supplementary Table S1; Supplementary Data are available online at www.liebertpub.com/mdr). The sequence variation frequency refers to how many times a variant was observed from 454 pyrosequencing reads differed from the reference sequence, and a minimum variation frequency of 10% was considered necessary to indicate the presence of a variant. Along with the common variants, an additional 93 unique variants appeared in the PAO1-CipR genome sequence, including 18 genomic variants located in noncoding regions. Moreover, we found a genomic variation site located in the gyrA gene of PAO1-CipR: this is noteworthy because the gyrA gene mutation is suspected to be a primary factor responsible for ciprofloxacin resistance in PA.11–13,16,29 Our collected wild type genome sequence showed a total of 88 unique variants (sequence variation frequency ranging from 10%–∼100%), 23 of which were located in noncoding regions (see Supplementary Table S1 for all variant information).
The comparison of genomic variation distribution
The 454 pyrosequencing method that we used in this study is based on the “sequencing by synthesis” principle,14,21,24 a technique for accurate and quantitative analysis of DNA sequences. We used this technique to observe and evaluate the DNA synthesis process inside PAO1 and PAO1-CipR, thereby distinguishing their genomic variation differences. With that genomic variation information in hand, we could then examine if the variations were involved in high-level resistance development through a gene knockout experiment.
Though we recognize that 454 pyrosequencing data differ from traditional Sanger chemistry sequencing data, and that these differences could affect downstream applications, such as the detection of rare mutations,3,7,9,28 previous reports revealed that most variations detected by 454 pyrosequencing were not detected by Sanger clone-based sequencing. 19 To estimate nucleotide diversity, we considered a minimum variation frequency of ∼10% to indicate potential variants.
We first generated genomic variation distribution maps for both the wild type and the resistant type using JMP 9.0 software. These variation distribution maps show that for both the wild type and the resistant genomes, the most abundant variants (∼35% probability for wild type and ∼22% probability for resistant) were located on the chromosome between 600,000 and 1,200,000 bp (Fig. 1B)–a region rich in probable bacteriophage coding genes. 5 For the PAO1-CipR genome, the variant distribution was different in the 3,400,000 to 3,800,000 bp region and in the 5,600,000 to 6,000,000 bp region, when compared with the wild type genome. The smooth curve in Fig. 1A shows that there are three major variation areas in the resistant genome, which we labeled as zones A (600,000–1,200,000 bp), B (3,400,000–3,800,000 bp), and C (5,600,000–6,000,000 bp). Zone A in both the wild type PAO1 and the resistant PAO1-CipR genomes showed a relatively similar variation distribution pattern, while zones B and C showed a more distinguishable variation pattern between the genomes. We will call these highlighted, major variant locations “resistance-associated high variability regions” and we selected the variants within these regions for further gene knockout molecular function assay. The individual variants that we identified from the resistant and wild type genomes are displayed from low to high variation frequency in Fig. 1B.
The identified high variability regions and their impact on resistance development
Once the suspected resistance-associated high variability regions were determined, we identified potential variants within those regions as candidates for further gene functional assay. We first searched the P. aeruginosa PAO1 transposon mutant library (UW) to see which transposon mutants were available for further ciprofloxacin exposure response assay and found a total of 19 variation candidates (Table 2): 4 with genes appearing with high-variation frequency (>90%), and 15 with genes appearing with lower variation frequency (10%–∼75%). The gyrA gene in our PAO1-CipR genome appeared as a variation; however, there was no transposon mutant available for further antibiotic exposure assay. In addition, we selected two transposon mutant control strains (Cont-1 and Cont-2 in Table 2 & Fig. 2), which were used as the protein function assay control sets in our previously published study, and which our 454 pyrsosequencing data indicated had no variants in this study; furthermore, their location outside of our suspected resistance-associated high variability regions made them appropriate for comparison. Lastly, candidate D, a probable adhesion protein gene, was chosen because it showed significant variation frequency in our pyrosequencing data, but was not located in any of our suspected high variability regions.
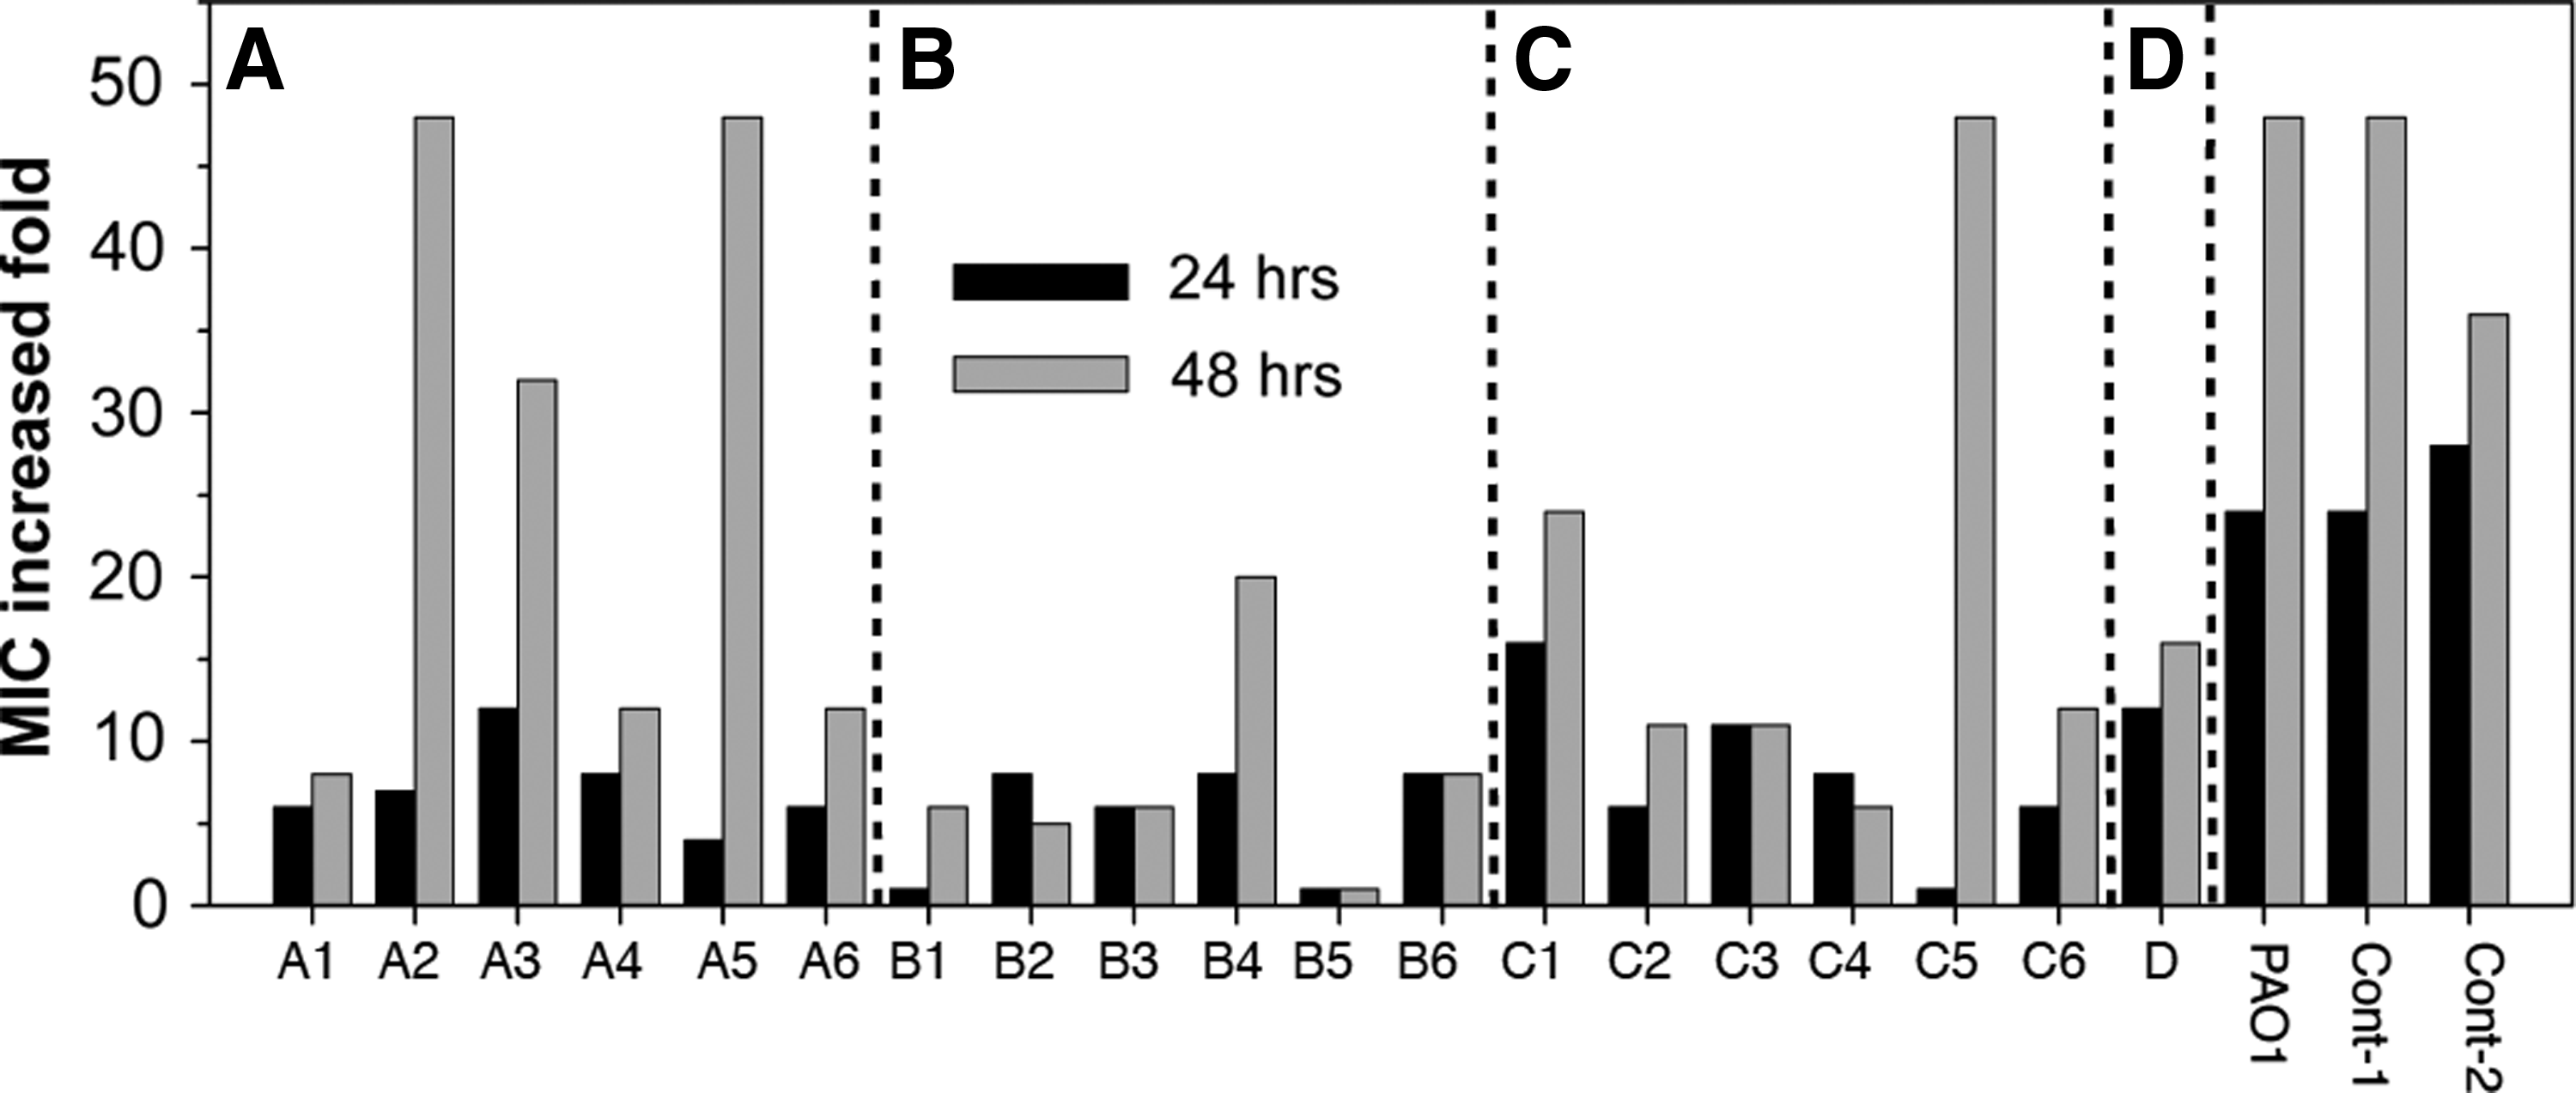
Ciprofloxacin response profile for gene variant transposon mutants versus controls. After 24- and 48-hr ciprofloxacin exposure in liquid medium at 4×the starting minimal inhibitory concentration (MIC) (0.5 μg/ml), the wild type, control strains, and candidate strains were retested to determine MIC levels relative to the starting level. Within the 24-hr treatment, all transposon mutants showed a reduction in MIC when compared with the wild type PAO1 and the control strains. After the 48-hr treatment, the A2, A3, A5, and C5 transposon mutants showed no reduction (or significant reduction) effect for ciprofloxacin resistance development. The panels A,B, and C, along with candidate D, represent the high variability regions and the indicated individual variants in Fig. 1. MIC data are averaged from duplicate Etest experiments.
Mutant strain ID number is based from the University of Washington Genome Center, Pseudomonas aeruginosa PAO1 transposon mutant library.
With 48-hr continuous ciprofloxacin exposure (4×MIC), the wild type PAO1 (having a starting MIC of 0.5 μg/ml) and the two transposon mutant control strains displayed a 48-fold increase (MIC of 24 μg/ml) when compared with their initial MICs (Fig. 2). The transposon knockout assay for the variation sites in zone A yielded diverse results; disruption of the bacteriophage Pf1 genes (A2 and A3) had little effect on development of high-level resistance. On the other hand, transposon disruption within an unknown gene of high variation frequency (A1) and within a probable transcriptional regulator (A4) seemed to have a significant effect on resistance development (Fig. 2).
For nearly all of the individual variation sites in zones B and C, along with candidate D, a probable adhesion protein gene, there was a 50%–94% reduction in resistance development. The only exception was a variation site within a hypothetical protein-coding gene (C5, Table 2 and Fig. 2).
In all, 15 out of 19 candidate genes containing frequent mutations, when disrupted, resulted in a reduction in resistance development. Nearly 80% of isolated variation candidates showed a reduction in resistance ability, providing evidence that resistance development is not the result of individual gene variation, but rather is the result of multiple genes involved in a broad range of interaction regulation mechanisms. For example, of the 15 candidate genes we identified, 6 were correlated with ATP binding/transportation; 2 with transcription regulation; 1 with transduction regulation; and 1 with translational modification; while only 5 represented genes of unknown function. These results may have broad implications in terms of strategy in combating drug resistance: instead of targeting a specific gene for a new type of antibiotic discovery, a multiple-targets treatment therapy may prove to be a more promising method for preventing rapid resistance development during the repeated antibiotic therapy process. 4
The link between the resistance-associated high variability regions and their gene annotations
Since our study suggested that genome high variability regions associated with resistance development exist in PA, we then asked: why do these regions appear more pronounced in the resistant genome? Does any correlation exist between those discovered gene variants and their gene function? To answer these questions, we focused on the specific genomic regions to explore the gene variants and their nearby gene clusters.
As shown in Fig. 3, the highest variation ratio in zone A was the result of a probable bacteriophage Pf1 gene cluster (12 genes in a row); the genes encoding the helix destabilizing protein (PA0720) and the coat protein of bacteriophage Pf1 (PA0724) are the major variation sites. The variants at PA0614 (strain A1 represented its transposon mutant), a hypothetical protein-encoded gene located in front of another probable bacteriophage protein-encoded gene cluster (ranging from 677,000 to 683,000 bp), showed an 84% reduction in the ability to develop resistance. The variants at PA0942 (a transcriptional regulator, strain A4) and PA1035 (a hypothetical protein, strain A6) both showed a 75% reduction in resistance.

Genome comparative analysis of the distribution of sequence variants and the association with their genes' functional annotations. The PA genome diagrams shown here were generated by GBrowse from Pseudomonas Genome Database v2 (www.pseudomonas.com/gbrowse_index.jsp). The three main high variability regions are identified by the letters A, B, and C. The gene annotations (noted in dark green) were from the PseudoCAP genes (Pseudomonas aeruginosa Community Annotation Project). Red stars indicate the variants' locations and which had transposon mutants available. Operon predictions found using PathoLogic are shown as light blue arrows, representing the transcription units, while red arrows indicate that those variants are in an operon. The gyrA and hisH2 genes shown in zone B did not have a transposon mutant available for antibiotic exposure assay.
In zone B, the resistant genome showed a distinguishable variation distribution difference when compared with the wild type genome: we discovered eight unique variants, including the variation in gyrA, in this zone. PA3083 (aminopeptidase N), PA3124 (a probable transcriptional regulator), and PA3130 (a hypothetical protein) were located in the 3,460,000 to 3,510,000 bp region of the genome, and this region included 10 nearby genes related to general secretion pathways. In the 3,530,000 to 3,560,000 bp region, the variants of the gyrA and hisH2 genes were found. It is known that a gyrA mutation will increase ciprofloxacin resistance in PA, and the hisH2 gene, located within a lipopolysaccharide biosynthetic cluster, may be associated with amino acid transport and the formation of biofilm. 8 Unfortunately, these two genes have no transposon mutants available for antibiotic exposure assay, so we could not evaluate whether mutations in these gene contribute to resistance sensitivity in PA. In the 3,610,000to 3,680,000 bp region, PA3228 (a probable ATP-binding/permease fusion ABC transporter), and PA3275 and PA3282 (hypothetical proteins) had nearby genes that function as ATP-dependent DNA helicases and probable two-component sensors.
In zone C, PA5045 (a penicillin-binding protein) showed high gene variation potential but its transposon mutant did not suggest that it had a significant reduction in resistance-acquiring ability. The variants of PA5146 (a hypothetical protein) and PA5160 (a drug efflux transporter) encoding genes were located in the 5,790,000 to 5,810,000 bp region of the genome, which included a probable ATP-binding component of an ABC transporter, a probable permease of an ABC transporter, and a probable outer membrane protein precursor and multidrug resistance protein gene cluster. Interestingly, multiple drug-resistant protein genes are clustered in this region. Moreover, there are variations identified at PA5231 (a probable ATP- binding/permease fusion ABC transporter), PA5248 (a hypothetical protein), and PA5262 (an Alginate biosynthesis protein) located in the genome at 5,886,000 to 5,923,000 bp: our genome sequence analysis showed that variants were identified within a gene cluster linked with an ATP-binding cassette superfamily and two-component signal transduction systems. Most of the variants located in Zone C showed an interesting linkage between energy-dependent transportation and signal transduction systems, which provides further support of the results found in our previous study. 26
Discussion
In summary, our data suggest there are three potential high variability regions in PA associated with ciprofloxacin resistance development. In zone A, a high variation profile existed for both the wild type and resistant genomes, regarding the probable bacteriophage protein-coding genes. However, based on our transposon gene knockout functional assay, the data did not show a strong link with resistance development in PA. In zone B, the resistant genome displayed a variation profile distinguishable from that of the wild type, and those selected genes with potential high variation were closely related with general secretion pathways, ATP-dependent DNA helicases, and probable two-component sensors. The most unusual variation region in the resistant genome was zone C, which showed the identified variant genes having a potential functional link with an ATP-binding cassette superfamily and two-component signal transduction systems.
It is worth noting that in our previous study, we took a proteomics approach to identify upregulation of phosphorylation on two proteins (succinate-semialdehyde dehydrogenase and methylmalonate-semialdehyde dehydrogenase), which we suspected were part of an energy production regulation pathway that might be involved with resistance development. 26 These two identified proteins were not located in any of our suggested high variability regions in PA; however, they may be associated with the variation candidates we discovered in this study since some of them showed a close relationship with signal transduction and energy-related pathways.
Meanwhile, a recent study that used a deep-sequencing procedure (the Tn-seq circle method) to detect large numbers of transposon mutants in PA identified 117 genes associated with intrinsic tobramycin resistance. 10 A group of mutations in 28 genes led to at least four-fold decreases in the tobramycin MICs; of these, 13 were previously identified resistance genes and 15 were newly identified, covering the gene functions of transport and amino acid metabolism, and including transcriptional regulators and peptidyl-prolyl isomerases. Both our study and the work of Gallagher et al. revealed a multiplicity of new genes associated with resistance in PA, though the Tn-seq approach provided a genome-wide identification of intrinsic resistance genes, 10 while our study identified the existence of genomic high variability regions after PA was exposed to ciprofloxacin. Of the 28 intrinsic resistance genes identified by Gallagher et al., 3 were located inside our high variability regions (PA5199 and PA5200 in Zone C and PA3194 in Zone B). In light of our observations and these published data, we also suspected that an adaptive selection pressure that enriched the variants might provide an increased fitness advantage for those cells continuously exposed to ciprofloxacin. For example, the high level resistance of isolated PAO1-CipR in this study may be a result of the gyrA mutation and a group of newly-identified adaptive variation genes that together compensate for the fitness cost of resistance. So we may have identified a group of genes in the high variability regions that potentially link to a set of pathways that favor an increase of growth fitness during antibiotic exposure. This idea is supported by the fact that when we used transposons to truncate a single gene in these positions, this increased fitness advantage was eliminated, seemingly because the variants involved in the pathways might act together to develop resistance.
Resistance in PA is a multiregulation process involving preexisting cellular pathways 26 and accumulated gene mutations (the results shown in this study). By performing comparative genome analysis with 454 pyrosequencing technology, we found three main potential high variability regions in PA, and from the transposon gene functional assay, we found that the physical locations of the genomic variations impacted the development of ciprofloxacin resistance differently. In this study, 454 pyrosequencing technology allowed us to explore whether any potential variation regions exist that may result in resistance development. By using this approach, we generated gene variation distribution maps (Fig. 1A, B) for the wild type genome and resistant genome, which showed variation profiles suggesting that a variety of evolutionary paths could drive PA to become resistant to antibiotic treatment. Our results indicate that not only will the high variation sites be primary factors that cause a rise in the level of resistance, but also that those lower potential variations represent all theoretical genome mutation sites which may also impact resistance development once the mutation occurs. Moreover, we also suspect that there are many undiscovered variations that may be present in the sequence gap regions for which we could not gather data. For example, we noticed several annotated efflux pump sequences showing unique sequencing gaps ranging from 50 to 700 bp in the resistant genome, which were not discovered in our wild type strain's genome.
The variation distribution maps that we generated in this study will be valuable tools for in-depth comparisons when more exposure genome variation sequences become available. That information will allow researchers to uncover the resistance development network on a more comprehensive level, ultimately helping to improve antibiotic therapies and combat the rapid rise of drug resistance.
Footnotes
Acknowledgments
This work was supported by R01HG003700, a grant from the National Institutes of Health (NIH) to Morgan C. Giddings, and a grant to perform the sequencing from the University of North Carolina School of Medicine.
We thank Dr. Piotr Mieczkowski of the High Throughput Sequencing Facility at the University of North Carolina for assisting with the sequencing performance. We also wish to thank Dr. Xiaojun Guan, formerly of the UNC Center for Bioinformatics, for technical support with the 454 sequencing data; Dr. Stuart Jefferys, formerly of the UNC Lineberger Comprehensive Cancer Center, for thoughtful discussion on this study; and Wendy Spitzer for the excellent editorial help with the manuscript.
Disclosure Statement
All authors declare that no competing financial interests exist in the design, execution, or any other part of this study.
References
Supplementary Material
Please find the following supplemental material available below.
For Open Access articles published under a Creative Commons License, all supplemental material carries the same license as the article it is associated with.
For non-Open Access articles published, all supplemental material carries a non-exclusive license, and permission requests for re-use of supplemental material or any part of supplemental material shall be sent directly to the copyright owner as specified in the copyright notice associated with the article.