
Abstract
In this study, extracts were obtained from leaves of Pyrus communis L., Pyrus elaeagrifolia Pall., and Pyrus pyrifolia (Bum.) Nak. These extracts were tested for antiradical and antibacterial activity, as well as for the amount of total phenolic compounds, hydroquinone and arbutin. The antiradical activity was measured using 2,2-diphenyl-1-picrylhydrazyl radical and antibacterial activity with the disk diffusion method. The amount of phenolic compounds was determined using Folin Ciocalteu's phenol reagent, but the amount of hydroquinone and arbutin was measured with high performance liquid chromatography. The strongest antiradical activity was observed for ethyl acetate extract from leaves of P. communis L., and the lowest for the poorly soluble fraction (precipitate) from leaves of P. elaeagrifolia Pall. The highest number of antiradical units per gram of raw materials was noted for leaves of P. communis. The strongest antibacterial activity was measured for ethyl acetate extracts. The calculation of Spearman rank correlation coefficients indicated the existence of a positive correlation between contents of hydroquinone in extracts and their antibacterial activity for almost all investigated bacterial strains. The strains of fungi such as Candida albicans and Saccharomyces cerevisiae were completely resistant to the action of extracts.
Introduction
A
Pyrus communis L. (European pear, common pear) occurs in central and eastern Europe and in the southwestern regions of Asia. It is a tree growing up to 15–20 m in height. The leaves are broad and ovoid or roundish with serrate margin alternately arranged. The flowers are always white, and have five petals. Its fruit is pome, and green or yellowish in color.
Pyrus elaeagrifolia Pall. is a tree growing up to a height of 10 m, and is found in Asia Minor in Turkey, and in the Balkans in countries such as Albania, Bulgaria, and Greece. Leaves are ovate, and slightly serrate. Flowers are small and white, developing at the same time as the leaves. Its fruit is small and roundish, growing up to 2 cm in length.
Pyrus pyrifolia (Burm.) Nak. (sand pear) originates from China, Japan, and Korea. Trees grow up to 10 m in height, and its flowers are white, 3–3.5 cm in diameter, and gathered in clusters. Its leaves are dark green and glossy. Its fruit is hard, round, 3–4 cm in diameter, brown in color, and covered with pale dots.
Very important compounds from the point of view of antibacterial activity are quinone and their derivatives11,14 such as arbutin, hydroquinone, 14 and benzoquinone.11,13,14 Extracts obtained from species of the genus Pyrus are always rich in these compounds and therefore exhibit strong antibacterial activity. 11
Other problems concerning health are free radicals,4,24 reactive oxygen species6,16 and negative results of their action in terms of cancers,5,18 atherosclerosis, 22 and many other diseases.8,15 Raw materials obtained from the plants mentioned above, apart from quinone, also exhibit antibacterial activity and are rich in phenolic compounds 3 such as flavonoids, phenolic acids, and especially tannins, which are known as strong antioxidants and antiradical compounds. 17
In this study, extracts were obtained from the leaves of species belonging to the genus Pyrus. After preliminary high performance liquid chromatography (HPLC) analysis and evaluation for hydroquinone and arbutin, three were chosen for antibacterial and antifungal activity analysis, as well as for the measurement of amounts of phenolic compounds and antiradical activity of obtained extracts.
Materials and Methods
Materials
Raw materials
All the raw materials were obtained from Adam Mickiewicz University Botanical Garden, Poznań, Poland, in September 2011. The voucher specimens were deposited in the herbarium of the University Botanical Garden, Poznań: (a) 10 g of P. communis L. (European pear) leaves; (b) 10 g of P. elaeagrifolia Pall. (Oleaster-leaved pear) leaves; (c) 10 g of P. pyrifolia (Bum.) Nak. (Asian pear, Chinese pear, nashi pear) leaves.
Reagents
The following reagents were used: gradient grade methanol HPLC (Merck, Darmstadt, Germany); methanol, ethyl acetate, and sodium carbonate (Chempur, Piekary Śląskie, Poland); Folin–Ciocalteu's phenol reagent and hydroquinone (POCh, Gliwice, Poland); gallic acid and arbutin (Extrasynthese, Genay, France); and 2,2-diphenyl-1-picrylhydrazyl radical (DPPH) and methanol (Sigma Aldrich).
Instrumentation
The following instruments were used: HPLC (Knauer, Berlin, Germany) equipped with type 64 HPLC pumps and a UV-VIS detector (254 nm); a LiChrospher 100, RP-18 (5 μm) column (250×4 mm; Merck), with an injection volume of 20 μl; and a Hitachi U-5100 UV-Vis (Tokyo, Japan) ratio-beam spectrophotometer.
Methods
Preparation of extracts
The dried raw materials were chosen after preliminary screening extraction with 20% methanol in water, and measurement of the amount of arbutin and hydroquinone with HPLC.
All the raw materials were extracted with 200 ml of 20% methanol in water for 48 h at 40°C using a reflux system. The obtained extract was divided into two unequal parts (40 and 160 ml). Part of the 40 ml extract was condensed under reduced pressure at 40°C to obtain dry residue WA by evaporating the solvent. The remaining 160 ml was evaporated under reduced pressure, and the dry residue was dissolved in water at 40°C and then stored for 48 h at 4°C. The formed precipitate was filtered (Munktell & Filtrak, Bärenstein, Germany), and then dissolved in methanol and evaporated to obtain residue WD. The aqueous solution after precipitate separation was subjected to exhaustive extraction with ethyl acetate. The ethyl acetate and remaining water extracts were evaporated under reduced pressure (40°C) to obtain dry residues of WC and WB respectively.
Extracts obtained from P. communis L. were additionally marked with the letter “c,” extracts from P. elaeagrifolia Pall. with the letter “e,” and extracts from P. pyrifolia (Bum.) Nak. with the letter “p.”
The weights (±0.1 mg) of individual extracts were as follows: WAc, 512.6 mg; WBc, 1853.4 mg; WCc, 137.3 mg; WDc, 67.4 mg; WAe, 365.1 mg; WBe, 2032.6 mg; WCe, 319.5 mg; WDe, 41.6 mg; WAp, 551.3 mg, WBp, 1582.4 mg, WCp, 138.5 mg, and WDp, 43.2 mg.
Measurement of total phenolic compounds
The total amount of phenolic compounds was measured based on the method of Singleton and Rossi. 26 We added 7 ml of water, 0.5 ml of Folin–Ciocalteu's phenol reagent, and 0.5 ml of extract solution at a concentration of 1.5 mg/ml (0.2 mg/ml for extract WC) to the test tubes. Extracts WA, WB, and WD were dissolved in 20% methanol in water, while extract WC was dissolved in 50% methanol in water. After 3 min, 2 ml of 20% aqueous solution of sodium carbonate (Na2CO3) was added. The reaction mixture was heated in a boiling water bath for 1 min. After cooling, the absorbency was measured at 685 nm, in a glass cuvette with an optical path length of 1 cm. The experiment was repeated five times. The amount of phenolic compounds was presented as gallic acid equivalents (GAE) per mg of extract (mgGAE/mg) and g of raw materials (mgGAE/g). The maximal error was calculated with the total differential method.
Measurement of antiradical activity of extracts
Antiradical activity of extracts was measured with the method of Brand-Williams et al. 1 Two milligrams of DPPH was dissolved in 54 ml of methanol. The solution was left in a cool place (4°C) to stabilize the level of absorbency at 515 nm. Before the experiment, the absorbency of the DPPH solution was adjusted with blank methanol to a value of 1. The sample was prepared by the addition of 50 μl of extract solution in methanol (3 mg/ml) to 2 ml of DPPH. The control sample was prepared by the addition of 50 μl of methanol, instead of extract solution, to 2 ml of DPPH. The absorbency was measured at 515 nm at the beginning and after 1 min of reaction. The measurement was repeated five times.
Antiradical activity was presented as the number of antiradical units per mg of extract (TAU515/mg) and per g of raw material (TAU515/g), and the values were calculated according to equations (1) and (2) respectively. One unit of antiradical activity is the amount of substance that causes the change of absorbency of 1 at 515 nm, in 1 min, at 20°C.
where TAU515/mg is the number of antiradical units calculated per mg of extract; A0 is absorbency of DPPH solution at the beginning of the reaction; A1 is absorbency of the DPPH solution 1 min after extract addition; and c is the concentration of extract in the cuvette (mg/ml).
where TAU515/g is the number of antiradical units calculated per g of raw material; TAU515/mgWA is the number of antiradical units per mg of WA extract; mWA is the whole mass of the WA extract obtained from the raw material (mg); TAU515/mgWB is the number of antiradical units per mg of WB extract; mWB is the whole mass of WB extract obtained from the raw material (mg); TAU515/mgWC is the number of antiradical units per mg of WC extract; mWC is the whole mass of WC extract obtained from the raw material (mg); TAU515/mgWD is the number of antiradical units per mg of WD extract; mWD is whole mass of WD extract obtained from the raw material (mg); and WR is mass of raw material (g) taken for extraction. The maximal error was calculated with the total differential method.
Measurement of the amount of arbutin and hydroquinone with HPLC
Extracts WA, WB, WC, and WD were dissolved in gradient grade methanol at a concentration of 3 mg/ml, and filtered through membrane filters (Millipore, 0.22 mm). A HPLC was equipped with type 64 HPLC pumps and a UV-VIS detector (280 nm). A LiChrospher 100, RP-18 (5 μm) column (250×4 mm) was used. The flow rate was 1 ml/min, and the injection volume was 20 μl. The analyses of arbutin and hydroquinone were carried out at room temperature with elution in gradient system of methanol (A) in 2% aqueous solution of acetic acid (B) in the following way: 0–4 min 0% (A) and 100% (B), 4–12 min from 0% to 100% (A) and from 100% to 0% (B), and 12–15 min 100% (A) and 0% (B). The identification and quantitative analyses were done during extract analysis by measuring and comparing the areas and retention times of the identified peaks with the areas and retention times of the peaks of standards (arbutin and hydroquinone). The measurement of each extract was repeated five times. The maximal error was calculated with the total differential method.
Measurement of antimicrobial activity of extracts
The antimicrobial activities of the plant extracts were determined against the following bacterial and fungal strains: Staphylococcus aureus ATCC 25923, Escherichia coli ATCC 25922, Pseudomonas aeruginosa ATCC 27853, Bacillus subtilis ATCC 6633, Helicobacter pylori J99, Candida albicans ATCC 90028, Saccharomyces cerevisiae BCMM 3963, S. aureus MRSA (clinical strain), and E. coli ESBL (clinical strain). These strains were obtained from the Department of Microbiology, Wrocław Medical University, Wrocław, Poland.
Description of the method
The antimicrobial activity of the extracts was measured with the method described by Ingolfsdottir et al. 10 The activities were determined by the disk diffusion method on Mueller–Hinton agar plates (Oxoid, Basingstoke, Hampshire, England) for the bacterial strains and on Sabouraud agar plates (Biomed, Warsaw, Poland). The bacterial and fungal suspensions of the strains tested, at a turbidity comparable to that of 0.5 McFarland standard, were diluted in saline (1:10) to obtain a final inoculum of 107 CFU/ml. After that, the suspensions were spread uniformly on agar plates using sterile swabs. Then the standard disks (6 mm in diameter; Becton Dickinson, Sparks, MD, USA) were placed aseptically on the agar plates. After 15 min, a 10 μl aliquot of water-dissolved extract at a concentration of 100 mg/ml was placed on the disks. The plates thus prepared were incubated at 37°C for 24 or 48 h for the bacterial and fungal strains respectively. After incubation, the results were recorded by measuring the diameter of growth inhibition zones (mm) around the disks. Chloramphenicol (30 μg), erythromycin (15 μg), and tetracycline (30 μg) and free solvent (saline) were used as positive and negative controls respectively. These experiments were performed in triplicate, and the results were the average of three independent experiments. Standard uncertainty was established as ±0.33 for all measurements.
Results and Discussion
The amount of phenolic compounds expressed as mgGAE/mg of the extracts and mgGAE/g of the raw materials is shown in Fig. 1 and Table 1. The number of antiradical activity units per mg of extracts (TAU515/mg) and g of raw material (TAU515/g) is shown in Fig. 2 and Table 1. The highest amount of phenolic compounds was measured for extract WCp from P. pyrifolia (0.8281±0.0138 mgGAE/mg). The remaining results, in decreasing order for extracts, were: WCc (0.5591±0.0093 mgGAE/mg), WCe (0.2569±0.0043), WAp (0.1150±0.0018), WAc (0.1092±0.0018), WDc (0.1051±0.0017), WAe (0.0989±0.0016), WDp (0.0793±0.0013), WBc (0.077±0.00128), WDe (0.0749±0.0012), WBp (0.0614±0.0010), and WBe (0.0552±0.0009). The highest amount of phenolic compounds was measured for ethyl acetate extracts; similar results were obtained by Kasprzyk et al. 12 The analysis of the significance of differences between the amount of phenols in each extract is statistically significant (Student's t-test; p<0.05).
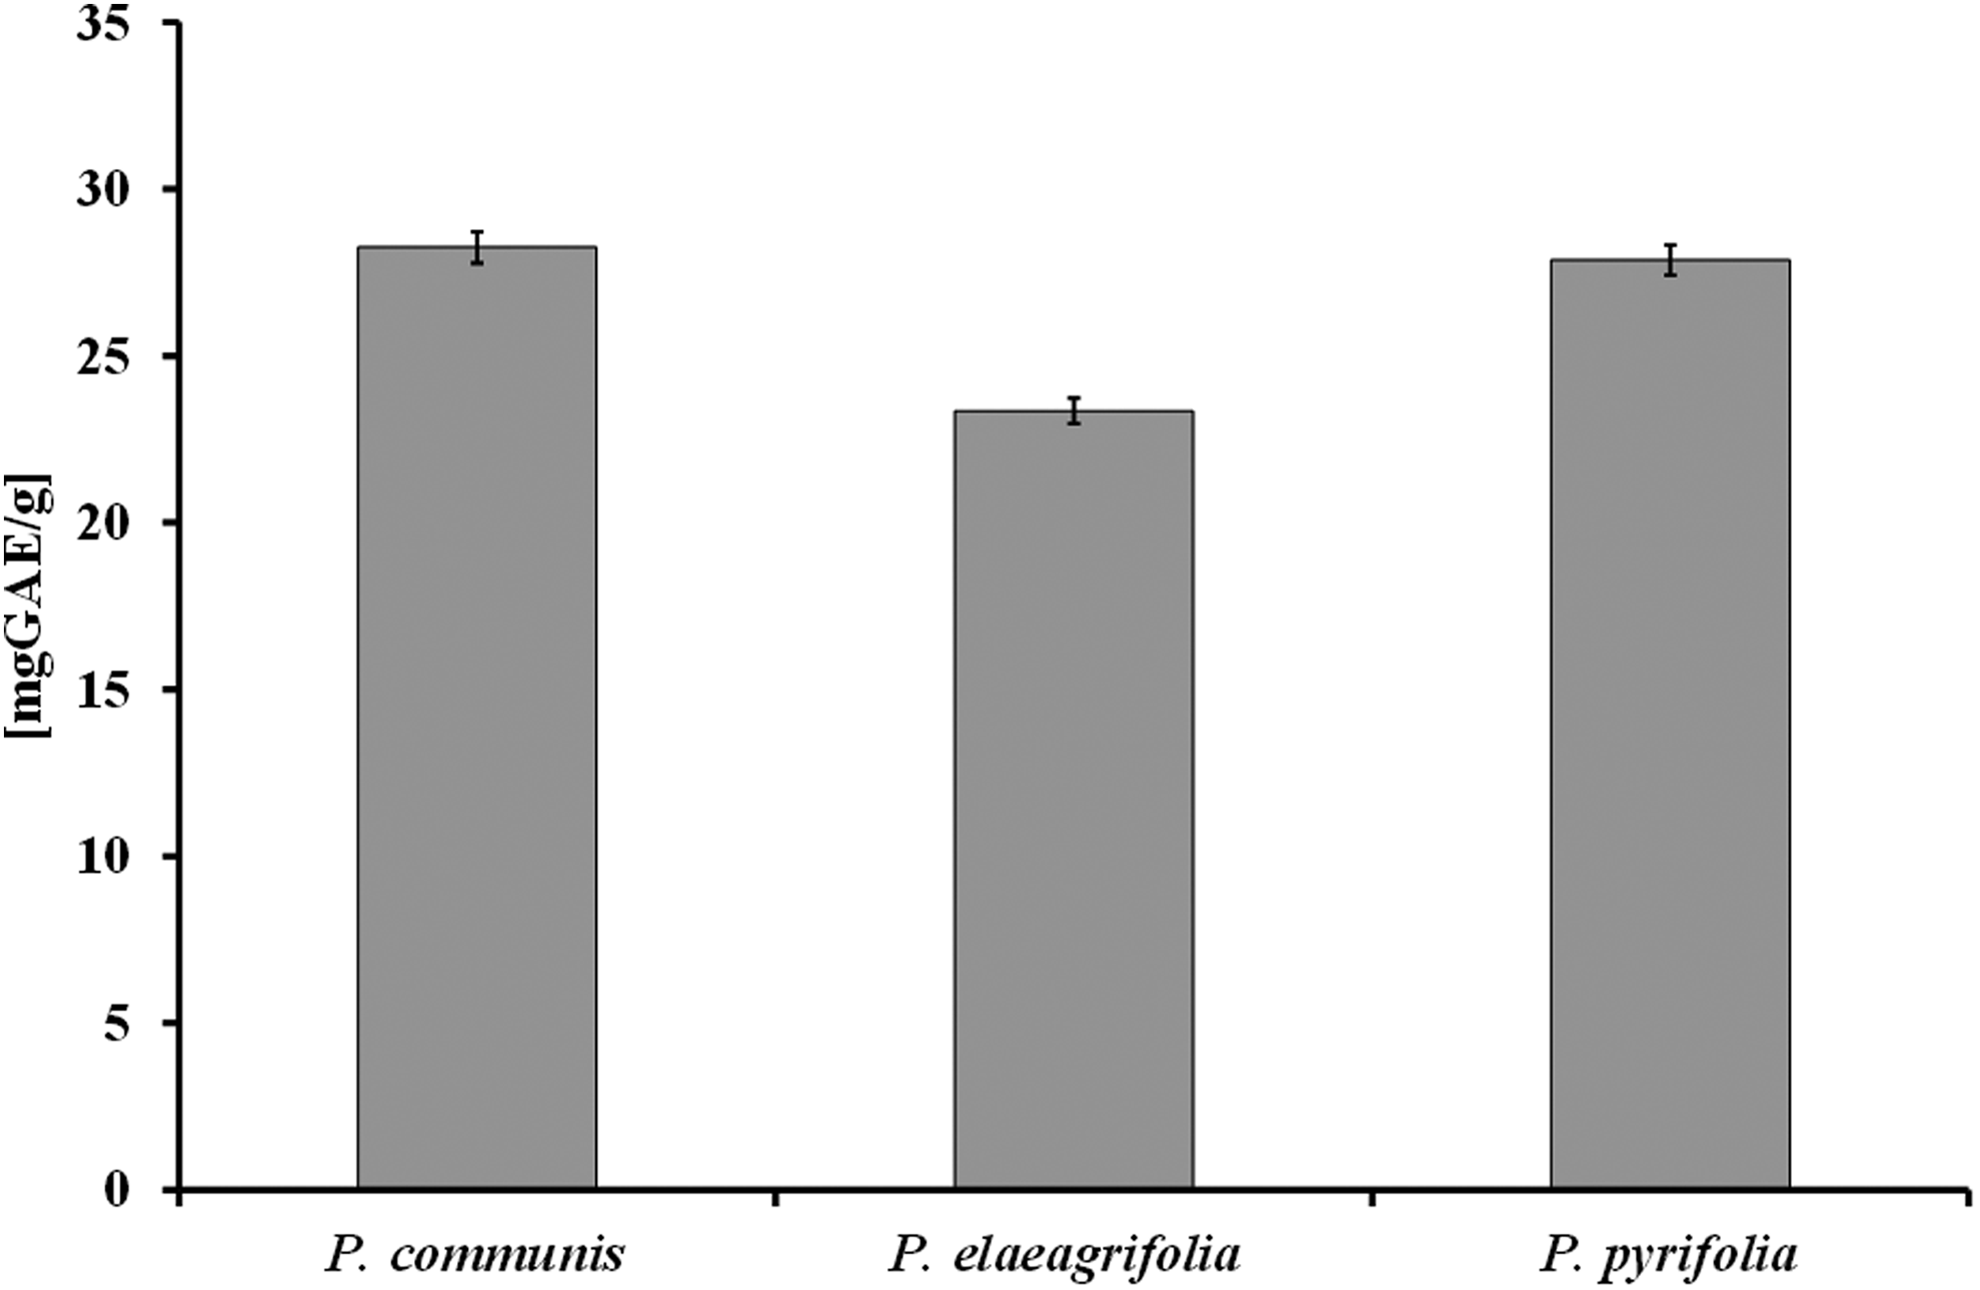
Phenolic compounds amount (mgGAE/g) in leaves of Pyrus communis L., Pyrus elaeagrifolia Pall., and Pyrus pyrifolia (Bum.) Nak.
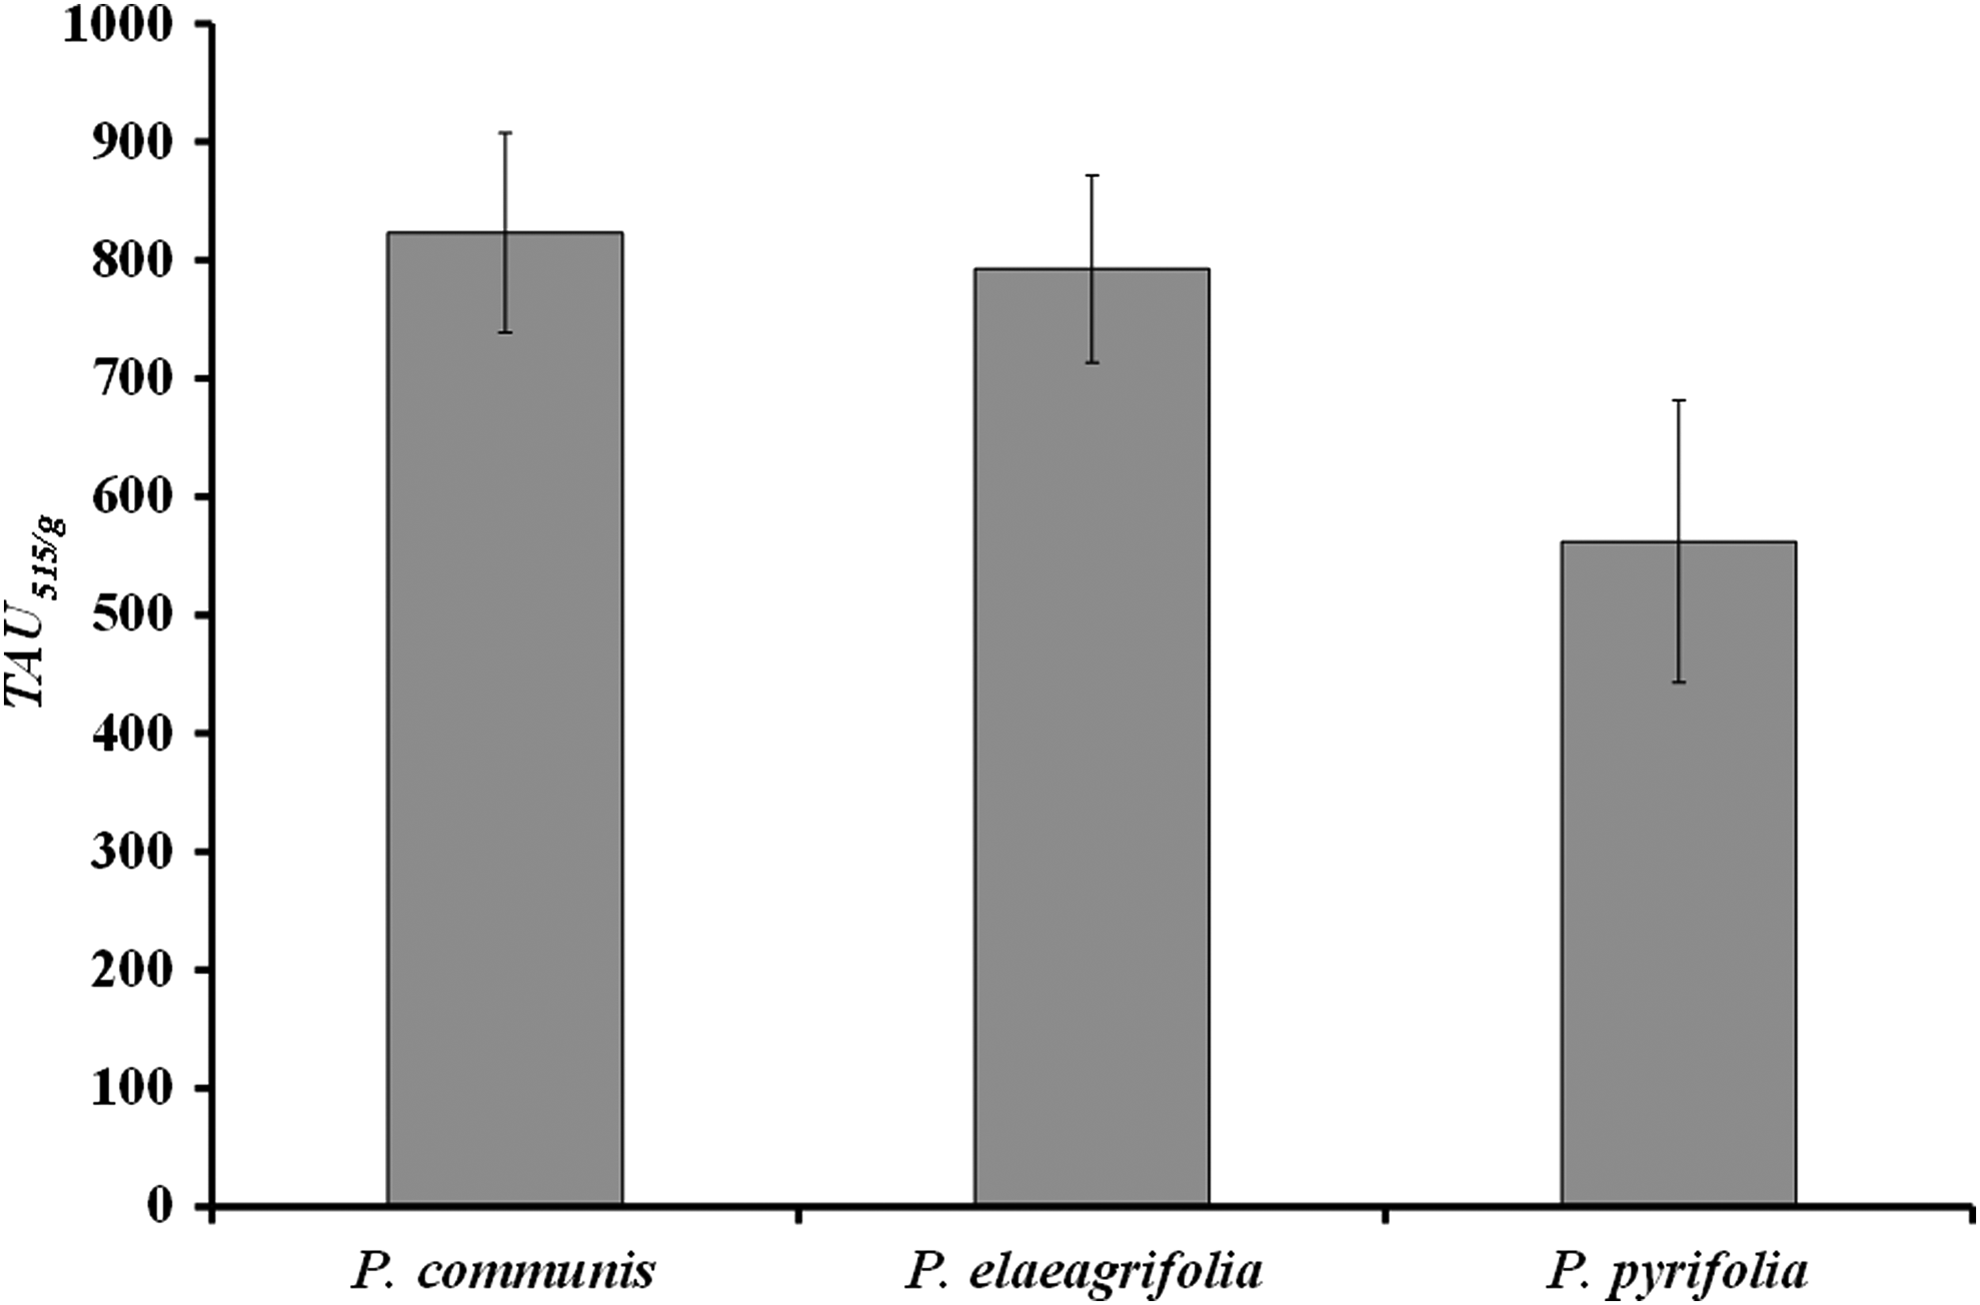
The number of antiradical activity units (TAU515/g) calculated per g of leaves of P. communis L., P. elaeagrifolia Pall., and P. pyrifolia (Bum.) Nak.
Amount of phenolic compounds expressed in mg per mg of extracts (mgGAE/mg) and in mg per g of raw materials (mgGAE/g); amount of arbutin and hydroquinone in extracts expressed in μg of substance per mg of extracts.
—, substance not found.
The strongest antiradical activity was noted for WCc, WCp, and WCe extracts, and the lowest for extracts WBe, WBp, and WBe. These results were statistically significant (Student's t-test; p<0.05).
When phenolic compounds amount was calculated per g of raw material (mgGAE/g), a higher amount of phenols (Table 1 and Fig. 1) was noted per g of leaves of P. communis (28.25±0.469) and P. pyrifolia (27.87±0.454), whereas a lower amount was noted for leaves of P. elaeagrifolia (23.35±0.384). The higher number of antiradical units (Table 1 and Fig. 2), calculated per g of raw material (TAU515/g) was demonstrated for leaves of P. communis (823±84) and for leaves of P. elaeagrifolia (793±79), and a lower number for leaves of P. pyrifolia (562±119). The statistical significance of above results was confirmed with Student's t-test (p<0.05).
The antimicrobial activity of the extracts is demonstrated in Table 2. The sensitivity of individual strains to extracts varies significantly. The strains most sensitive to the extracts' inhibitory action were H. pylori J99 (especially for extracts from P. elaeagrifolia; (Fig. 3)), B. subtilis ATCC 6633 (extracts from P. communis; (Fig. 3)), and S. aureus ATCC 25923 (extracts from P. communis; (Fig. 3)). Slightly lower sensitivity to extracts was shown by methicillin resistant S. aureus (MRSA). Strains such as E. coli ATCC 25922 and P. aeruginosa ATCC 27853 exhibited significantly lower sensitivity, but E. coli ESBL A 190 was almost completely insensitive; the zone of inhibition (8 mm) was observed only in the presence of extract WCp (Fig. 3).
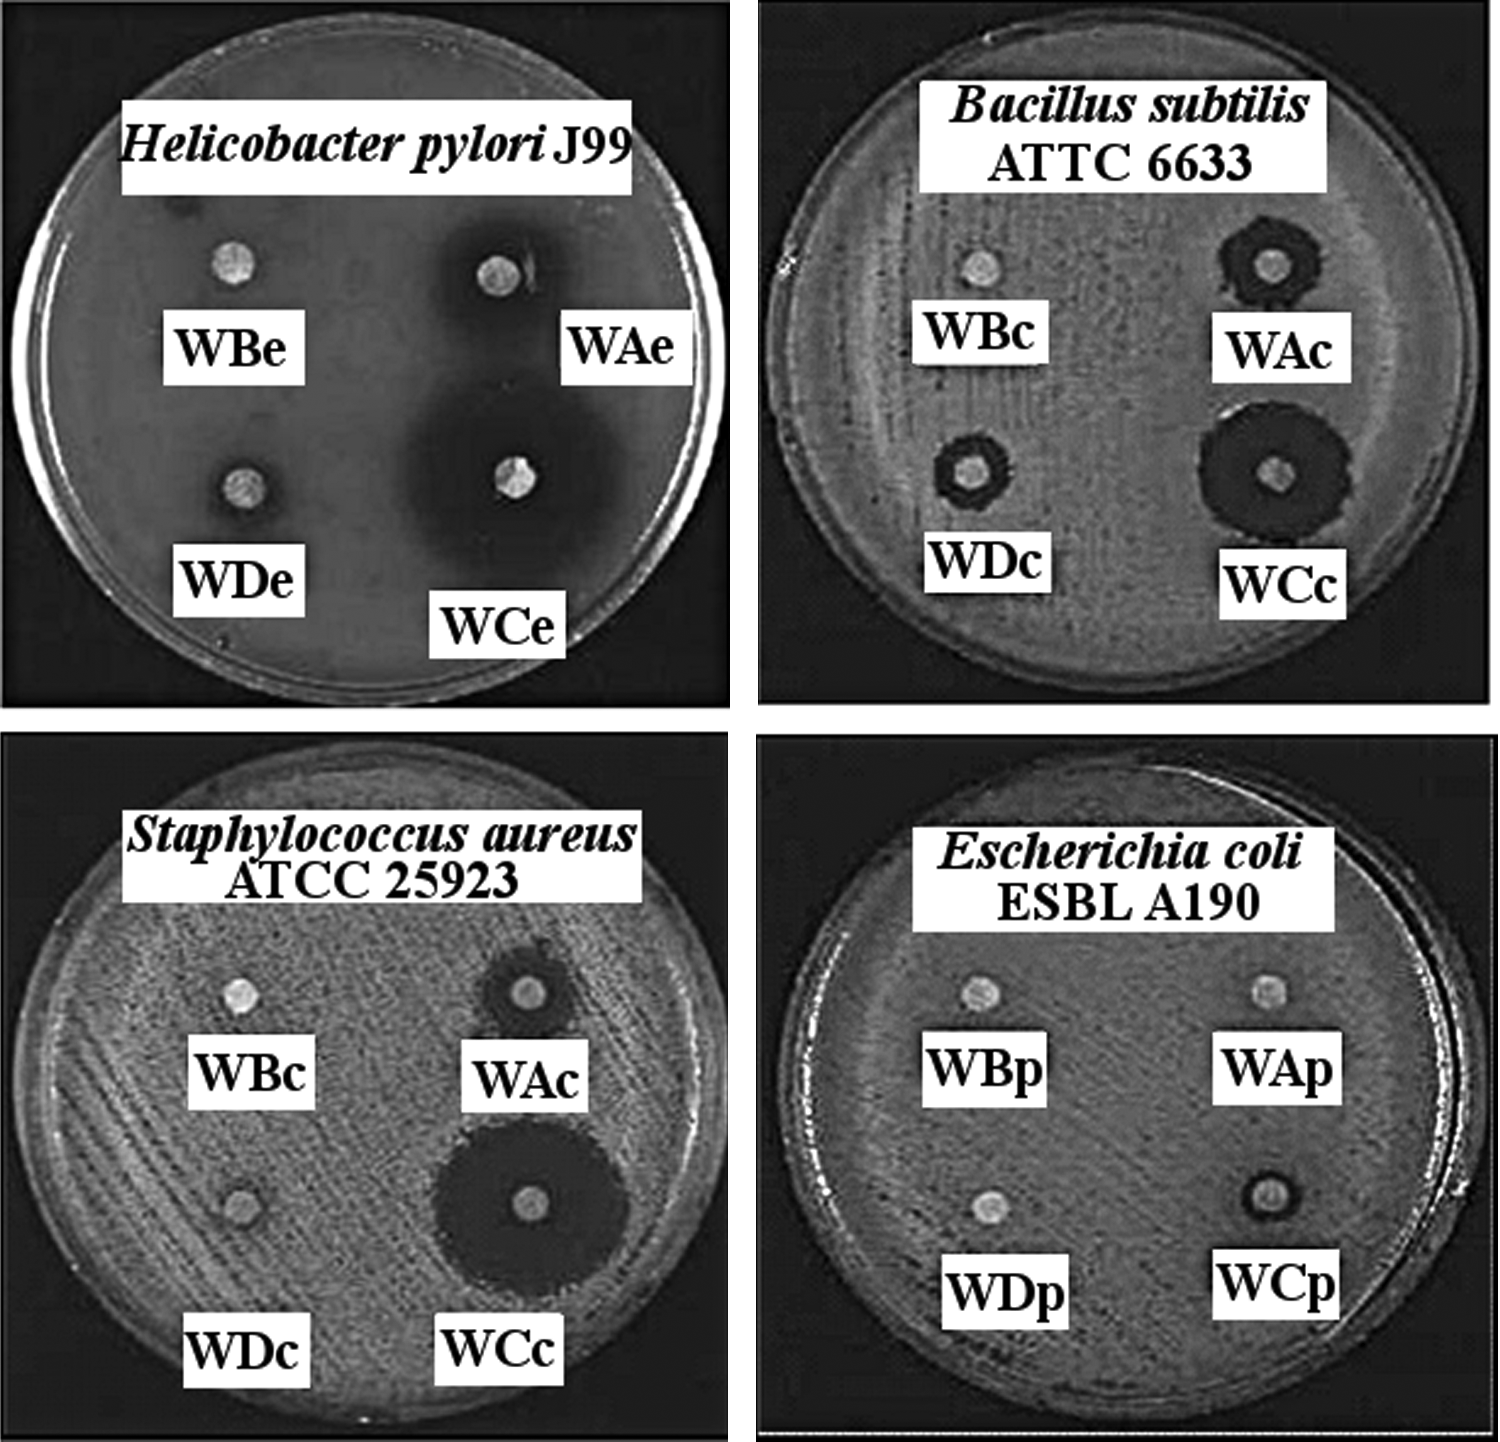
Agar plates demonstrating the action of extracts from P. elaeagrifolia Pall. (WAe, WBe, WCe, WDe) on Helicobacter pylori J99, extracts from P. communis L. (WAc, WBc, WCc, WDc) on Bacillus subtilis ATTC 6633 and Staphylococcus aureus ATCC 25923, and P. pyrifolia (Bum.) Nak. (WAp, WBp, WCp, WDp) on Escherichia coli ESBL A190. One can see a strong inhibition of growth of bacteria in the presence of ethyl acetate extracts (WCe, WCc, and WCp) with high content of hydroquinone and a weaker action of water:methanol (5:1) extracts (WAe, WAc, and WAp). In the case of a very resistant strain of E. coli ESBL A190, the inhibition zone was observed only in the presence of ethyl acetate extract WCp.
Standard uncertainty is ±0.33 for all measurement. No inhibitory effect of extracts was observed on the growth of Candida albicans ATCC 90028 and Saccharomyces cerevisiae BCMM 3963. Chloramphenicol (30 μg), erythromycin (15 μg), and tetracycline (30 μg) were used as positive controls. One mg of each extract were placed on the disks.
—, no inhibition was observed.
In general, the most active were ethyl acetate extracts, which contain much more hydroquinone than other extracts. Three antibiotics were used as a positive control: chloramphenicol, erythromycin, and tetracycline. All antibiotics inhibited growth of S. aureus ATCC 25923 with intensity similar to the ethyl acetate extracts (WCc, WCe, WCp). Antibiotics were also active against B. subtilis ATCC 6633 and E. coli ATCC 25922, although the extracts were slightly less active. In turn, extracts inhibited growth of MRSA more strongly than erythromycin and tetracycline. It can be concluded that extracts, especially ethyl acetate, showed strong antibacterial activity, similar to antibiotics, and could be used as supplements in the treatment of bacterial infections. The interesting thing is that the strain of E. coli ESBL A190 was completely resistant to all antibiotics, and all extracts except one (WCp) showed an inhibitory effect on the growth of this strain.
Plants belonging to the genus Pyrus often contain hydroquinone and its derivatives, such as arbutin, which has high antibacterial activity. 11 In the leaves of plants investigated in this work, there were significant measured amounts of hydroquinone (Table 1). The presence of arbutin was noted mainly in extracts WB and WD, but the highest amount (9.8±0.4 and 9.8±0.1 μg/mg of extract) was detected in extracts WBp and WDp respectively. The largest amount of hydroquinone was observed in WC ethyl acetate extracts for all raw materials, and the highest amount (167±5 μg/ml) was observed for extract WCe from P. elaeagrifolia. The differences between the amount of hydroquinone in each extract is statistically significant, confirmed with Student's t-test (p<0.05).
The preliminary statistical calculation of the correlation between the content of total phenols in extracts and their antimicrobial activity showed the lack of a significant correlation. Therefore, we concluded that the amount of general phenols does not have a significant impact on the observed inhibition of bacterial growth.
In order to observe whether there is a correlation between the content of hydroquinone in extracts and their antibacterial activity for each strain separately, Spearman's rank-order correlation test was performed. The results are shown in Table 3. The correlation coefficients (rs) were calculated for two variables: the amount of hydroquinone and the inhibition of bacterial growth. The p-value was mostly <0.05, indicating that the calculated Spearman's correlation coefficients are statistically significant. They are also positive and high, indicating that hydroquinone is an important substance for antibacterial activity in the extracts. Only in the case of the strain E. coli ESBL A190 was such a correlation not shown. This strain was extremely resistant to the inhibitory action of almost all investigated extracts and antibiotics. The growth inhibition was only observed in the presence of WCe extract. It is difficult to explain the activity of this extract. Perhaps it is connected with a component of phenolic fraction that is rich in this extract. There was no correlation between the amount of arbutin and antibacterial activity in the extracts.
n, the number of measurements in the sample; rs, statistically significant Spearman's correlation coefficient (p<0.05).
The following conclusions can be drawn. First, the highest concentration of hydroquinone was observed in ethyl acetate extracts lower in methanol:water extracts (1:5). Second, statistical analysis showed the best positive correlation between antibacterial activity in the extracts and the content of hydroquinone in these extracts. A significant correlation between antibacterial activity in the extract and the amount of general phenolics was not observed. Third, the highest number of antiradical units (TAU515/mg) and highest amount of phenolic compounds (mgGAE/mg) were observed in ethyl acetate extracts. Finally, a higher number of antiradical units, calculated per g of raw material (TAU515/g), was demonstrated for P. communis leaves (823±84) and P. elaeagrifolia leaves (793±79), and a lower number was demonstrated for P. pyrifolia leaves (562±119).
Footnotes
Acknowledgments
This work was financially supported by a grant from Wrocław Medical University, number ST-527.
Disclosure Statement
There are no financial conflicts of interest in connection with this manuscript.