
Abstract
Eighty-two nonduplicated ampicillin-resistant Enterococcus faecium (AREF) isolates from clinical infections at the Charles Nicolle Hospital of Tunisia were investigated. They were collected from January 2001 to December 2009. Genetic relationship between them was studied using pulsed-field gel electrophoresis. The amino acid sequence difference variations of the C-terminal part of penicillin-binding protein 5 (PBP5) versus levels of expressed mRNA were investigated by polymerase chain reaction (PCR), sequencing, and real-time PCR quantification of (PBP5), respectively. No β-lactamase activity was detected and none of our strains showed resistance to glycopeptides, which retain their therapeutic efficiency against enterococcal infections in our hospital. Pattern analysis of the strains revealed six main clones disseminating in different wards. Sequence data revealed the existence of 19 different plp5 alleles with a difference in 16 amino acid positions spanning from residue 414 to 632. Each allele presented at least five amino acid substitutions (His-470→Gln, Asn-496→Lys, Ala-499→Thr, Glu-525→Asp, and Glu-629→Val). No correlation between amino acid sequence polymorphism of PBP5 and levels of ampicillin resistance was detected. The levels of plp5 mRNA expression varied between strains and did not always correlate with levels of ampicillin resistance in clinical AREF.
Introduction
E
Eighty-two unduplicated ampicillin-resistant E. faecium (AREF) isolates from clinical infections at the Charles Nicolle hospital of Tunis were investigated to determine their clonal relatedness, and then to study if specific amino acid variations in the C-terminal part of PBP5 could be correlated with the increasing MICs displayed by these strains. Expression of plp5 mRNA was also quantified by real-time polymerase chain reaction (PCR) to elucidate the relative importance of amino acid sequence differences in the C-terminal part of PBP5 versus levels of expressed pbp5 mRNA.
Materials and Methods
Bacterial strains and growth conditions
AREF were selected on the basis of their ampicillin MIC (≥16 mg/L). They were collected from January 2001 to December 2009 at the laboratory of microbiology of Charles Nicolle Hospital of Tunisia. Isolates were stored at −20°C in brain heart infusion (BHI) broth with 15% glycerol and were subcultured twice before being tested. Strains were identified as E. faecium using conventional methods, (Gram [+], catalase [−], bile-esculin [+]), and by biochemical tests using the API 20-Strep System (BioMérieux, Marcy l'Etoile, France). The species identification was confirmed using a PCR method as described by Dutka-Malen et al. 8
Antimicrobial susceptibility testing
Antibiotic susceptibility was determined by the disk diffusion method on Mueller–Hinton agar according to the Clinical and Laboratory Standards Institute guidelines (CLSI; formerly the National Committee for Clinical Laboratory Standards Institute). 3 Only the category of high-level resistance was considered for streptomycin and gentamicin. The antimicrobial agents tested were ampicillin (10 μg), gentamicin (high-level: 120 μg), streptomycin (high-level: 300 μg), tetracycline (30 μg), chloramphenicol (30 μg), ciprofloxacin (5 μg), erythromycin (15 μg), vancomycin (10 μg), teicoplanin (30 μg), and rifampin (5 μg).
Trimethoprim–sulfamethoxazole (1.25/23.75) and clindamycin (2 μg) disks were tested according to the CA-SFM (Antibiogram Committee of the French Society of Microbiology) guidelines.
Quality control was performed using the reference strain: Enterococcus faecalis ATCC 29212.
MICs of ampicillin were determined by E-test (AB Biodisk, Solna, Sweden) according to the CLSI. 3
All the isolates were tested for β-lactamase production using cefinase disk test (BioMérieux).
Pulsed-field gel electrophoresis typing
Total genomic DNA was digested with SmaI and separated by pulsed-field gel electrophoresis (PFGE) according to a previously described method 6 with some modifications; 3 ml of an overnight culture was washed thrice in 1 ml of TE1 buffer (100 mM ethylenediaminetetraacetic acid [EDTA], 10 mM Tris-HCl [pH 8.0]). The cells were resuspended in EC buffer (6 mM Tris-HCl [pH 8.0], 1 M NaCl, 100 mM EDTA [pH 8.0], 0.5% Brij 58, 0.2% deoxycholate, 0.5% N-lauroylsarcosine). A total of 250 μl of this suspension was mixed with an equal volume of 1.8% low-melting-point preparative-grade agarose and pipetted into small rectangular molds (final agarose concentration, 0.9%). The cells suspended in the agarose plugs were lysed overnight at 37°C in 1 ml of EC lysis buffer (3 mg of lysozyme per ml of EC buffer, Rnase 20 ng/ml of EC). Then, the lysis solution was replaced with 1 ml of T10E1 (10 mM Tris-HCI [pH 7.5], 1 mM EDTA) lysis solution containing proteinase K (100 μg/ml); the plug was incubated overnight at 54°C with slow shaking, then washed six times (30 min each time at 37°C) with T10E1 solution. Electrophoresis of digested fragments was carried out using a Chef Dry III apparatus (Bio-Rad Laboratories, Richmond, CA) and 1.2% agarose gel in 0.5 TBE buffer (45 mM Tris, 45 mM boric acid, and 1 mM EDTA). For the electrophoresis, the initial and final switch times were 5 and 35 sec, respectively, at 200V and 14°C for 18 hr. The gel was stained with ethidium bromide for 15 min and detained in water for 30 min. The DNA patterns were analyzed visually and with the aid of the molecular analyst GelPro software (version 3.1). The Dice coefficient of similarity was calculated. The unweighted pair-group method with arithmetic averages was used for cluster analysis. Isolates showing indistinguishable or closely related band patterns (≤6 band differences, >80% similarity) were regarded as possibly clonally related, as suggested by Tenover et al. 42
Amplification of pbp5 by PCR
DNA was extracted using Instagene Matrix (Bio-Rad Laboratories, Marnes La coquette, France). A 778-pb DNA fragment encoding the three conserved motifs and the entire 3′ terminus of PBP545 were amplified by PCR using the oligonucleotide primers, PBP5-F and PBP5-R, 28 listed in Table 1. PCR were performed in 50 μl of sample mixture containing DNA (2.5 μl), primers (50 pmol each), deoxyribonucleotide triphosphate (300 μM each), Taq DNA polymerase (2.5 U), MgCl2 (300 μM), and 10 μl of buffer. PCRs were performed in a thermal cycler (model 9700; PE Bio systems, Foster City, CA) by initial denaturation at 95°C for 5 min, followed by 35 cycles at 94°C for 30 sec, 52°C for 30 sec, and 72°C for 1 min, followed by an extension period at 72°C for 7 min. PCR products were detected on ethidium bromide-stained agarose gels.
Sequencing of pbp5
The PCR products were purified with the Qiagen PCR purification kit (Qiagen, Hilden, Germany) and sequenced twice with the same primers (Table 1) using an ABI Prism 3130 DNA Sequencer (PE Bio systems). Duplicated sequences were obtained from independent PCRs and compared with that of the pbp5 gene reference sequence (GenBank Accession No. X84860). The sequences obtained from all our isolates were also compared with published sequences of similar genes from clinical and animal isolates of AREF.
RNA extraction
Cells were grown overnight in BHI broth. The overnight cultures were diluted to 1/50 in the same medium and grown with gentle shaking and collected at the late exponential phase (3.5 hr). Then, 1 ml of each culture was centrifuged at 10,000 g at 4°C for 2 min, the supernatant was discarded, and RNA extraction isolation begun immediately using the SV total RNA isolation kit (Promega, Madison, WI).
Quantitative RT-PCR
Quantitative real-time PCR (RT-PCR) method was used for targeting pbp5 and adk (GenBank AF 443305) genes. The fluorogenic TaqMan probes were incorporated with the reporter dye, FAM, at the 5′ and the quencher dye, BHQ1, at the 3′ for pbp5 probes. The adk probes were incorporated with the reporter dye, HEX, at the 5′ and the quencher dye, BHQ1, at the 3′ (Table 1). All reactions were performed using the MiniOpticom™ System (BioRad). RT-PCR was performed using 25 μl HotStar PCR containing RNA (5 μl), primers (0.2 μM each), probe (0.1 μM), RT/Taq DNA polymerase (0.5 U), Mg2+ (4 mM), and 12.5 μl of buffer. PCR conditions included an initial preparation of cDNA at 50°C for 30 min, followed by the denaturation phase at 95°C for 5 min, then 35 cycles at 94°C for 30 sec, 52°C for 30 sec, and 72°C for 1 min were conducted, followed by an extension period at 72°C for 7 min.
Threshold values (Ct) at a constant level of fluorescence were calculated. Relative expression of plp5 mRNA was given as a ratio (R) of the quantity of pbp5 divided by the quantity of the housekeeping gene adk to normalize for varying quantities of total RNA extracted using the formula R = 2−ΔCt, where ΔCt = (Ct plp5−Ct adk).26,27
Results
Bacterial strains
Over the study period, 82 unduplicated AREF were collected. They were isolated from urine (48%), blood (24%), pus (27%), and catheter (1%). Strains were recovered from infected patients hospitalized in pediatrics (n = 20), intensive care unit (n = 19), medicine (n = 18), surgery (n = 17), urology (n = 5), orthopedics (n = 1), gynecology (n = 1), and oto-rhino-laryngology (n = 1).
Antimicrobial susceptibility testing
All our strains exhibited associated resistance to tetracycline (60%), chloramphenicol (3.7%), ciprofloxacin (100%), trimethoprime–sulfamethoxazole (74.4%), erythromycin (100%), and rifampin (100%). Fifty-eight (71%) and 41 (50%) strains were, respectively, highly resistant to streptomycin and gentamicin (Table 2). No resistance to glycopeptides (vancomycin and teicoplanin) and no β-lactamase production were detected.
AREF, ampicillin-resistant Enterococcus faecium; CH, chloramphenicol; CIP, ciprofloxacin; CM, clindamycin; ERY, erythromycin; GEN, gentamicin; RA, rifampin; STR, streptomycin; SXT, trimethoprim–sulfamethoxazole; TET, tetracycline.
PFGE typing
Forty-six different PFGE patterns (Fig. 1) were revealed with 10 majority patterns named P1 to P10 (Table 3). P1 harbored 12 closely related strains (over 84% of percent similarity), 5 of them have caused nosocomial infections in patients hospitalized in the intensive care unit, 4 in the surgical department, 2 in medicine, and 1 in pediatrics. P2 included seven isolates; P3, six isolates; P4, five isolates; P5, four isolates; P6, three isolates; and P7, P8, P9, and P10, two isolates each. The rest of the isolates were unrelated (Fig. 2).
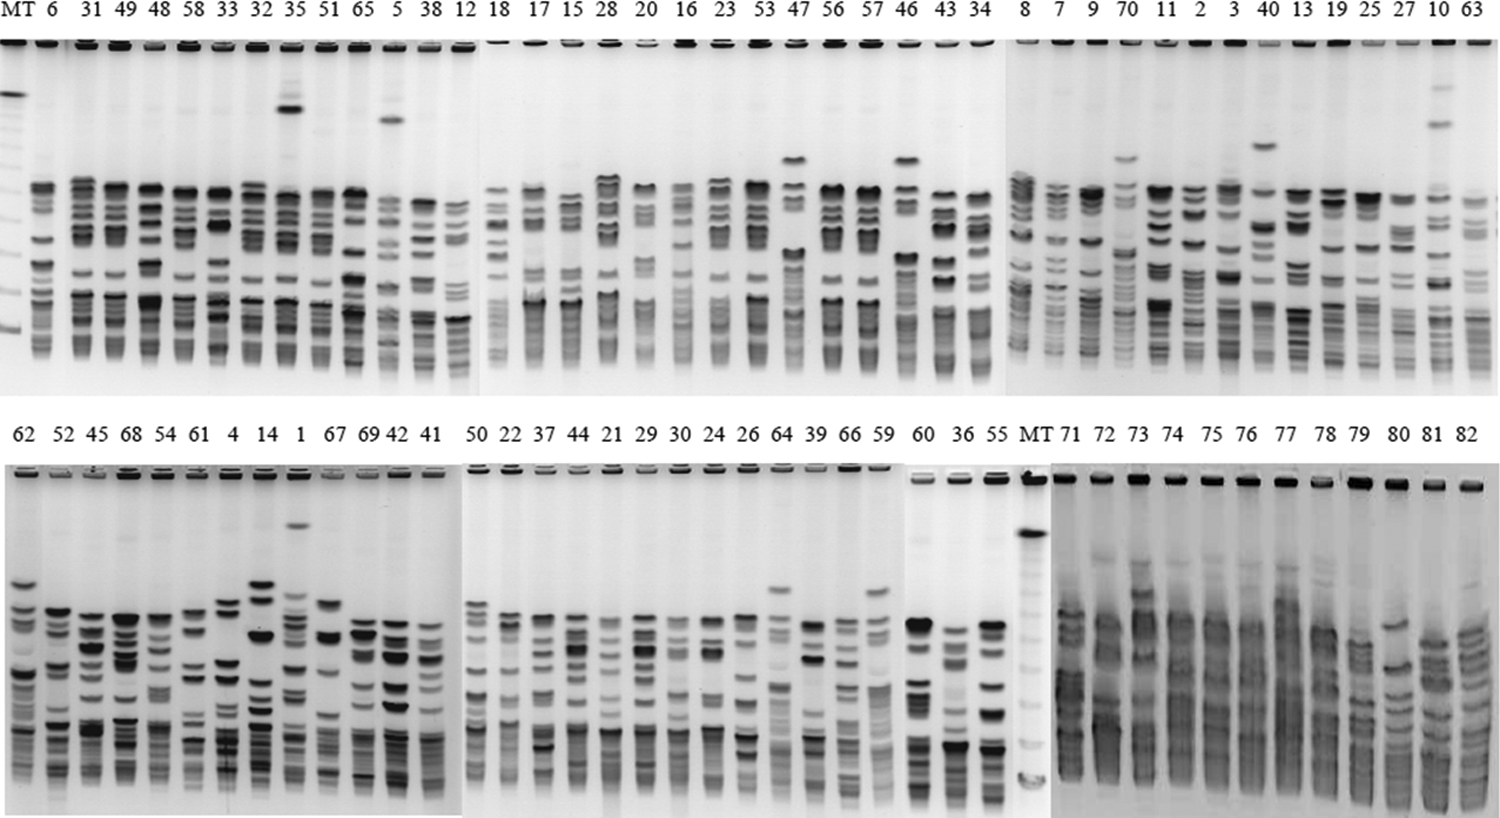
SmaI macrorestriction patterns of 82 strains of AREF. AREF, ampicillin-resistant Enterococcus faecium; MT, lambda ladder.
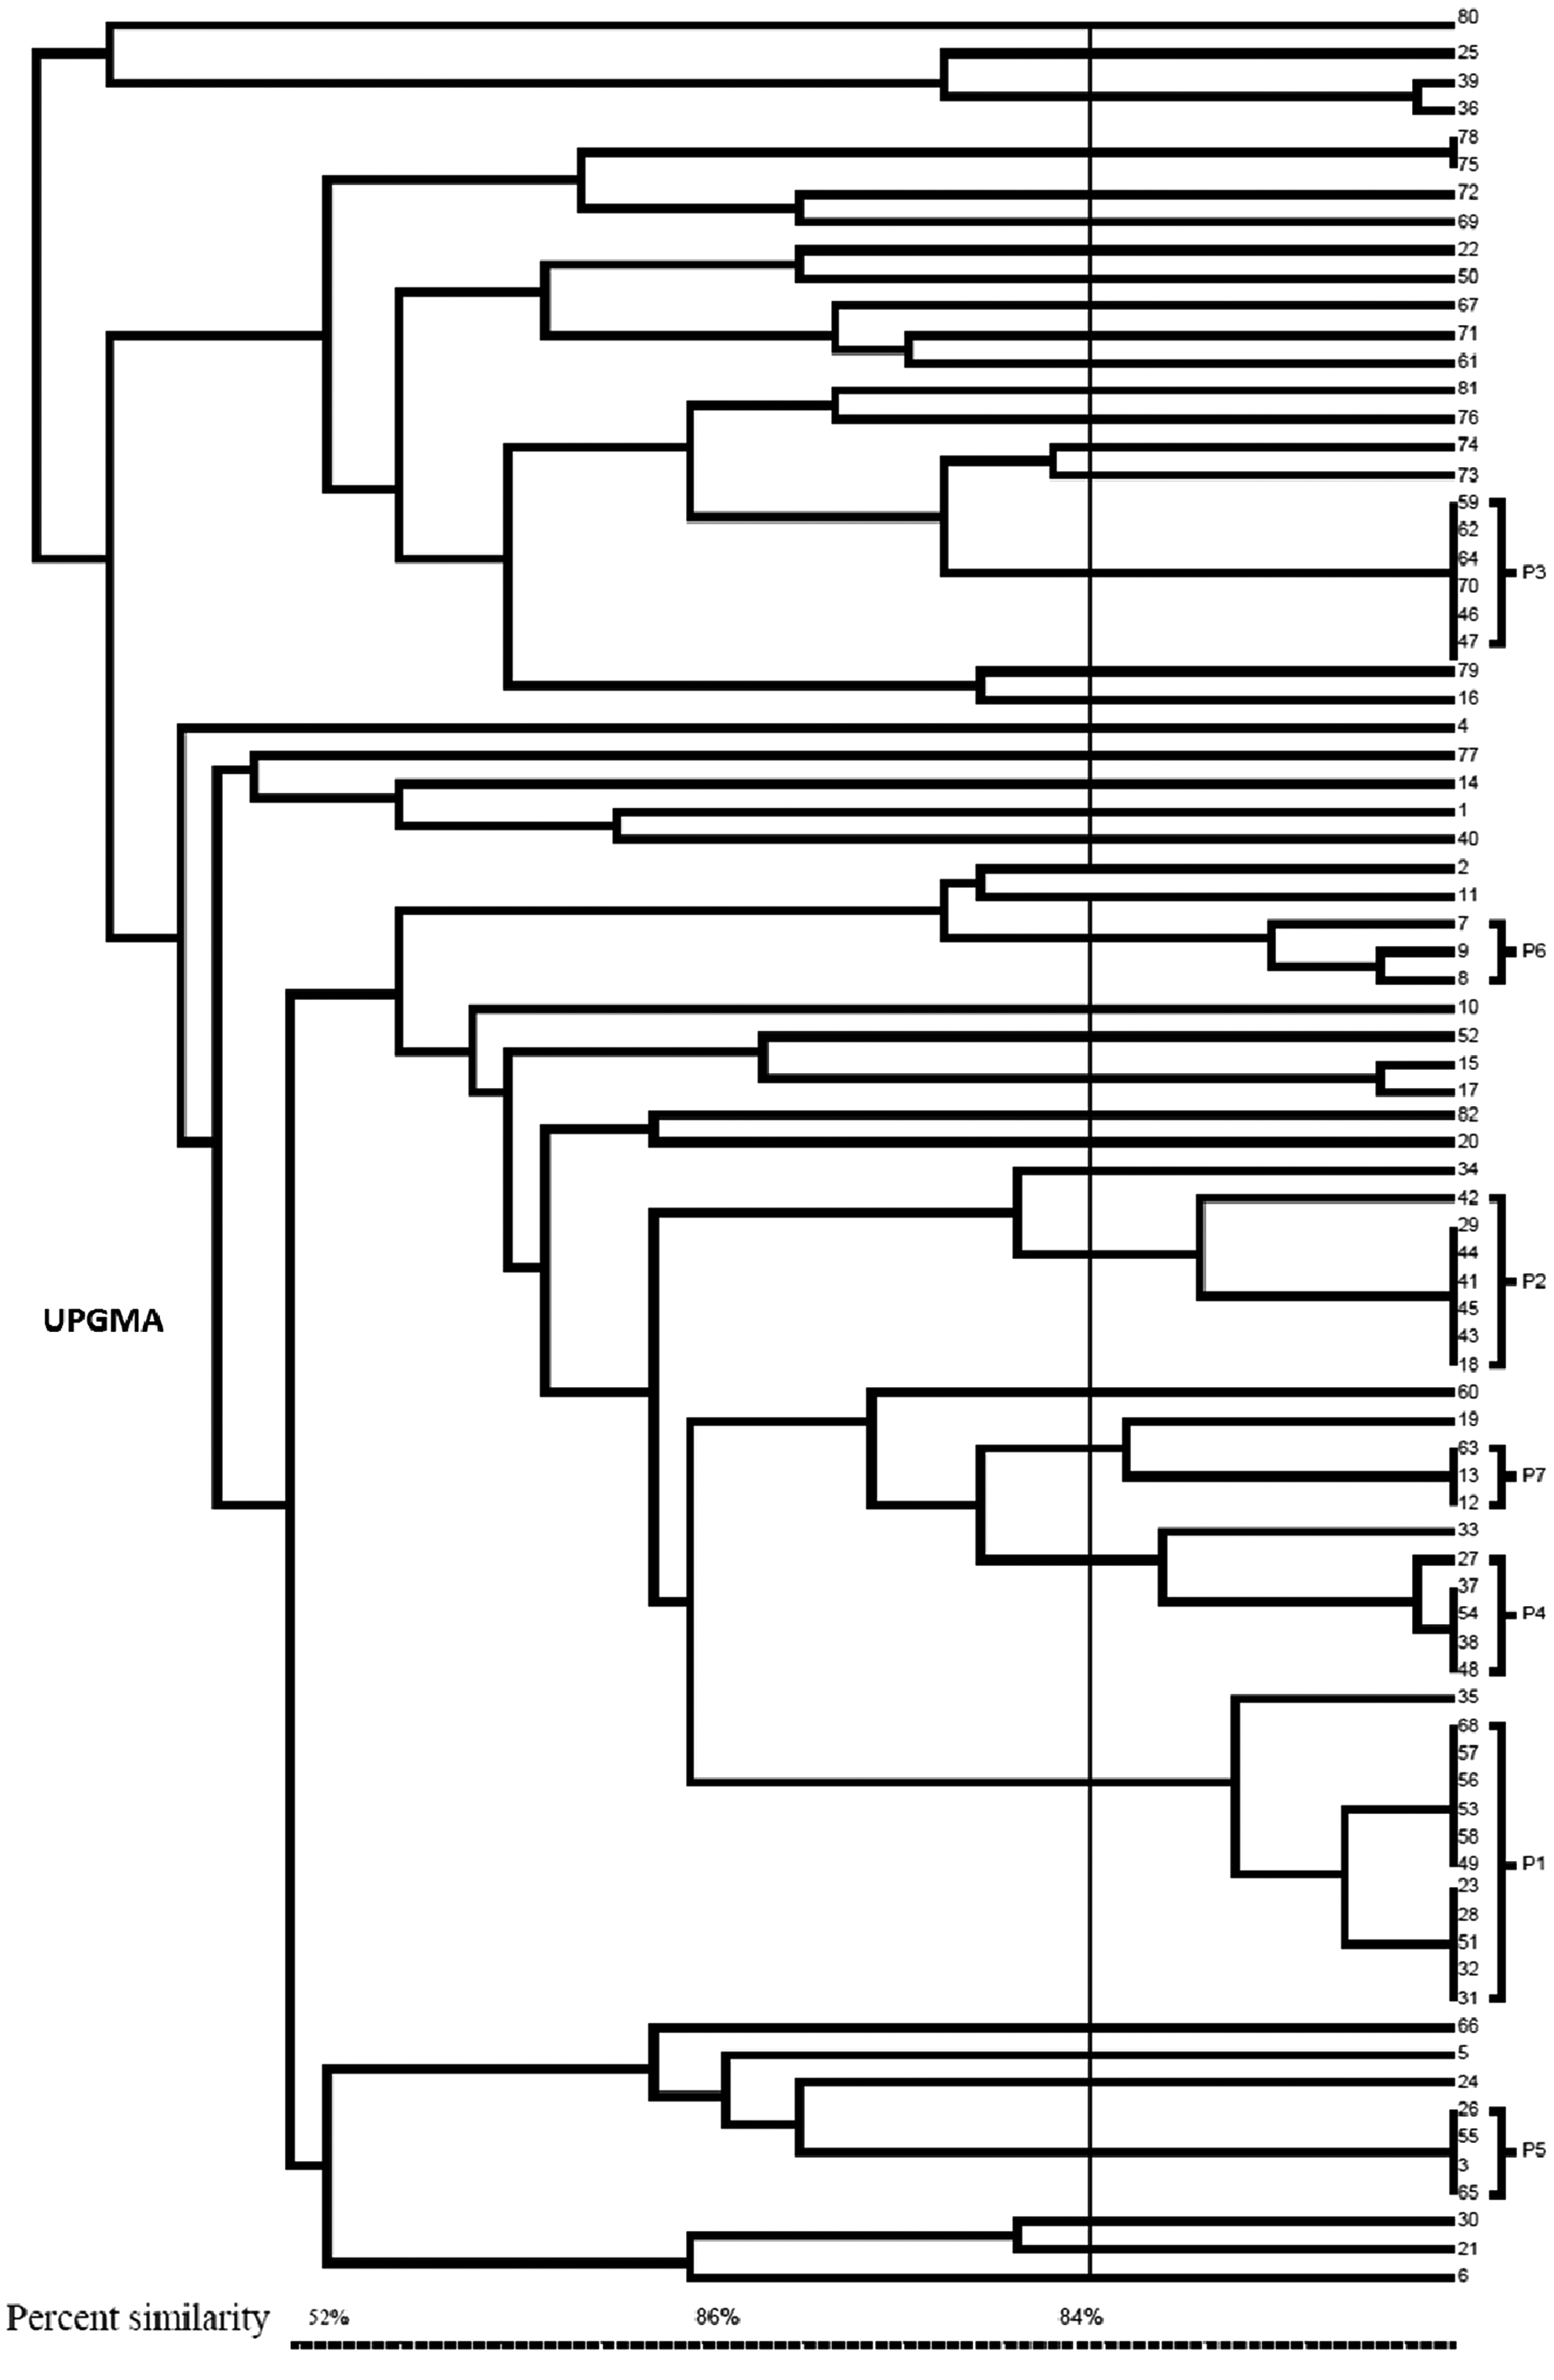
Dendrogram of SmaI-digested genomic DNA from AREF.
No insertion.
pbp5 mRNA Expression levels as measured by real-time PCR (see Quantitative RT-PCR section).
Alleles were designated A1–A19 based on amino acid substitutions.
Amino acid changes with respect to reference sequence (GenBank Accession No. 84860).
ICU, intensive care unit; GYN, gynecology; MED, medicine; MIC, minimum inhibitory concentration; ORL, oto-rhino-laryngology; ORT, orthopedics; PCR, polymerase chain reaction; PED, pediatrics; SUR, surgery; URO, urology.
pbp5 Alleles
Sequence heterogeneity at the 3′ end of the pbp5 gene determined for the 82 isolates was correlated with their specific ampicillin MIC values. Nineteen alleles were with a difference in 18 amino acid positions spanning from residue 414 to 632 of PBP5, designated here as A1→A19 (Table 3). Each allele presented at least five amino acid substitutions. Thirteen isolates harbored a serine insertion and three isolates harbored an aspartic acid insertion just after Ser-466 (GenBank Accession No. X84860) with a level of ampicillin resistance varying between 24 and >256 mg/L. Ninety-one isolates (not EF27841) had an Ala or a Thr at position 485. Allele A4 showed seven mutations (Gln-461→Lys, His-470→Gln, Met-485→Ala, Asn-496→Lys, Ala-499→Thr, Glu-525→Asp, and Glu-629→Val). It was the most frequent allele in our study (29 isolates, with MICs 24 to >256 mg/L). The three new mutations (Thr-416→Ala, Val-462→Ala, and Phe-497→Ile) were also observed in seven alleles (A1, A3, A7, A10, A11, A12, and A13), in two isolates with moderate resistance level to ampicillin (MIC = 64 mg/L) and 25 isolates with high ampicillin resistance level (MIC ≥ 256 mg/L). The substitution Gly-582→Ser was observed in nine isolates.
Real-time PCR
The amounts of the pbp5 and adk mRNA expression varied considerably among the isolates with a sixfold difference between the least to the most expressed. The ratio R = 2–(Ct pbp5−Ct adk) of relative expression of plp5 mRNA varied from 0.007 to 15,286 among the isolates and did not appear to correlate with their specific ampicillin MIC values (Table 3).
Discussion
In recent years, E. faecium has been recognized not only as a significant cause of nosocomial infections, commonly urinary tract infections, but also abdominal and surgical wound infections and bacteremia. High frequency of AREF has also been reported in many countries.20,21,33 They mainly caused serious infections. In our study, AREF were recovered from different wards, especially from surgery. They were responsible for several infections as urinary tract infections (48%) and bacteremia (24%). The combination of an aminoglycoside with a glycopeptide is used to treat these infections because of its synergic bactericidal effect. However, strains that are highly resistant to aminoglycosides are no longer susceptible to this combination therapy.15,29,43 In our study, 50% and 71% of strains were highly resistant to gentamicin and to streptomycin, respectively. A higher resistance rate to streptomycin than to gentamicin was also reported. 12 Resistance to glycopeptides has been found in many parts of the world4,7,9,22,40 and recently in Tunisia. 1 None of our strains showed resistance to these important drugs, which retain their therapeutic efficacy against enterococcal infections in our hospital. All our strains were resistant to ciprofloxacin, rifampin, and erythromycin; a similar association has previously been reported.16,41 Periodic evaluation of local epidemiology of antibiotic resistance in E. faecium is required for empirical treatment planning and early detection of changes in their patterns.
A number of nosocomial outbreaks due to AREF have been reported.16,31 To know whether there was a clonal spread of AREF at the Charles Nicolle Hospital, PFGE, a highly discriminatory method, was used. 23 The analysis of PFGE profiles showed six main patterns (over three isolates) accounted for 47.5% of isolates disseminating in different wards. The largest group, P1, contained 12 isolates; 9 of them were recovered from the surgical department. All have the same antibiotic resistance pattern. They were resistant to ciprofloxacin, erythromycin, and rifampin and showed a high level of resistance to gentamicin and streptomycin. They were highly resistant to ampicillin, with MIC ≥ 64 mg/L. The rest of the isolates were grouped into nonrelated patterns with no specific clone disseminating throughout the hospital. These findings suggested that clonal spread has occurred in the surgical ward that required the reinforcement of hygiene measures. An earlier study suggested that previous administration of β-lactams and urinary catheterization were the two major risk factors for ampicillin resistance in E. faecium. 16
The high level of ampicillin resistance in E. faecium may be due to either increased production of PBP545 or PBP5 with several polymorphisms in amino acid positions in the vicinity of conserved regions conferring lowered affinity of PBP5 to ampicillin.24,25,36,45 Specific amino acid changes in the C-terminal region of PBP5 that were thought to be the cause of high-level resistance include an additional serine after amino acid position 466 (Ser-466′), Met-485→Ala/Thr, and Glu-629→ Val. The Ser at position 466′ is located in a loop that forms the other edge of the active site. It might slightly displace Val 465 inside the active site and therefore affect the substrate recognition. 38 Insertion of additional serine Ser-466′ has been found among all highly resistant strains of animal isolates (MIC ≥128 mg/L). 32 In this study, Ser-466′ was found in 13 isolates; 7 highly resistant isolates with MIC ≥ 256 mg/L, 2 isolates with MIC = 128 mg/L, 3 isolates with MIC = 64 mg/L, and also in 1 moderate-level resistant stain with an MIC of 48 mg/L. Two isolates harboring an aspartic acid insertion just after Ser-466 in both low-level and high-level ampicillin-resistant strains indicated that there is no absolute association between these changes and resistance level. Ser-466′ insertion, frequently associated with a high ampicillin-resistant level, 28 and Asp-466′ were found only in resistant isolates, whether there was serine or aspartic acid at this position did not seem to correlate with specific increases in MICs. These findings were further supported by Galloway-pena et al. 13 The most important amino acid substitution associated with high-level resistance to ampicillin was Met-485→Ala/Thr, located three amino acids after the SDN triad.36,45 However, no change of methionine at position 485 was observed in isolate (EF27841) with an MIC of 42 mg/L. Position 485 is located inside the active site very close to the active site at position 422, the residue that is acylated by β-lactams. This substitution should be expected to have strong effects. 36 Although the mutation Met-485→Ala seems to be important for ampicillin resistance, it has been demonstrated that this substitution by itself does not confer high-level ampicillin resistance.32,39
It was clearly demonstrated that any individual mutation by itself could not confer a high level of ampicillin resistance. 39 Earlier studies showed that the combined effects of the above four mutations (Met-485→Ala/Thr, Ala-499→Thr, and Glu-629→Val accompanying a serine insertion after position 466) result in high-level ampicillin resistance regardless of the level of PBP5 expression. 34 Most of the substitutions occur around the active site region of PBP5. The exception is position 499, which is quite distant from the active site. The replacement of Glu by Val at position 629 may have consequences for the dynamic conformation of the loop, and by restricting mobility, it may decrease the ability of the protein to bind to β-lactams. 38 It is chosen as an ampicillin resistance marker. 28 Val at position 629 was found in all our strains with different MICs, indicating that there is no absolute association between this mutation and high-level resistance. Multiple mutations are required, however, their effects are not simply additive, but same mutations amplify the effect of others. 34
In contrast to the findings of Rybkine et al. 36 and Ligozzi et al. 25 for E. faecium 9439, in which changes at amino acid residues 426,562, and 574 have been reported, no substitution was found at these positions of resistant strains in our study. PBP5 of our strains presented at least five amino acid substitutions (His470→Gln, Asn-496→Lys, Ala-499→Thr, Glu-525→Asp, and Glu-629→Val) previously described,32,36,45 which could explain their resistance to ampicillin. They were detected in all our strains, both low-level and high-level ampicillin resistant, and have not previously been associated with increased ampicillin MICs by other authors. 19 The three new mutations (Phe-497→Ile, Thr-416→Ala, and Val-462→Ala) previously described 2 were also observed in 16 strains, with five different alleles.
A previous report suggested that strains moderately resistant to ampicillin (MICs 16–64) overproduced PBP5 with unmodified affinity for penicillin and strains with a high level of resistance produced PBP5 with decreased affinity.36,45 Studies of clinical isolates expressing ampicillin resistance showed that increased production of PBP5 was not the most common mechanism for increased resistance.17,24 In our experiment, we found that mRNA quantities varied between strains and did not always correlate with levels of ampicillin resistance or amino acid sequence polymorphism, which could explain why strains with identical alleles and the same mRNA quantity expressed different levels of resistance to ampicillin. These findings are in line with other studies.18,35
Conclusion
In conclusion, specific pbp5 point mutations, levels of plp5 mRNA expression, and quantities of relative plp5 transcripts varied between strains and did not entirely explain the difference in levels of ampicillin resistance in our strains. The mechanisms of ampicillin resistance are more complex than expected. Therefore, further studies of mechanisms of ampicillin resistance in clinical isolates of E. faecium are needed.
Footnotes
Acknowledgments
This work was financially supported by the Ministry of Scientific Research and Technology of Tunisia. The authors are very grateful to I. Abderrazek and S. Ezaier for their English review of the manuscript.
Disclosure Statement
No competing financial interests exist.