
Abstract
Flavobacterium psychrophilum is a serious pathogen of salmonids worldwide, a matter that is compounded by the lack of effective vaccine preparations. As a result, biosecurity measures and antimicrobial agents remain the only available methods to control diseases caused by F. psychrophilum. It is feared that antimicrobial use may have led to the development of F. psychrophilum strains with reduced susceptibility. Therefore, the primary objective of this study was to determine the antimicrobial susceptibility profiles of 50 F. psychrophilum isolates from Michigan in response to 10 antimicrobial compounds. As recommended by the Clinical and Laboratory Standard Institute and the World Organization of Animal Health, a standardized microdilution broth assay was employed to determine the minimum inhibitory concentrations (MICs) for ampicillin (AMP), gentamicin (GEN), enrofloxacin (ENRO), oxolinic acid (OXO), flumequine (FLUQ), trimethoprim–sulphamethoxazole (SXT), ormetoprim–sulphadimethoxine (PRI), erythromycin (ERY), florfenicol (FFN), and oxytetracycline (OXY). Epidemiological cutoff values were calculated using the normalized resistance interpretation (CONRI) and the ECOFFinder analysis methods (COECOFF). The MIC distributions in response to OXY exhibited bimodality, indicating the presence of isolates with reduced susceptibility in addition to the wild-type isolates. The OXY epidemiological cutoff values (COECOFF <0.06 μg/ml; CONRI <0.12 μg/ml) demonstrated that 24% of Michigan isolates exhibited reduced susceptibility to this commonly used drug. No other antimicrobial exhibited a bimodal distribution of MICs. This study represents the first antimicrobial susceptibility assessment of F. psychrophilum strains recovered from Michigan and contributes valuable data to the worldwide validation efforts to determine universal epidemiological cutoff values of this deadly fish pathogen.
Introduction
T
The intense use of antimicrobial agents in the ever-growing aquaculture industry is believed to have played a key role in the emergence of fish pathogenic bacterial strains with reduced antimicrobial susceptibility.8,10 Over the past decade, there have been reports of reduced susceptibility to antimicrobials by F. psychrophilum strains from Europe, Chile, and Canada;11–14 however, there is little information currently available on antimicrobial susceptibility of F. psychrophilum in the United States in general and the Great Lakes basin (GLB) in Michigan, in particular. This constitutes a void in our knowledge since salmonid populations in Michigan are known to be widely and heavily infected with F. psychrophilum, and Michigan aquaculture facilities frequently rely on antimicrobial treatments to control these infections. 2 Therefore, the first objective of this study was to investigate the antimicrobial susceptibility profiles of F. psychrophilum isolates from the section of the GLB within Michigan.
The variation in methods used to assess antimicrobial susceptibility of bacterial pathogens and the inability to directly compare results led Alderman and Smith 15 to propose tentative standardized methods that were based upon those developed by the Clinical and Laboratory Standard Institute (CLSI). After further research and multilaboratory standardization trials,16–19 CLSI developed guidelines to ensure that antimicrobial susceptibility profiling of aquatic bacterial pathogens, including F. psychrophilum, are performed in a standardized manner.19–21 The use of these methods is also advocated for by the World Organization for Animal Health (OIE). These optimized microdilution broth assays generate data necessary to establish epidemiological cutoff values that can be used to interpret bacterial susceptibility and identify the potential risk of antimicrobial resistance to salmonid populations. A major reason for the lack of universally approved F. psychrophilum-specific epidemiological cutoff values is the limited data available for accurate calculations.20,22
To this end, we built upon the studies of Smith et al. 22 performed by two European laboratories following CLSI guidelines20,21 to calculate epidemiological cutoff values from Michigan F. psychrophilum minimum inhibitory concentration (MIC) data and compared these results to the currently proposed values. The generated data of this study are important in the validation of epidemiological cutoff values that can be internationally adopted.
Materials and Methods
F. psychrophilum collection and identification
A total of 50 F. psychrophilum isolates originating from the GLB and previously described by Van Vliet et al. 23 were assessed. Isolates were recovered from six locations and three fish host species (Table 1). A portion of the fish examined exhibited gross disease signs commonly associated with BCWD (e.g., skin/muscle ulceration, fin erosion, exophthalmia, and/or swollen internal organs); however, occasionally isolates were recovered from apparently healthy fish. Epidemic isolates refer to isolates that were collected during periods of morbidity and/or mortality characteristic of BCWD. All isolates were confirmed as F. psychrophilum as previously described by Van Vliet et al. 2 Multilocus sequence typing (MLST) has been conducted on all 50 GLB F. psychrophilum isolates 23 A total of 22 sequences types (STs) were shown to exist among the 50 isolates in this study, and in particular, ST78 has been associated with isolates recovered during BCWD outbreaks (Table 1).
Isolate IDs with * indicate F. psychrophilum recovery during times of morbidity/mortality characteristic of bacterial cold water disease.
Isolate IDs with + indicate F. psychrophilum recovery from fish within a hatchery. Remaining isolates were recovered from feral fish.
Isolates recovered from the same fish marked with the same superscript letter.
GLB, Great Lakes basin; LMRW, Little Manistee River Weir; OSFH, Oden State Fish Hatchery; PRW, Platte River Weir; SRW, Swan River Weir; ST, sequences type; TSFH, Thompson State Fish Hatchery; WLSFH, Wolf Lake State Fish Hatchery.
Antimicrobial agents
The MICs of 10 drugs were assessed using custom-designed Sensititre susceptibility plates (Trek Diagnostic Systems, Oakwood Village, OH) prepared with dilute cation-adjusted Mueller Hinton broth (DCAMHB; 4 g/L). The 96-well plates contained twofold serial dilutions of either 7 or 10 concentrations of antimicrobials from multiple drug classes (Figs. 1 and 2). Tetracyclines were represented by OXY (0.015–8 μg/ml), phenicols were represented by FFN (0.03–16 μg/ml), and sulphonamides/potentiated sulphonamides were represented by ormetoprim–sulphadimethoxine (PRI; 0.008/0.15–4/76 μg/ml) and trimethoprim–sulphamethoxazole (SXT; 0.015/0.3–1/19 μg/ml). All of the aforementioned drugs are approved for aquaculture use in North America (USFWS AADAP; Canadian Food Inspection Agency, CFIA). Due to the common practice of extra-label use of erythromycin (ERY) under the direction of a veterinarian in aquaculture, this antimicrobial compound was used to represent the macrolide drug class (ERY; 0.25–128 μg/ml). Quinolones/fluoroquinolones were represented by oxolinic acid (OXO; 0.004–2 μg/ml), flumequine (FLUQ; 0.008–4 μg/ml), and enrofloxacin (ENRO; 0.002–1 μg/ml). Aminoglycosides were represented by gentamicin (GEN; 0.06–4 μg/ml) and aminopenicillins were represented by ampicillin (AMP; 0.03–164 μg/ml).
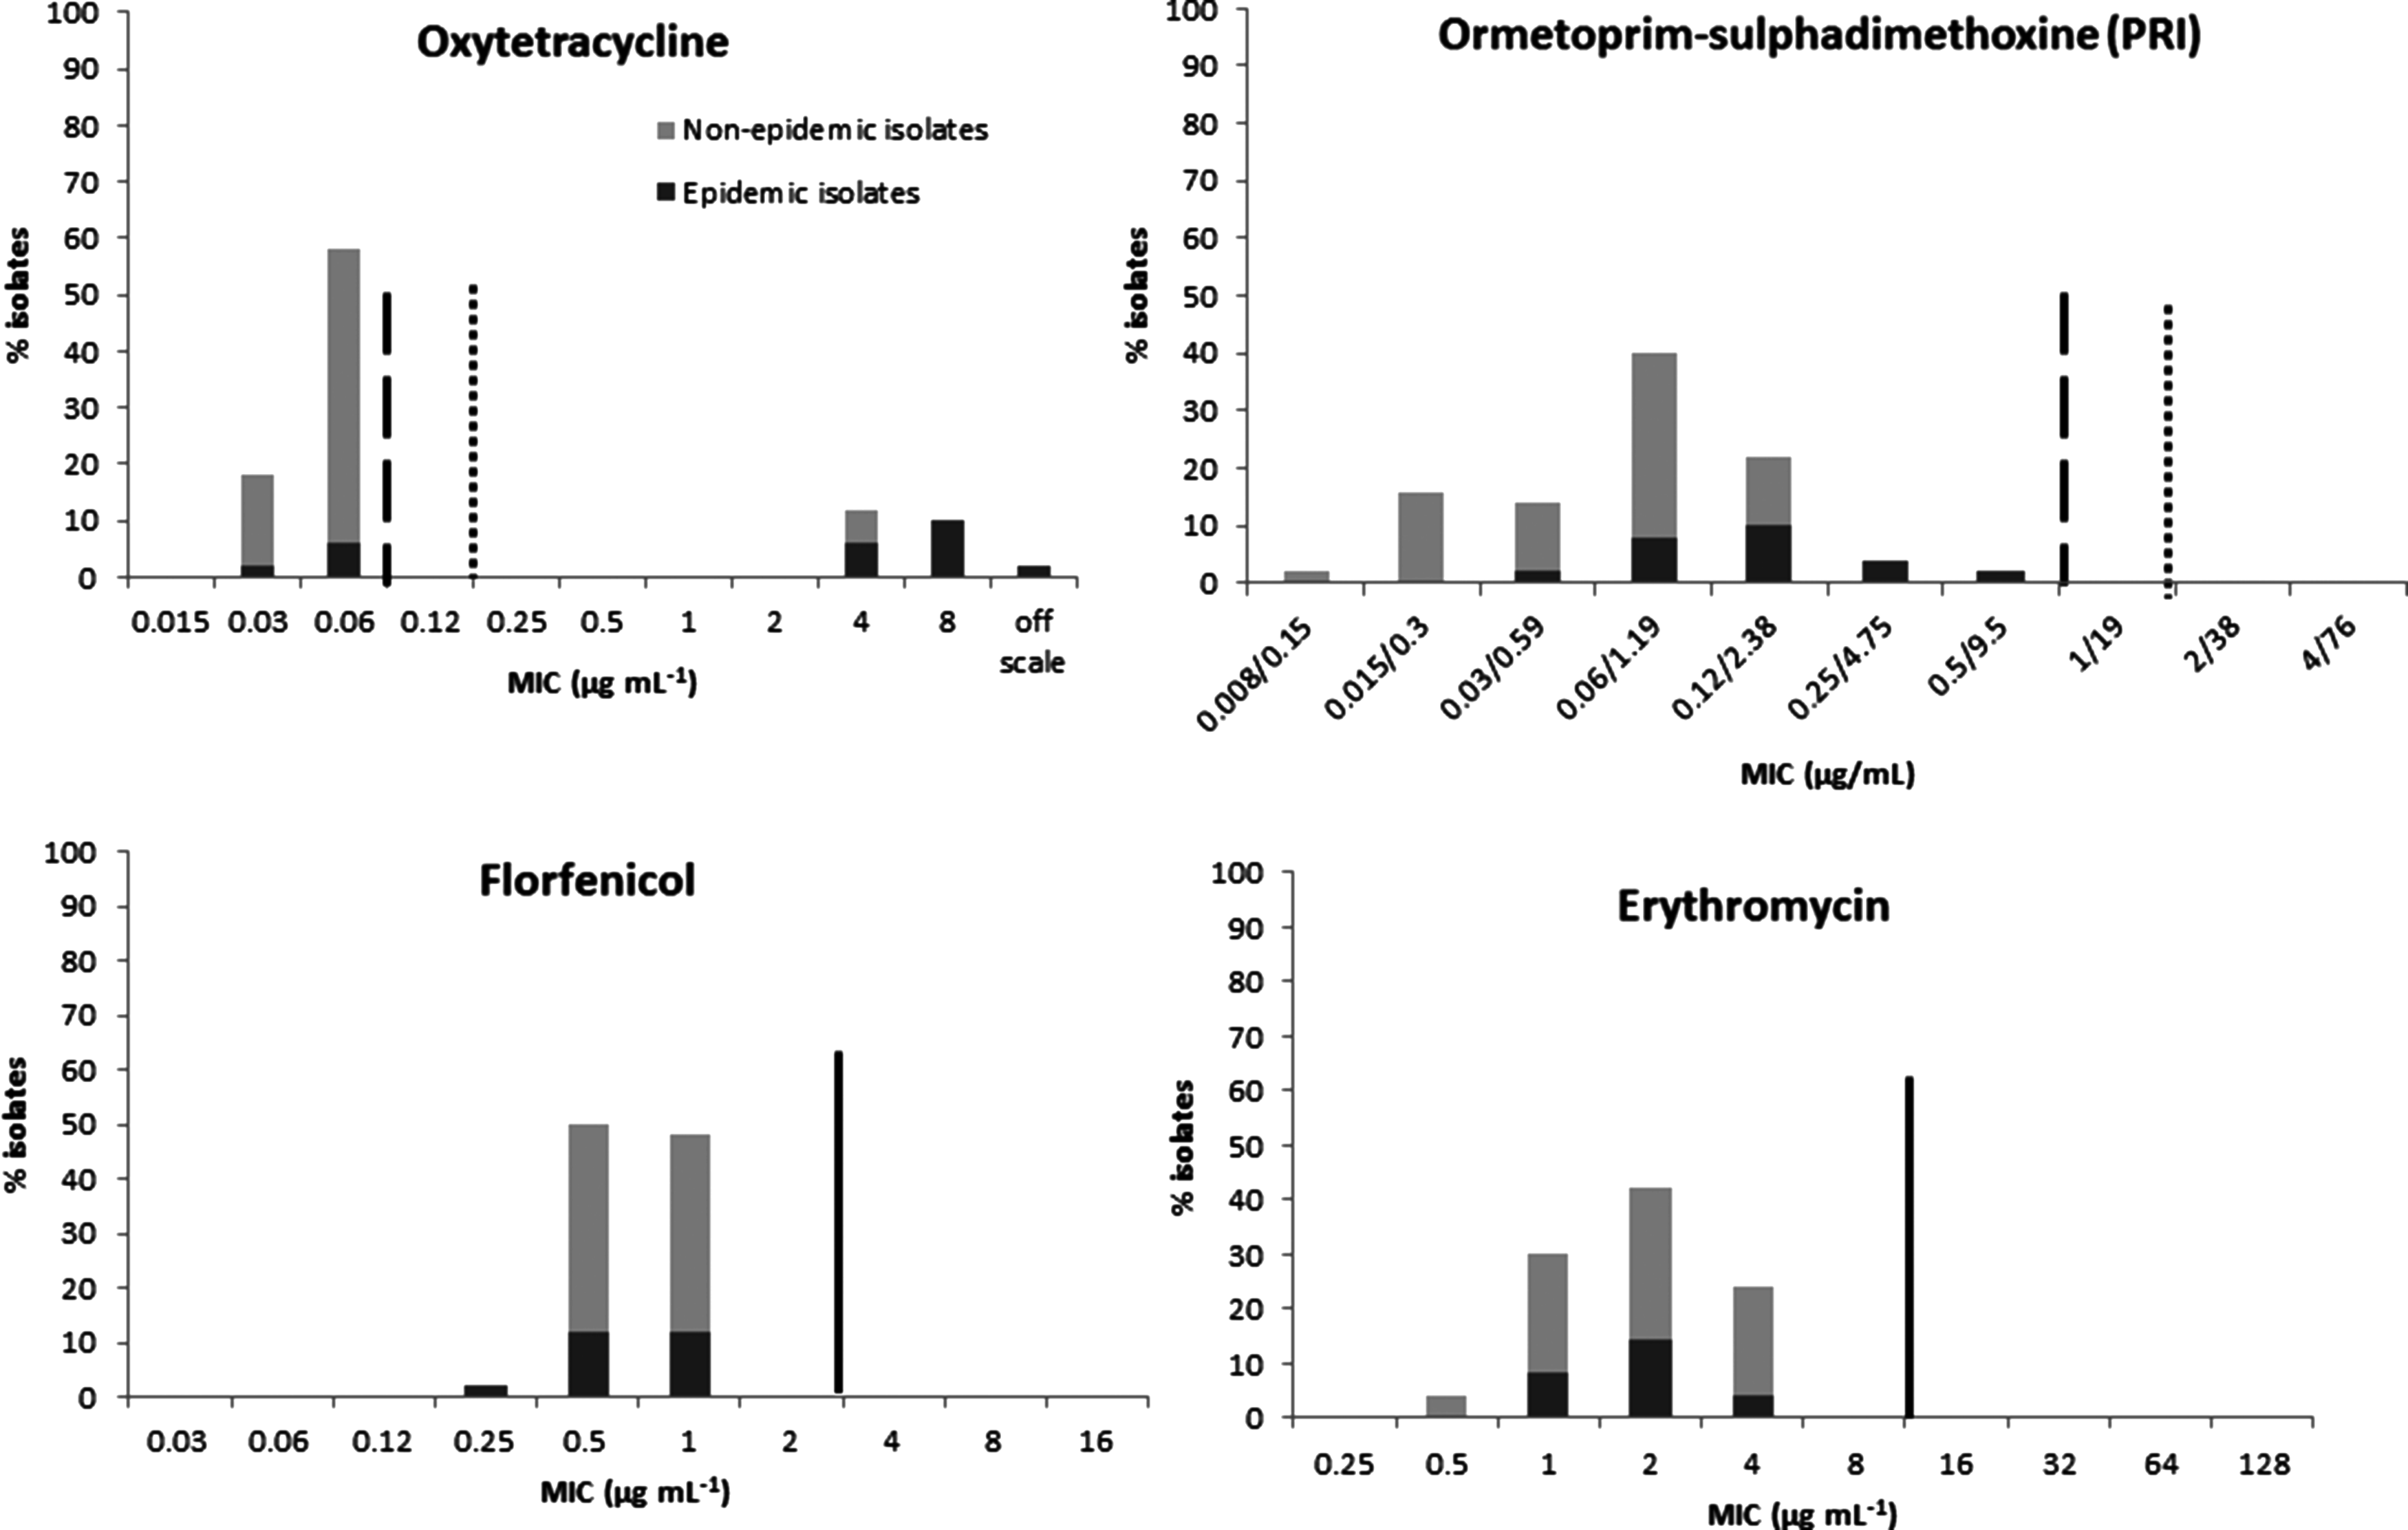
The distribution of Flavobacterium psychrophilum isolates (%) according to determined MICs for four antimicrobial compounds frequently used in Great Lakes basin aquaculture. Dotted lines represent epidemiological cutoff values calculated by the national resistance interpretation method (CONRI), dashed lines represent epidemiological cutoff values calculated by the ECOFFinder analysis (COECOFF), and solid lines represent epidemiological cutoff values that were of the same result from both methods. MICs, minimum inhibitory concentrations; NRI, normalized resistance interpretation.
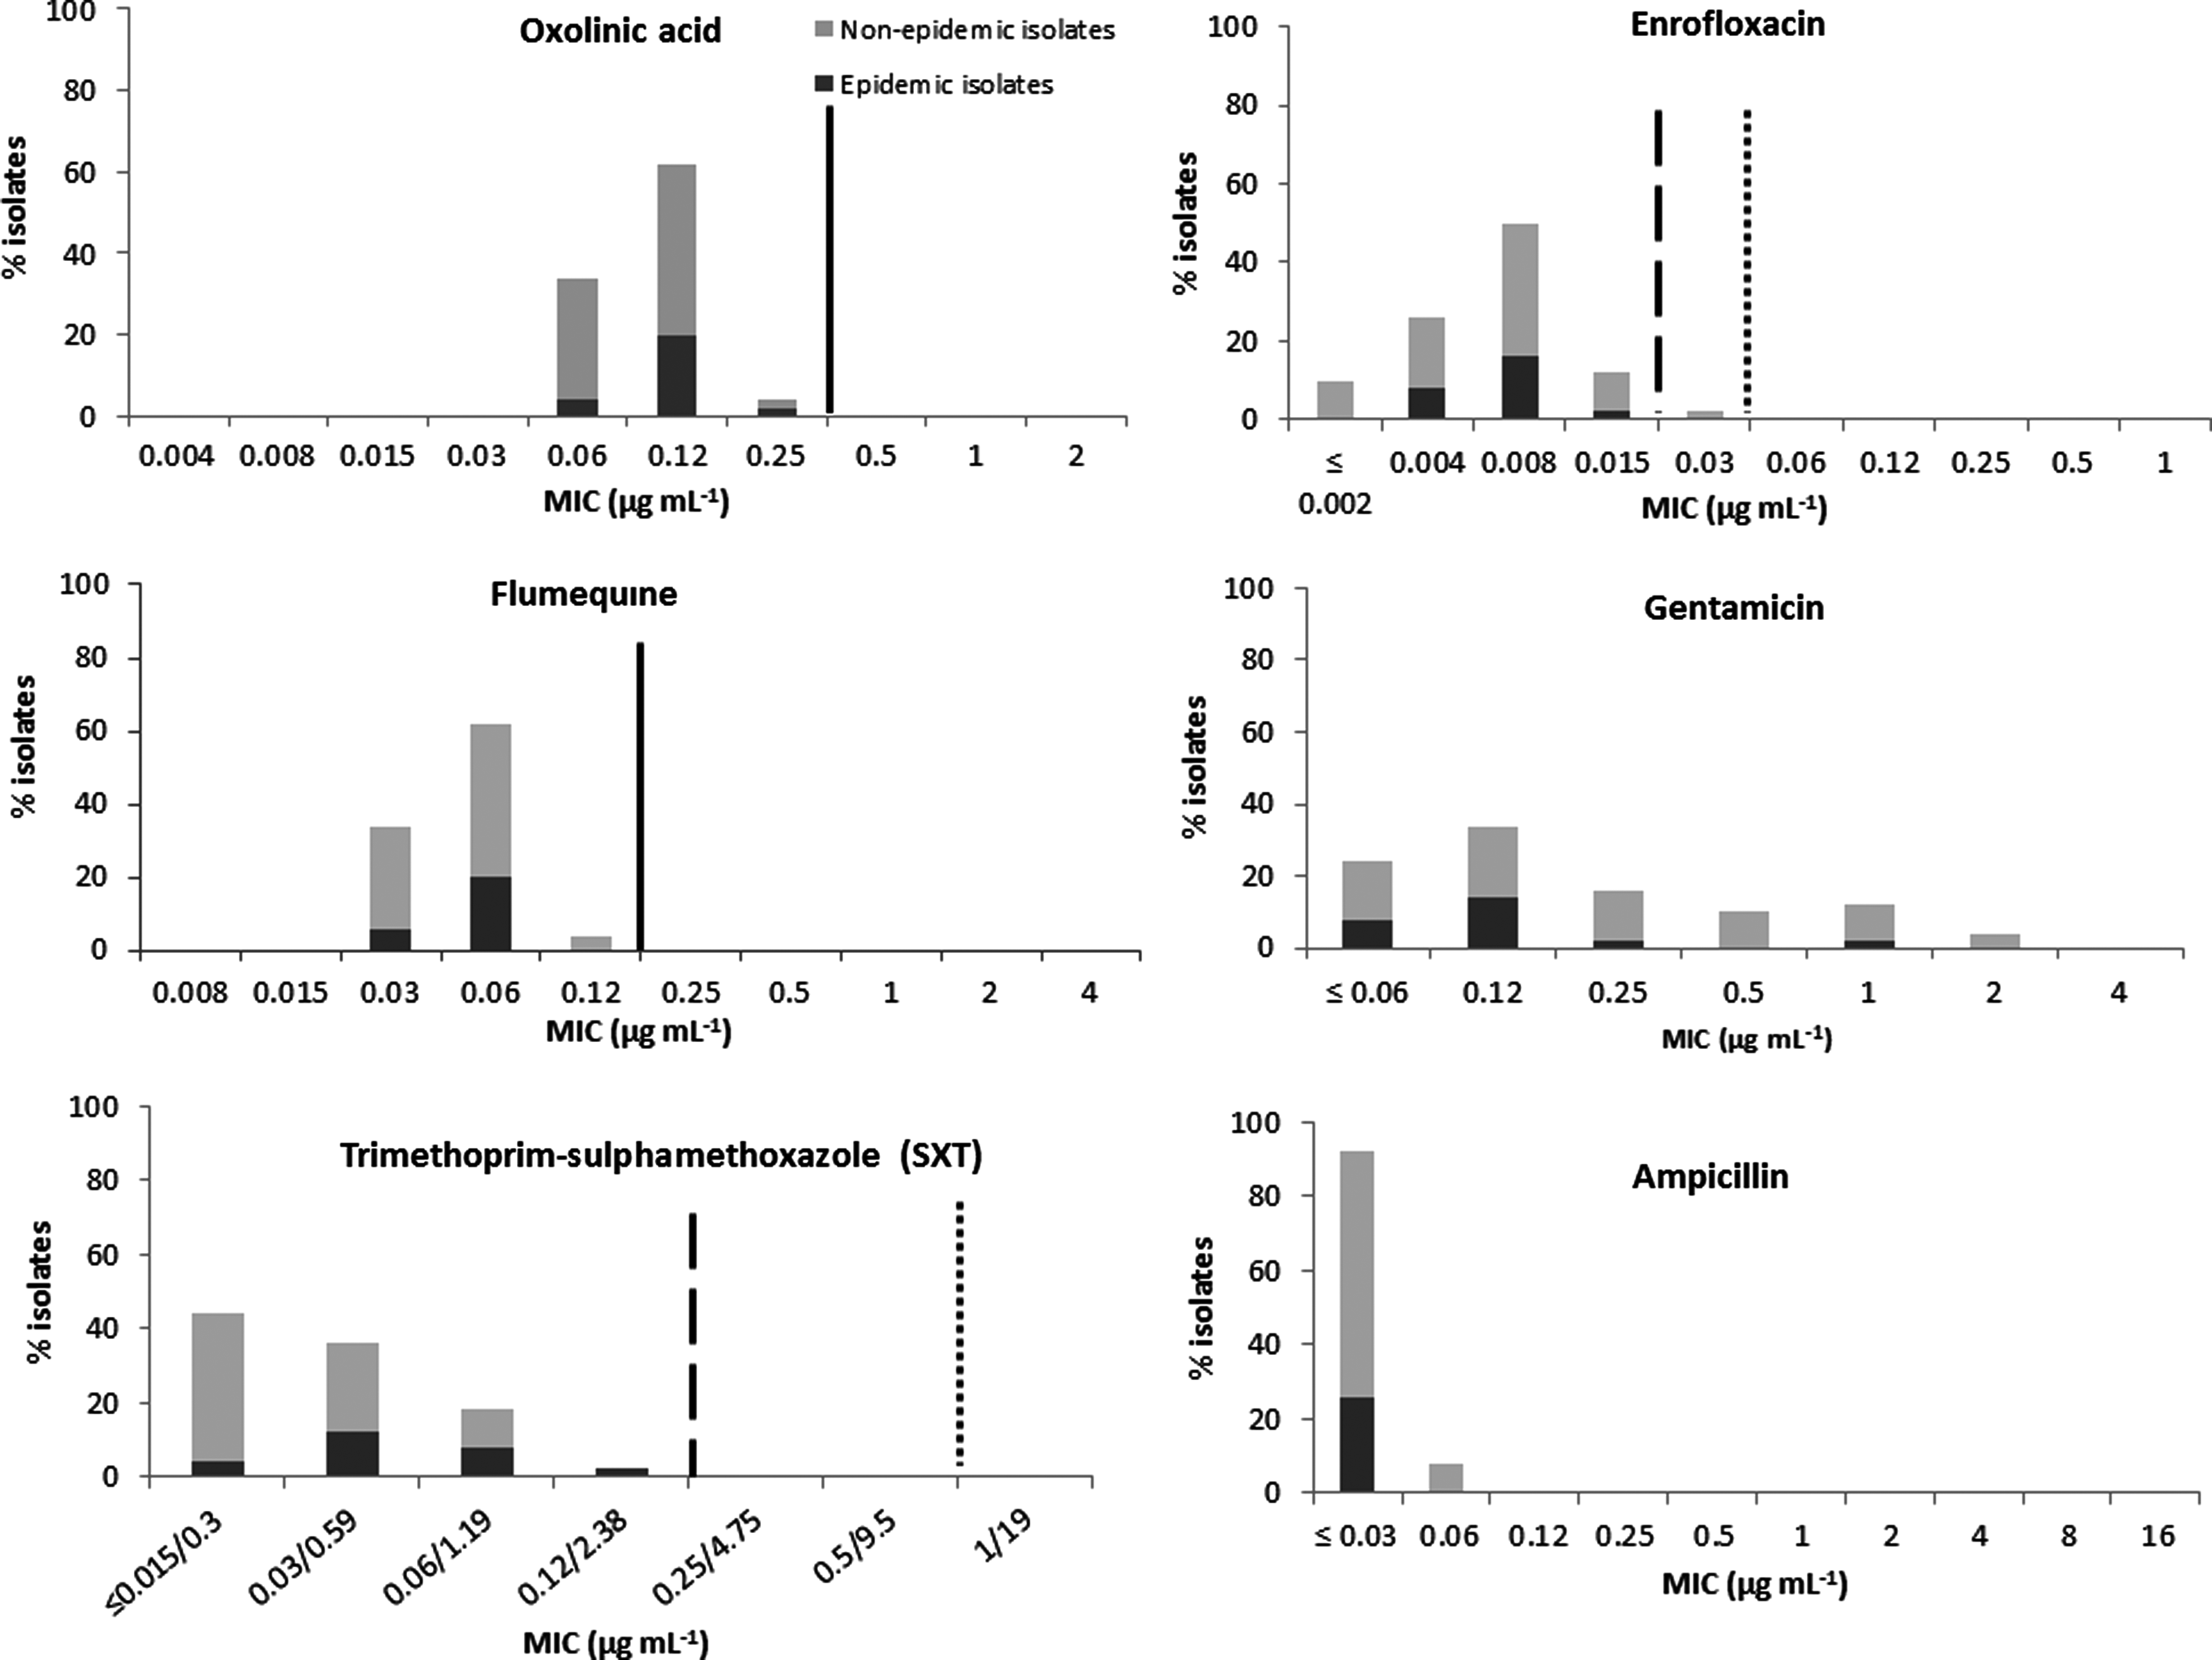
The distribution of Flavobacterium psychrophilum isolates (%) according to determined MICs for six antimicrobial compounds that are not approved for use in U.S. aquaculture. Dotted lines represent epidemiological cutoff values calculated by the national resistance interpretation method (CONRI), dashed lines represent epidemiological cutoff values calculated by the ECOFFinder analysis (COECOFF), and solid lines represent epidemiological cutoff values that were of the same result from both methods. Epidemiological cutoff values could not be calculated for gentamicin or ampicillin results.
Broth dilution preparation
All broth dilution preparations were performed according to CLSI 20 in a sterile hood. Briefly, F. psychrophilum isolates were revived from cryogenically frozen stock on fresh tryptone yeast extract salts (TYES 24 ) plates and incubated at 18°C for 72–96 hours. Isolates were subcultured in 5 ml of fresh TYES broth and grown statically at 18°C for 72 hours. The suspensions were then adjusted to a 0.5 McFarland standard turbidity equivalent with the addition of sterile 0.85% saline solution. An aliquot of the suspension (220 μl) was then transferred to 11 ml of sterile DCAMHB (Becton, Dickson Company, Franklin Lakes, NJ), vortexed, and 50 μl inoculated into 96-well plates within 15 minutes of preparation. The negative control well received 50 μl of sterile DCAMHB, and the positive growth control well received 50 μl of inoculum, both of which contained no antimicrobial compound. Each plate was then covered with an adhesive seal and placed in an 18°C incubator stacked no more than four plates high to allow for proper ventilation and airflow. To ensure the appropriate inocula concentration (e.g., 5.0 × 10⁵ colony-forming unit [CFU]/ml, as recommended by the manufacturer), colony counts were performed from each plate by serial dilution. After 96 hours of incubation, Sensititre plates were visually examined for the presence of bacterial growth in each well. The MICs were recorded as the lowest concentration of drug that inhibited detectable growth of bacteria. 20 As noted by CLSI, 20 antagonists in the medium with SXT and PRI may allow some slight bacterial growth, because of this, the MIC recorded was the concentration that inhibited approximately <80% of growth in relation to the positive control well. Quality control strains ATCC 25922T of Escherichia coli and ATCC 33658T of Aeromonas salmonicida subsp. salmonicida were prepared alongside each group of F. psychrophilum isolates as recommended and detailed in CLSI.20,21
Epidemiological cutoff values
As suggested by Smith et al., 22 the acronym ECV should be reserved for cutoff values set officially by CLSI and the acronym ECOFF should be reserved for cutoff values set officially by The European Committee on Antimicrobial Susceptibility Testing (EUCAST). Because the calculated epidemiological cutoff values generated in this study have not yet been accepted by CLSI or EUCAST, the acronym COWT (cutoff wild type) will be used to denote the epidemiological cut-off value developed in this study. Specifically, COWT values that were calculated by the normalized resistance interpretation (NRI) method will be denoted CONRI, and COWT values that were calculated by the ECOFFinder analysis will be denoted COECOFF.
Epidemiological cutoff values (COWT) were calculated by the NRI method 25 (CONRI). The settings used included 97.7% of the putative wild-type isolates. The NRI values are continuous variables; however, they are expressed as ordinal categories with values relating to the concentrations used in the dilutions of the test protocol. The experimentally determined cutoff values were rounded up to the next highest dilution category. The NRI method was used with permission from the patent holder, Bioscand AB (Täby, Sweden; European patent No. 1383913, U.S. Patent No. 7,465,559).
COWT values were also calculated using the ECOFFinder analysis as based on the methods of Turnidge et al. 26 (COECOFF) and provided by CLSI (http://clsi.org/standards/micro/ecoffinder/). The settings used for this method included 99% of the putative wild-type isolates.
Results
Antimicrobial susceptibility profiles and epidemiological cutoff values
The MIC values produced by the two quality control strains grown at 18°C were within accepted CLSI ranges. 21 The MIC range and COWT values for each antimicrobial tested are listed in Table 2. The MIC for each antimicrobial agent varied between isolates and their classified STs (Supplementary Table S1; Supplementary Data are available online at www.liebertpub.com/mdr).
Epidemiological cutoff values (COWT) were calculated using both the ECOFFinder analysis (COECOFF) and normalized resistance interpretation (CONRI) method. MIC value reported for trimethoprim–sulphamethoxazole and ormetoprim–sulphadimethoxine is drug concentration that produced ∼80% bacterial growth compared to positive control. COWT could not be calculated for gentamicin or ampicillin data.
Antimicrobials with a are sulphonamides, antimicrobials with b are quinolones.
MIC, minimum inhibitory concentration; NRI, normalized resistance interpretation.
Oxytetracycline
For OXY, the CONRI value was 0.125 μg/ml, and the COECOFF value was 0.06 μg/ml (Table 2). A bimodal MIC distribution in response to OXY was observed (Fig. 1). The first group (group 1) consisted of 38 isolates (76%) inhibited by concentrations of OXY ranging from 0.015 to 0.06 μg/ml, and the second (group 2) contained 11 isolates (22%) inhibited by concentrations of OXY ≥4 μg/ml (Fig. 1). In fact, the MIC for a single epidemic isolate (US32, ST78; Supplementary Table S1) exceeded the highest employed OXY concentration (8 μg/ml). The majority of isolates requiring higher concentrations of OXY were closely related epidemic STs (Supplementary Table S1); however, three nonepidemic isolates also had high OXY MICs (e.g., US09, ST253; US28, ST31; and US29, ST31).
To determine if MIC values for OXY were associated with MIC values (high or low) for other antimicrobials, scatter plots were constructed (Supplementary Fig. S1). However, no associations were observed.
Florfenicol
The COWT value calculated from the FFN MIC data by both methods was 2 μg/ml (Table 2). Isolates exhibited a unimodal MIC range of 0.25–1 μg/ml in response to FFN (Table 2 and Fig. 1). The most frequently observed MIC value was 0.5 μg/ml (n = 25, 50%), however, the next highest concentration of 1 μg/ml was also highly represented (n = 24, 48%). Both concentrations contained epidemic and nonepidemic isolates (Fig. 1).
Ormetoprim–sulphadimethoxine
The COWT values calculated from the PRI MIC data were 1/19 μg/ml (CONRI) and 0.5/9.5 μg/ml (COECOFF; Table 2). A broad range of PRI concentrations (0.008/0.15–0.5/9.5 μg/ml) was required for isolate inhibition (Table 2). From the unimodal PRI data, the most frequently observed MIC value was 0.06/1.19 μg/ml and consisted of both epidemic and nonepidemic isolates (Fig. 1). All isolates had MICs below the COWT values calculated by both methods (Fig. 1); however, a single isolate (US17, ST78) was approaching the COECOFF with an MIC of 0.5/9.5 μg/ml (Supplementary Table S1). Furthermore, the majority of isolates with lower MIC values consisted of nonepidemic isolates, and as PRI concentrations increased, the proportion of epidemic isolates increased as well (Fig. 1).
Trimethoprim–sulphamethoxazole
Although the COWT values were different based on the method used (CONRI 0.5/9.5 μg/ml; COECOFF 0.12/2.38 μg/ml; Table 2), all isolates were below both thresholds as the MIC values ranged <0.015/0.3–0.12/2.38 μg/ml (Table 2). A unimodal distribution of MICs was observed, and the most frequently observed MIC was 0.03/0.59 μg/ml (n = 18, 36%) and encompassed both epidemic and nonepidemic isolates (Fig. 2). However, in the group of isolates requiring lower concentrations of PRI than used (<0.015/0.3 μg/ml), none was of epidemic nature, and the highest MIC value (0.12/2.38 μg/ml) did not contain any nonepidemic isolates (Table 2 and Fig. 2).
Erythromycin
The CONRI and COECOFF values were both 8 μg/ml when calculated from ERY MIC data (Table 2), and all isolates fell below this threshold (Fig. 1). The ERY MICs ranged from 0.5 to 4 μg/ml and produced a unimodal distribution with the most frequently observed MIC of 2 μg/ml (n = 21, 42%; Table 2 and Fig. 1). Both epidemic and nonepidemic isolates had broad MIC values in response to ERY (Fig. 1).
Oxolinic acid
Both the CONRI and COECOFF value calculated from the OXO data was 0.25 μg/ml (Table 2). All isolates fell below the COWT as the range of MICs was 0.06–0.25 μg/ml (Table 2 and Fig. 2). There was a unimodal distribution of OXO MIC data, whereby the majority of isolates had an MIC of 0.12 μg/ml (n = 31, 62%; Fig. 2). No association between MIC and whether the isolate was epidemic or not were observed, as both epidemic and nonepidemic isolates were distributed among all MIC values produced.
Flumequine
The COWT value calculated from the FLUQ MIC data was 0.12 μg/ml (CONRI and COECOFF). FLUQ MICs were unimodal (0.03–0.12 μg/ml) and all fell below the COWT value (Table 2 and Fig. 2). The majority of isolates (epidemic and nonepidemic) had an MIC value of 0.06 μg/ml (n = 31, 62%). Two nonepidemic isolates had the highest produced MIC value (0.12 μg/ml; US22, ST260; US34, ST263; Supplementary Table S1).
Enrofloxacin
The CONRI for ENRO was 0.03 μg/ml and the COECOFF was 0.015 μg/ml (Table 2). Isolates ranged in MICs from <0.002 to 0.015 μg/ml (Table 2), and a unimodal distribution of MICs was observed. All, but one isolate (nonepidemic US37, ST265; Supplementary Table S1) produced an MIC value below the COECOFF value (0.015 μg/ml), and all isolates were below the CONRI value (0.03 μg/ml; Fig. 2). The most frequently observed MIC was 0.008 μg/ml (n = 25, 50%). ENRO MICs of 10% of the isolates (n = 5), which belonged to ST256, could not be determined (Supplementary Table S1).
Gentamicin
The MICs for GEN could not be determined for 24% (n = 12) of the samples, which were composed of both epidemic and nonepidemic isolates (Supplementary Table S1). The large percentage of putative wild-type isolates did not allow for the calculation of statistically valid COWT values (NRI or ECOFF; Table 2). A unimodal distribution of MICs was observed, and the most frequently observed MIC was 0.12 μg/ml (n = 17, 34%; Fig. 2) and encompassed both epidemic and nonepidemic isolates.
Ampicillin
The AMP MICs of 92% (n = 46) of the isolates could not be determined with the drug concentrations used in the Sensititre plates (i.e., lower drug concentrations required). The remaining four isolates, which were nonepidemic, were inhibited by AMP values of 0.06 μg/ml and belonged to ST13 (n = 2) and ST260 (n = 2; Fig. 2 and Supplementary Table S1). Because of the large percentage of putative wild-type isolates, statistically valid COWT values could not be calculated using either method (NRI or ECOFF; Table 2).
Comparison between CONRI and COECOFF values
Epidemiological cutoff values were calculated for 8/10 antimicrobial MIC distributions. Among these, the CONRI and COECOFF values were in agreement 50% of the time (n = 4), producing identical COWT values for OXO (2 μg/ml), FLUQ (0.12 μg/ml), ERY (8 μg/ml), and FFN (2 μg/ml; Table 2). For ENRO, SXT, PRI, and OXY, the CONRI and COECOFF values were in disagreement (66%; n = 6; Table 2). For the cases in which CONRI and COECOFF values were different, the COECOFF value was consistently lower by one dilution than the CONRI value for all antimicrobials except SXT, whereby the COECOFF value was lower by two dilutions.
Discussion
Among all antimicrobial agents examined in this study, OXY was the only drug in which F. psychrophilum isolates from Michigan showed resistance (Fig. 2). OXY has long been used to treat F. psychrophilum infections worldwide,11,13,27 and is in fact the most used antibiotic in North American aquaculture.28,29 This study reports the first F. psychrophilum isolates with reduced susceptibility to OXY retrieved from both free-ranging and aquacultured Michigan salmonid populations (Supplementary Table S1). However, the majority of the Michigan F. psychrophilum isolates with reduced susceptibility to OXY were recovered from captive salmonid populations (Supplementary Table S1). This may indicate that the emerging reduced susceptibility risk stems from the use of this compound in aquaculture settings. Treatment with OXY in Michigan aquaculture facilities occurs frequently, which has provided many opportunities for repeated exposure to these isolates. Although hatcheries are disinfected between rearing seasons, F. psychrophilum may continue to exist in areas of hatchery infrastructure that are rarely completely disinfected, increasing the risk that these isolates will reemerge and perpetuate in the hatchery system.
Results from this study in conjunction with our previous MLST characterization of these GLB isolates revealed that the majority of the isolates with reduced susceptibility to OXY are indistinguishable from one another by MLST analysis and belong to a single ST (i.e., ST78; Supplementary Table S1; 23). These ST78 isolates (and their closely related single-locus variants) are also frequently associated with BCWD mortality events, and are considered highly virulent to rainbow trout around the world.23,30,31 In general, our data suggest a correlation between high virulence isolates and a reduced susceptibility to OXY, possibly due to a greater likelihood of warranting antibiotic treatments during disease outbreaks. Sundell and Wiklund 32 reached a similar conclusion using European isolates. Reduced susceptibility to OXY, however, has also been found in isolates retrieved from apparently healthy fish (i.e., US09, US28, and US29; Supplementary Table S1). In addition, some epidemic-associated isolates have demonstrated wild-type susceptibility to OXY, a matter that cannot be explained solely by data generated in this study (Supplementary Table S1).
A number of mechanisms can contribute to antimicrobial resistance, including horizontal gene transfer, plasmid encoded resistance, and genetic mutations. Specifically in F. psychrophilum, plasmids have been used as characterization method of isolates, although the correlation between these plasmids and possible antimicrobial resistance remains to be known.14,33 Furthermore, genetic mutations in the GyrA gene have been linked to quinolone resistance in a multitude of bacteria,34,35 including F. psychrophilum. 33 However, the factors contributing to the reduced susceptibility in Michigan F. psychrophilum isolates are currently unknown. It is interesting to note, however, that ST78 isolates (genetically indistinguishable from each other) are commonly associated with BCWD outbreaks and frequently exhibit reduced susceptibility to OXY, yet the exact mechanism(s) linking the apparent reduced susceptibility to OXY to virulence requires further investigation and could help guide future control efforts of this pathogen. In contrast, ST256 isolates were shown to have increased susceptibility to ENRO, whereby the concentrations used in this study were not low enough to determine MICs for 5/6 ST256 isolates (Supplementary Table S1).
Epidemiological cutoff values were calculated using two statistical approaches (NRI and ECOFFinder25,26,36). In some cases (i.e., OXO, FLUQ, ERY, and FFN), both the CONRI and COECOFF methods were in agreement and produced the same COWT value (Table 2). For the antimicrobials in which the MIC distributions produced variable COWT values dependent on the method used, the COECOFF method consistently produced values lower by one dilution compared with the CONRI method for all antimicrobials except ormetoprim–sulphadimethoxine, whereby two dilutions lower was observed (Table 2). Since both methods are relatively recent, and are improvements upon the older subjective visual method, 36 they should both continue to be used when calculating epidemiological cutoff values for a variety of bacterial species until a gold standard can be accepted.
As no epidemiological cutoff values are currently established for F. psychrophilum, the interpretation and comparison of MIC data among studies are difficult. Overall, isolates from a preliminary study 22 and the isolates from Michigan are seemingly responding in similar manners to the antimicrobials examined. However, there is a need for more studies to be conducted using the standardized test protocol approved by CLSI, 20 as a larger dataset can help to validate these important and greatly needed values. Upon acceptance of epidemiological cutoff values for F. psychrophilum, a full standard protocol will have to be developed and allow for generation of comparable data from different geographical regions and time periods to assess the consequences of antimicrobial use in regard to F. psychrophilum. 22
The evidence of isolates with reduced susceptibility to commonly used drugs, particularly OXY, along with the lack of an approved vaccine, 3 increases the importance of other control methods, including strengthened biosecurity and culling of heavily infected broodstock.3,4,37 Furthermore, increased awareness of hatchery staff and diligent caretaking can also help in identifying F. psychrophilum infections early enough to ward off massive mortalities.
For the first time, using a standardized antimicrobial susceptibility testing protocol,20,21 we have identified the risk of reduced susceptibility to OXY in the GLB of Michigan. The epidemiological cutoff value data produced in this study will contribute to the validation of these values worldwide and provide a better means of interpretation and comparison across studies. Identification of reduced susceptibility trends early can help mitigate the risk of further emergence, and thus it is recommended that antibiotic susceptibility profiling continues with F. psychrophilum isolates from many other regions using the standardized protocol employed in this study.
Footnotes
Acknowledgments
The authors would like to thank the Michigan Department of Natural Resources for contribution of samples, as well as Dr. Charlie Gieseker for his technical advice. Funding: Michigan Department of Natural Resources (Grant No. 751P4300177) and Great Lakes Fishery Trust (Grant No. 2010.1147).
Disclosure Statement
No competing financial interests exist.
References
Supplementary Material
Please find the following supplemental material available below.
For Open Access articles published under a Creative Commons License, all supplemental material carries the same license as the article it is associated with.
For non-Open Access articles published, all supplemental material carries a non-exclusive license, and permission requests for re-use of supplemental material or any part of supplemental material shall be sent directly to the copyright owner as specified in the copyright notice associated with the article.