
Abstract
Currently, data on Escherichia coli antibacterial susceptibilities in the Faroe Islands are lacking. The aim was to investigate the antibacterial susceptibilities of E. coli from patients with community-acquired urinary tract infections in the Faroe Islands, correlate with antibacterial sales, and compare with Iceland and Denmark. From 2009 to 2010 and in 2012, 12 general practitioners from the Faroe Islands were recruited to provide urine samples from patients. Antibacterial susceptibilities were determined by disc diffusion testing according to the Clinical and Laboratory Standards Institute methods and criteria. Logistic regression (quasibinomial) of the antibacterial resistance proportions versus mean sales during the period of 2008–2011 was used to determine association. Nonsusceptibility to at least 1 of the 14 antibacterial drugs investigated was found in 54% of the E. coli isolates and was most common to ampicillin (46%), followed by sulfamethoxazole (39%), trimethoprim (27%), trimethoprim/sulfamethoxazole (27%), and <10% to the remaining 10 antibiotics. The resistance prevalence did not change significantly with time. From logistic regression modeling, we find significant associations between antibacterial mean sales and antibacterial resistances. For the resistances in the Faroe Islands compared with data from Denmark and Iceland, we infer two groups of resistances indicating different responses—one steep and one gradual—to antibacterial sales. For these two groups, we find β1 = 4.77 (Std. Error = 0.624, p-value = 0.002) and β1 = 0.26 (Std. Error = 0.020, p-value = 4e-7) for the steep and gradual groups, respectively. This knowledge can potentially be used to predict and control the future increase in E. coli resistance with antibacterial sales.
Introduction
A
Mecillinam/pivmecillinam is among the first-line antibiotics prescribed for uncomplicated UTIs in the Nordic countries. In Faroe Islands and Denmark, sulfamethizol is also used routinely. 6 The use of pivmecillinam in the Faroe Islands is complicated by a high prevalence of a rare genetic disease, primary carnitine deficiency (PCD). Use of pivmecillinam and pivampicillin increases the risk for arrhythmia and cardiac arrest in PCD patients and is therefore contraindicated. 7 Therefore, pivmecillinam was withdrawn from the Faroese market in 2011 8 and sulfamethizol has remained the first-choice antibiotic for community-acquired UTIs since 1948. In 2013, pivmecillinam was reintroduced as an option for treating UTIs in the Faroe Islands, but only for patients where PCD has been excluded. 9
Physicians in the Faroe Islands have not routinely sent urine samples from patients with suspected UTIs for culture. Therefore, information on the antibacterial susceptibilities of the bacteria causing community-acquired UTIs in the Faroe Islands is lacking.
Studies on the antimicrobial consumption and association with antimicrobial resistance among E. coli are available in the neighboring countries of Iceland and Denmark. Resistance to fluoroquinolones has continuously increased along with increasing ciprofloxacin use.10,11 In some European countries, the resistance in community-acquired E. coli isolates is also increasing. 12
The objective of this study was to examine the antibacterial susceptibility rates among E. coli isolates from outpatients with community-acquired UTIs, determine if susceptibility rates correlate with antibacterial sales in the Faroe Islands, and do similar analyses on comparable data from Iceland and Denmark.
Materials and Methods
Microbiology
The participating general practitioners (GPs) deposited the urine samples on a dipslide containing CLED and MacConkey medium (Oxoid, Roskilde, Denmark). Within 24 hours, they were incubated under aerobic conditions at 35°C for 18–24 hours. Colonies with a minimum count of 100,000/ml were taken from the MacConkey part of the dipslide and inoculated on 5% sheep blood agar and incubated at 35°C for 18–24 hours. Typical colonies that were oxidase negative and indole positive were considered to be E. coli.
Susceptibility to ampicillin, cefoxitin, trimethoprim, trimethoprim/sulfamethoxazole, nitrofurantoin, mecillinam, cefpodoxime, amoxicillin/clavulanic acid, cefuroxime, ceftriaxone, nalidixic acid, gentamicin, ciprofloxacin, and sulfonamide (sulfamethizol) (Oxoid, Roskilde, Denmark) was determined by disc diffusion test according to the CLSI methods and criteria. 13
Data from Iceland and Denmark
Susceptibility data from Iceland were obtained from the Department of Clinical Microbiology, Landspitali University Hospital. 14 Susceptibility testing was performed according to the CLSI methods and criteria. 13 Susceptibility data from Denmark were obtained from Danish Integrated Antimicrobial Resistance Monitoring and Research Program (DANMAP).11,15 The isolates tested for susceptibility in Iceland are not given in total isolates and some of the isolates are tested for one, two, or several antibiotics. Therefore, we do not have the total number of tested isolates per year. Susceptibility testing in this article is for resistant (R) and intermediate (I) isolates in the Faroe Islands, but when comparing Faroe Islands, Iceland, and Denmark, we are using only R isolates.
Antibacterial sale
We use sale data to represent the approximate antibiotic consumption. Information on antibacterial sales for the Faroe Islands was obtained from a recently published study 16 and from the National Pharmacist in the Faroe Islands (Richard Schwartson and Ann W. Jensen). DANMAP was the source for information from Denmark.1,15,17 Information for Iceland was collected from the Icelandic Medicine Agency. 18 We correlated antibacterial sales from 2008 to 2011 with data on antibacterial resistance for 2009, 2010, and 2012. We believe that it is reasonable to have a lag time of 1 year since others have observed that the change in resistance may be followed 1 year or more after the antibacterial sale.19,20
Statistical analysis
The statistical analysis was performed by using the R language for statistical computing and graphics (www.r-project.org) and the RStudio integrated development environment (www.rstudio.com).
Differences between the years 2009/2010 and 2012 in the Faroe Islands
Fisher's exact test, fisher.test, 21 was used to test for significant differences in resistances. A 2 × 2 contingency table was constructed for each antibiotic with counts of nonsusceptible and susceptible isolates from two population samples (2009/2010 and 2012) taken in the Faroe Islands. Isolates sampled in 2009 (n = 27) and 2010 (n = 63) were combined to 2009/2010 (n = 90) and the antibacterial resistance of E. coli against 14 antibiotics was compared with the corresponding resistance of 120 isolates sampled in 2012. Binomial confidence intervals for the 14 antibacterial mean resistances of the total sampled isolates (210) were constructed by using binom.confint with methods = “exact” from the R package binom.
Test for trend in antibacterial resistance for the Faroe Islands
Data for antibacterial sales in the Faroe Islands for the 4 years, 2008–2011, were found for 7 of the 14 antibiotics. The variability of the mean resistances of the 7 antibiotics was investigated for any linear dependence on different mean sales. The test for trend in proportions prop.trend.test 21 was used, which in our case, is a weighted linear regression of the resistances on ordered sales categories—represented by group scores. The test was used to determine if there was no trend (zero slope) in resistance compared with sales (group scores).
Logistic modeling of antibacterial resistance with sales
Logistic regression 21 was used to accurately model the dependency between resistance and antibiotic sales in the Faroe Islands, Iceland, and Denmark. Measurements with two possible values (nonsusceptible, susceptible) are modeled. To constrain the resistance proportions R between 0 and 1, they are transformed to log [R / (1 − R)] = log odds R. We used a simple linear model: log odds Ri = β0 + β1xi for the resistance Ri depending only on one continuous predictor variable xi representing antibiotic sales and β0 and β1 representing the intercept and slope, respectively. Similarly, we also modeled resistance proportions R + I, but in this case, only for the Faroe Islands.
Overdispersion (φ > 1) indicates nonoptimal fit between the applied logistic model and the data; this may influence the p-values of the model parameters β0 and β1. To revise p-values in cases of overdispersion—in the quasi-likelihood approach—the model parameters are estimated from the ordinary logistic model, but the binomial variance is scaled to φRi(1 − Ri)/ni by the dispersion parameter φ, standard errors are scaled by φ1/2, and dispersion is estimated by the X2 fit statistic: X2/df for the binomial model. 22
Antibacterial nonsusceptibility (R + I) versus sales in the Faroe Islands
Logistic models can also be modified to minimize overdispersion. To investigate this effect for the seven data points from the Faroe Islands, we limited the analysis to the sales range where we expect the binomial logistic model to apply. In this part of the study, we assumed that the resistance is approximately independent of sales for low and high antibiotic sales, but follows the binomial logistic model at intermediate sales. We found the sales limits by repeating the logistic regression for different sales values for ampicillin (AMP) until we get minimal overdispersion and stop the iterative process of the most extreme sales data while keeping the resistances unchanged. If large overdispersion still persists, we also excluded as few data points as possible to reduce overdispersion to a low level (1 < φ < 3), which we then corrected for using family = quasibinomial rather than family = binomial in the glm function calls of the R software. 23
Antibacterial resistances versus sales from Faroe Islands, Iceland, and Denmark
Modeling antibacterial resistances for Faroe Islands is complicated by the few (7) data points. Therefore, the data on antibacterial resistances (R) versus sales from Faroe Islands 7, Iceland 6, and Denmark 5 were combined into 18 paired vales of antibacterial resistances and mean sales. The cor.test function in the R software was used to test for correlation 21 between resistance and sales in the combined sample. The cor.test was used as a simple test for correlation using all 18 data points without removing any outliers. In addition, this test does not apply any sample size information used to compute the resistance proportions—as opposed to the trend test and logistic regression—that need the sample size information.
For logistic regression on the combined sample, we assumed that the sample sizes were identical to the sample from Faroe Islands (n = 210). The sample size assumption gives equal weight to the resistances sampled in each country and no iteration of extreme sales data was applied to the combined sample. Otherwise, we applied similar procedures for the logistic regression as were applied to the sample from Faroe Islands.
Logistic modeling using the R software
We used glm function calls of the R software, where dispersion is explicitly observed in the output of quasibinomial logistic regression. The p-values <0.05 are considered significant for the model parameters, β0 and β1, obtained from the quasibinomial logistic regression when φ > 1.
The R package visreg was used on the output from glm function calls to calculate the regression curves with lower and upper confidence limits for desired continuous x-intervals. Finally, the R package ggplot2 was used to visualize the results of the regression as solid lines and curves with confidence bands.
Ethical and data protection approvals
Ethical approval was obtained from the Scientific Ethical Board of Faroe Islands on the 7th of November in 2008 and the data collection approval was obtained from the Data Protection Agency on the 6th of June in 2008.
Results
Study population
The Faroe Islands have a population of only 50,000. During the time period 2009–2012, there were 24 GPs, 12 of whom participated in the study. The GPs were selected with the intent to represent all the geographical regions of the Faroe Islands. The GPs sampled mid-stream urine specimens from patients in all age groups whose urine was positive in a dip strip test for leukocytes, nitrate, or both. The sampling period was from January 20th to March 25th 2009 and January 6th to March 25th 2010. The GPs obtained written informed consent from the patients and asked for a urine sample. From June 2010 to December 2010 and April 2012 to December 2012, additional E. coli isolates from patients with suspected community-acquired UTIs were also included in our study. The isolates from 2010 to 2012 were collected at the GP clinics, but processed in the department of clinical microbiology at the National Hospital of the Faroe Islands. While the 12 GPs represented all the geographical regions of the Faroe Islands, an increase in the percentage of samples originating from the capital district, Tórshavn, where 41% of the Faroese population lives, was seen over time. 24
E. coli was determined to be the cause of UTIs in 210 patients. Of those 210 patients, 178 (85%) were women and 32 (15%) were men. During the sampling period from January to March 2009, there were 27 E. coli strains isolated from the tested samples. From January to December 2010, 63 strains were isolated. From January to December 2012, 120 strains were isolated.
There was no significant difference found for any of the 14 antibacterial resistances when the data for years 2009/10 and 2012 from the Faroe Islands were compared (Table 1, p-values not shown). The resistance rates were highest for the following 4 antibiotics: ampicillin (46%), sulfonamide (39%), trimethoprim (27%), and sulfamethoxazole/trimethoprim (27%), while the resistance of the remaining 10 antibiotics was below 10% (Table 1, Total isolates).
Isolates sampled in 2009 (n = 27) and 2010 (n = 63) are combined to 2009/2010 (n = 90) and the antibacterial resistance against 14 antibiotics is compared with the corresponding resistance of 120 isolates sampled in 2012. The resistance of the total sampled isolates (n = 210) is also shown together with both lower and upper confidence limits.
CI, confidence interval.
For the 7 antibiotics: gentamicin (CN), co-amoxiclav (AMC), ciprofloxacin (CIP), nitrofurantoin (F300), mecillinam (MEL), sulfonamide (S3), and ampicillin (AMP), the number of resistant (R) isolates of n = 210 was 4, 13, 6, 9, 1, 82, and 96, respectively (Table 1, Total isolates); ordered by the mean sales of 0.13 aminoglycosides, 0.22 amoxicillin and enzyme, 0.47 quinolones, 0.73 nitrofuran, 0.88 pivmecillinam, 1.20 sulfa/trim and 11.1 penicillins, in units of Defined Daily Dose (DDD)/1,000 inhabitants/day (DID) (Table 2). The test for trend (prop.trend.test) in resistance proportions (R) with antibacterial mean sales using default scores (1–7) is significant (X-squared = 231, p-value <2.2e-16). Similarly, for the 210 isolates and the same 7 antibiotics ordered by mean sales, the number of resistant isolates (R + I) was 4, 51, 7, 23, 16, 83, and 131. The prop.trend.test applied to resistance proportions (R + I) with antibacterial mean sales using default scores (1–7) is again significant (X-squared = 208, p-value <2.2e-16).
DID, Defined Daily Dose/1,000 inhabitants/day.
The quasibinomial logistic regression for the 7 antibiotic resistance proportions (R + I) versus mean sales shows high overdispersion (φ ≈ 31) and an insignificant p-value (0.05) for the sales parameter β1. Therefore, to minimize overdispersion, we used a maximum sales limit of 1.57 for ampicillin instead of 11.1, and excluded the two data points for co-amoxiclav and mecillinam, considered to be outliers. The revised quasibinomial logistic regression is shown in Figure 1.
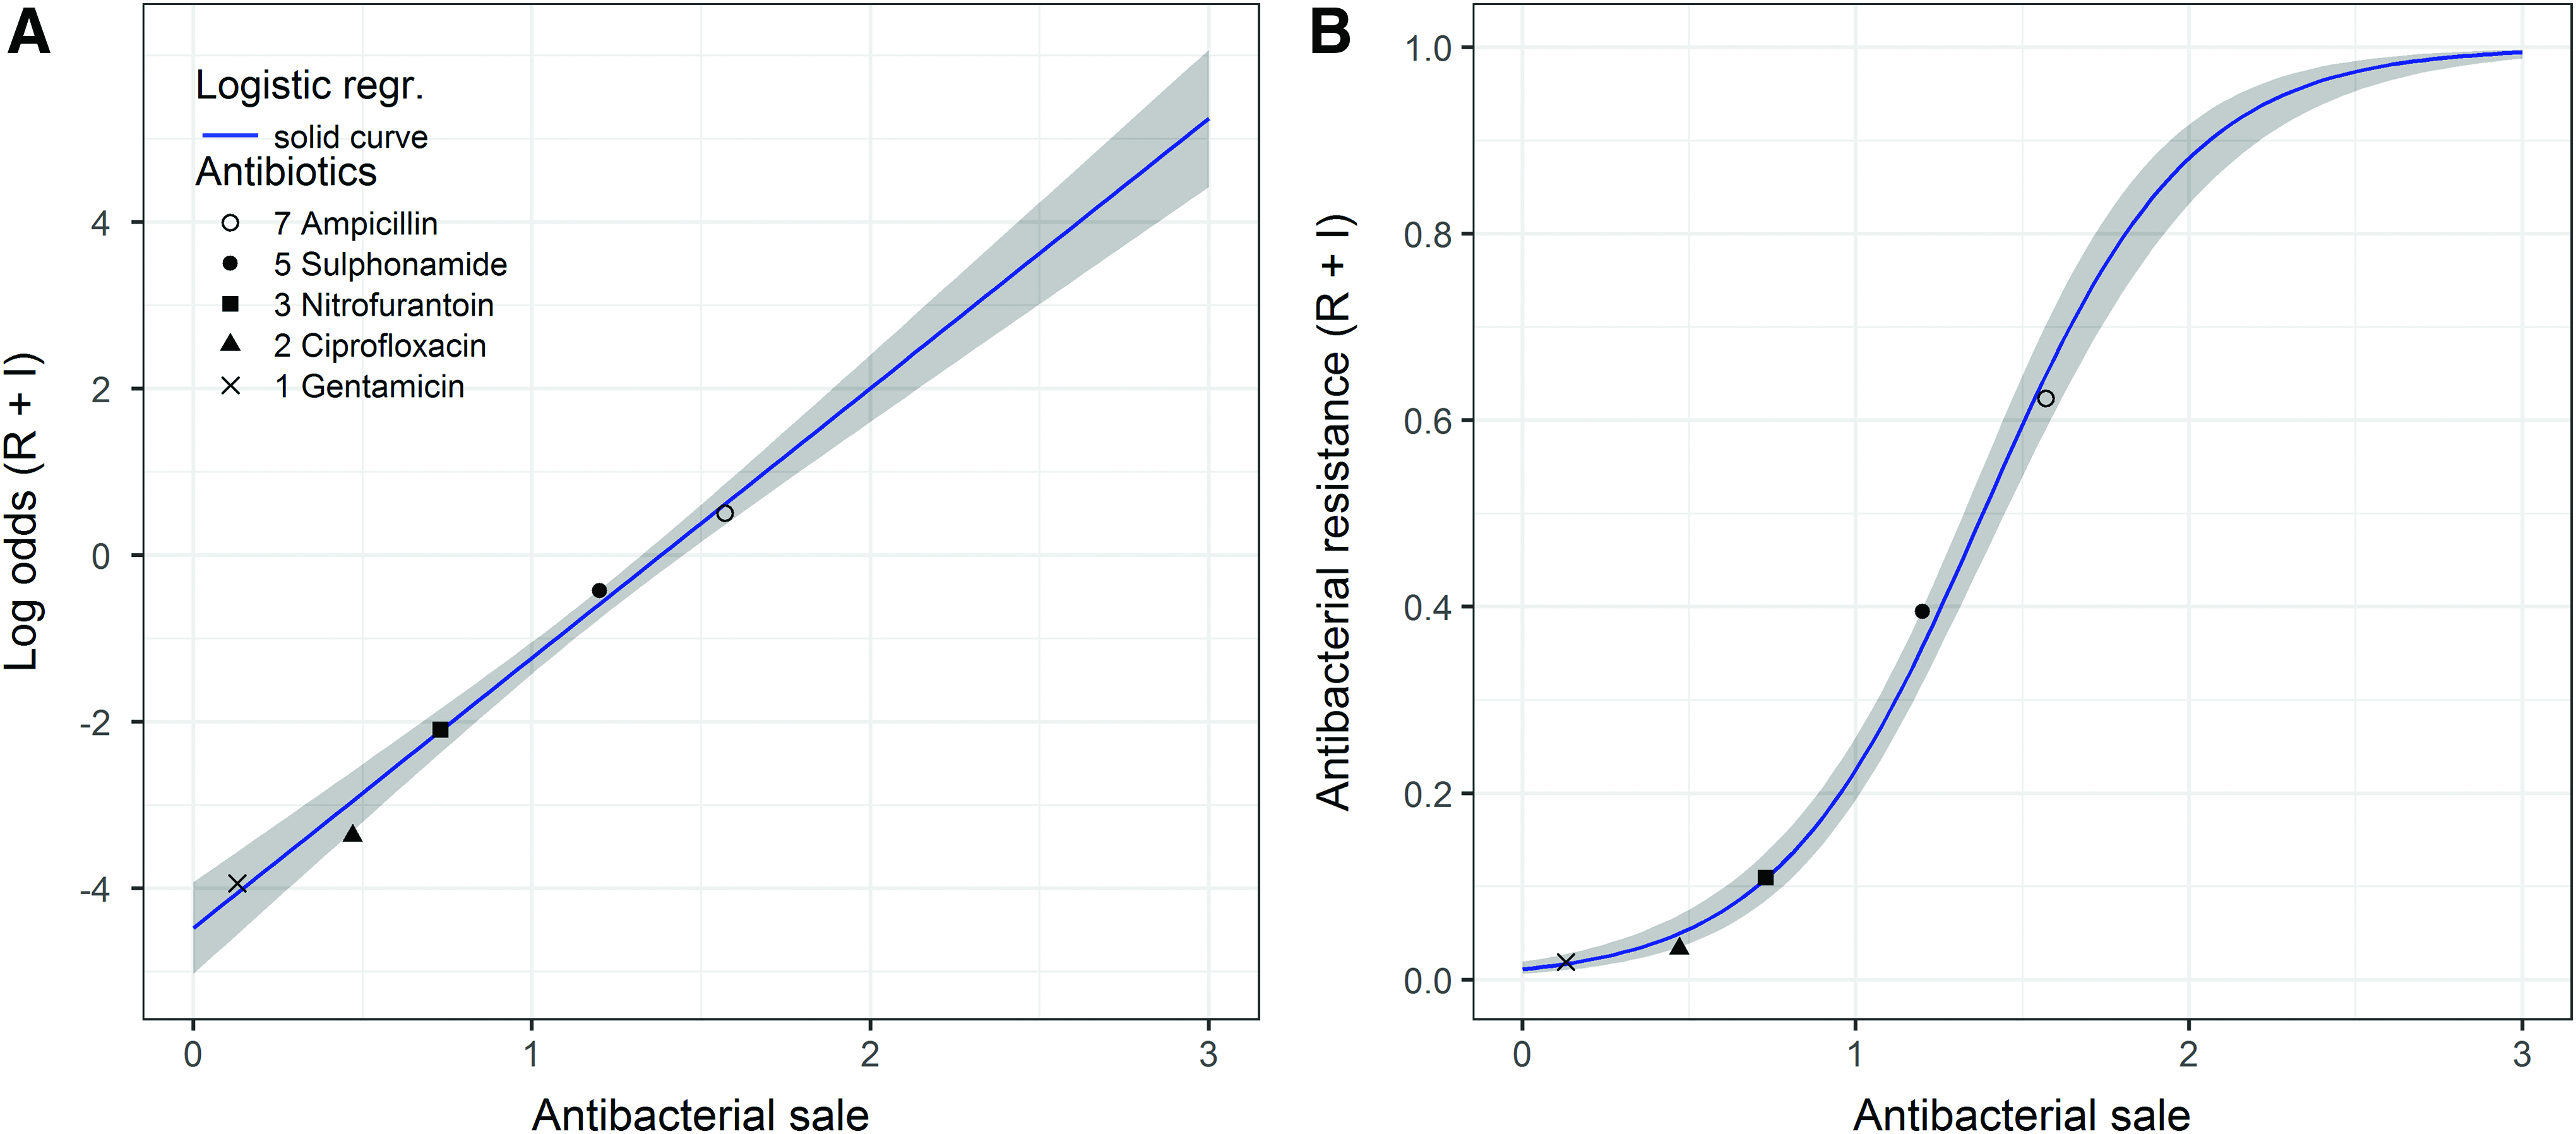
Logistic regression of five antibiotic resistance proportions in the Faroe Islands versus mean sales 2008–2011, defined daily doses per 1,000 inhabitants per day. The plot
Faroe Islands, Iceland, and Denmark
The cor.test function in the R software showed both significant Pearson's product–moment correlation (cor. =0.78, p-value = 0.0001) and Spearman's rank correlation (rho = 0.68, p-value = 0.002). The correlations were found between resistance and mean sales in the combined sample with 18 paired values of antibacterial resistances (R) and mean sales from the Faroe Islands, Iceland, and Denmark (Tables 2 and 3).
Logistic regression on this group of data is again highly overdispersed (≈30), but we identify two subgroups of steep and gradual increasing resistances, respectively. By gradual and steep developing antibacterial resistances, we mean that the antibacterial resistances that follow the logistic line with the small slope will typically show lower increase in resistance with sales, while the resistances that follow the logistic line with the large slope will typically show a higher increase in resistance with sales.
The 18 data points were first plotted and modeled on the logistic scale. It was clear from this plot and model that they could not be well modeled by a single line due to high overdispersion.
Visually, however, this plot also indicated that two different lines possibly could model two different subsets of the data. Initially, this was done manually by looking at the plot with a ruler. Next, the proper logistic modeling was done separately on these two subsets of data.
About 78% of the data points, that is, 14 of 18 resistances—6 of 7 in the steep group (ciprofloxacin, nitrofurantoin, and sulfonamide) and 8 of 11 in the gradual group (ampicillin, co-amoxiclav, gentamicin, and mecillinam)—follow the group's logistic lines, respectively (Figs. 2 and 3).
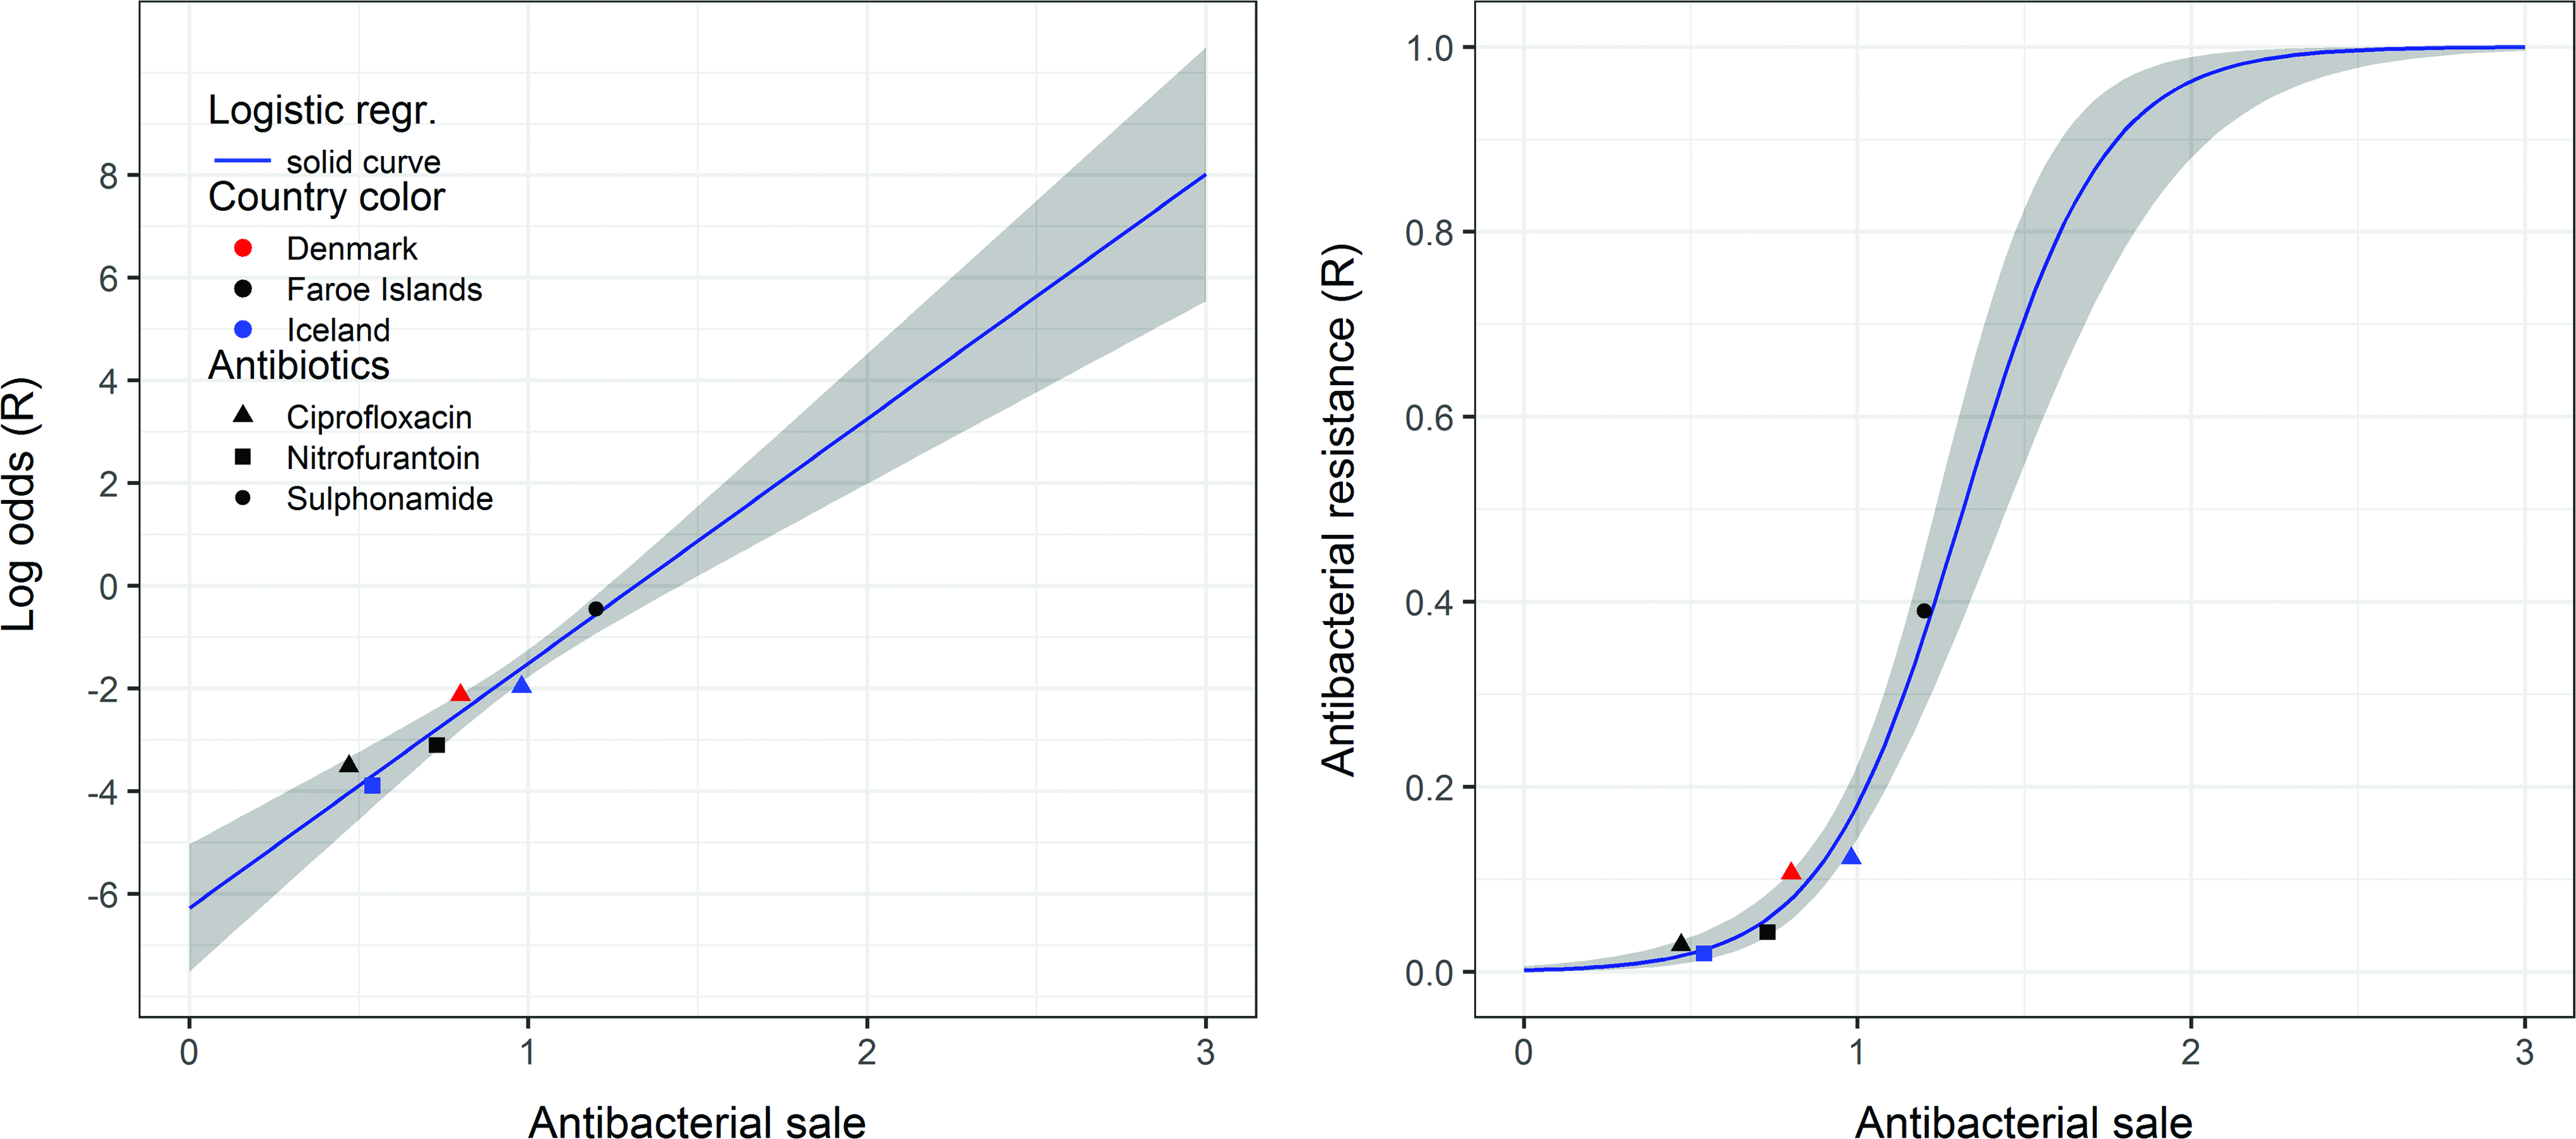
Logistic regression of six steep increasing antibiotic resistance proportions R for three antibiotics (ciprofloxacin, nitrofurantoin, and sulfonamide) versus mean sales 2008–2011. Overdispersion is moderate (≈2), and we find β1 = 4.77 (Std. Error = 0.624, p-value = 0.002). Sulfonamide in Denmark was excluded as an influential outlier. Color images available online at www.liebertpub.com/mdr
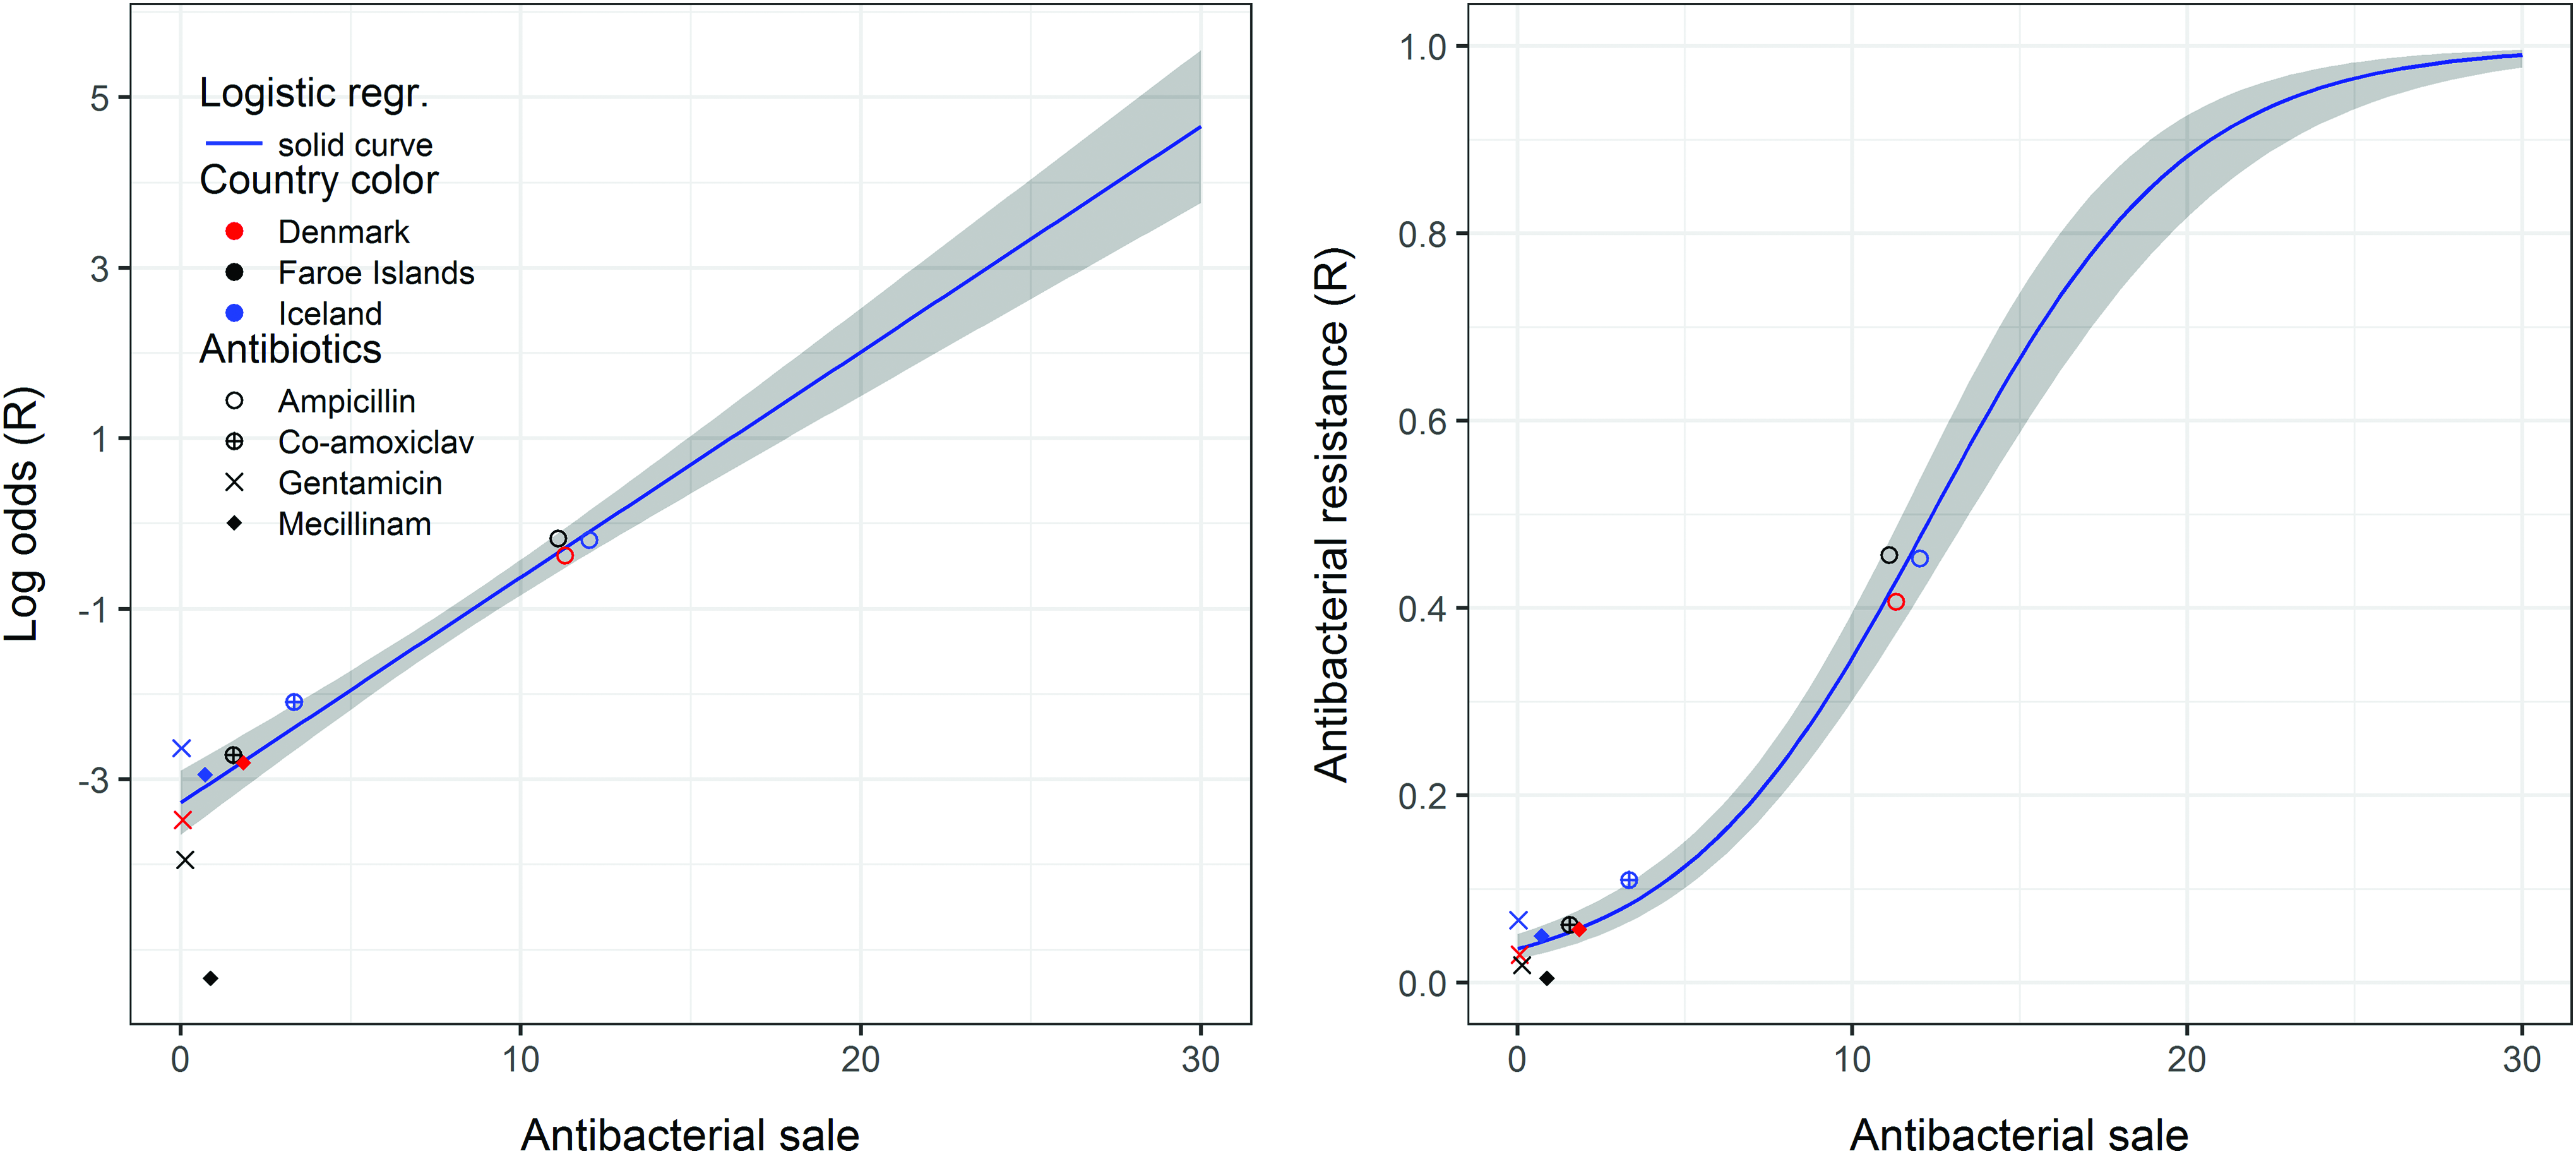
Logistic regression of 11 gradual increasing antibiotic resistance proportions R for 4 antibiotics (ampicillin, co-amoxiclav, gentamicin, and mecillinam) versus mean sales 2008–2011. Overdispersion is again moderate (≈2), and we find β1 = 0.26 (Std. Error = 0.020, p-value = 4e-7). About 8 of these 11 resistances are within the confidence limits of the logistic regression. Color images available online at www.liebertpub.com/mdr
Discussion
In the Faroe Islands, most uncomplicated UTIs are treated with short courses of empirical antibiotics. Susceptibility data have not been considered when these treatments were prescribed. Our study demonstrates a trend and correlation between antibacterial resistance and antibiotics sales, a finding that is consistent with other published studies on high antibacterial sales and resistance. 25
Our study also suggests both gradual and steep developing antibacterial resistances, which can potentially be used to predict and control the future increase in E. coli resistance with antibacterial sales. However, at this stage—with this small dataset—we should be careful not to claim this effect too strongly to hold in general for other countries, but more like a suggested effect observed locally in this small subset of Nordic countries (Figs. 2 and 3). This relatively good agreement, although not perfect, we believe is good enough to suggest that these effects be closely investigated in future studies. We can hypothesize that the resistance rate of ciprofloxacin in the Faroe Islands will increase to the same level as in Iceland if the sale of the antibiotic in the two countries is equalized (Fig. 2). According to this model, we could also hypothesize that by staying under the sale of 0.5 DID, the resistance rate would be low and between 0.5 and 1.0 DID, the resistance would be below 20% and >1.5 DID, and the resistance rate would be over 70% (Fig. 2). Figure 2 shows a strong increase in resistance with sales in this model and the high slope could have a large impact on resistance levels with sales as seen in other studies. 26
There was a high level of resistance prevalence to sulfonamides in the Faroe Islands in 2012 (41%). This is concerning, especially when compared with Denmark, where the resistance prevalence has been decreasing since 2010 to a reported 32% in 2014. 27 Sulfonamides have been on the market for decades. In fact, sulfonamides are still considered the first-choice treatment for uncomplicated UTIs in the Faroe Islands. The sale of sulfonamides has been relatively constant in the Faroe Islands over the last years compared with the declining sale of this antibiotic in Denmark.11,16
The resistance prevalence of sulfamethoxazole/trimethoprim and trimethoprim was nearly 30% in the Faroe Islands. A study published by G Kahlmeter 28 on the relationship between antimicrobial usage and resistance in community-acquired E. coli found the resistance prevalence of sulfamethoxazole/trimethoprim to be 8.2–8.3% in Denmark and Sweden, respectively. The highest resistance prevalence was found in Portugal (26.7%); however, this study was conducted in 2003. The sale of sulfamethoxazole/trimethoprim in the Faroe Islands is quite low, and the drug is new on the Faroese market. Sulfamethoxazole/trimethoprim is not used for community-acquired infections in the Faroe Islands. 9 The high resistance prevalence regarding sulfamethoxazole/trimethoprim in the Faroe Islands is probably due to the constant use of sulfonamides and the relatively high use of trimethoprim.
Our study places ciprofloxacin into the steep increasing resistance group, and fluoroquinolones are not recommended for uncomplicated UTIs due to the risk of increased resistance. 29 Additionally, there were concerns about a higher use of ciprofloxacin and a higher level of resistance to ciprofloxacin in the Faroe Islands. This concern was due to the withdrawal of pivmecillinam and pivampicillin from Faroese market in 2011 to avoid risks associated with PCD.7,8 The sale did increase as it did in Denmark and Iceland 16 ; however, the resistance rate to ciprofloxacin was low in the Faroe Islands compared with Denmark 11 and Iceland.10,30 DANMAP reported a slightly increased resistance in E. coli community-acquired isolates to ciprofloxacin in 2012. 11 In Iceland, the resistance to ciprofloxacin increased steadily until 2010, after which it has remained stable. 30 The increased sale of fluoroquinolones in the Faroe Islands, Denmark, and Iceland may be explained by availability of low price generic ciprofloxacin.
Mecillinam was placed in the gradual increasing resistance group in our study and mecillinam is used to treat uncomplicated UTIs in most Nordic countries. 29 In this study, we found a low level of mecillinam resistance compared with the mecillinam resistance prevalence in Iceland and Denmark.12,30 However, there is an indication of increased intermediate isolates in the Faroe Islands from 2009/10 to 2012. The low nonsusceptibility in the Faroe Islands is most likely due to the withdrawal of pivmecillinam from the Faroese market in 2012 8 and the decrease in sale of pivmecillinam from 2008 to 2011, directly preceding the withdrawal. However, the amount of pivmecillinam sold was similar in Iceland and the Faroe Islands.
Compared with the high resistance rates for other antibiotics, we found a relatively low prevalence of resistance to amoxicillin clavulanic acid. However, the resistance was higher than in Denmark 31 and lower than in Iceland. 14 The higher resistance in Iceland can be explained by the higher use of penicillins (ATC J01C) and the higher use of amoxicillin with clavulanic acid. Amoxicillin with clavulanic acid has greater activity than amoxicillin without clavulanic acid for bacteria where resistance is caused by beta-lactamase production. 32
Previously, for (R + I) for the Faroe Islands, we assumed that the resistance was approximately independent of sales for extreme antibiotic sales, but followed the binomial logistic model at intermediate sales. We based our assumption on the premise that at low levels of antibiotic sales, there may be insufficient selection pressure to significantly affect the antibiotic resistance. In addition, when high antibiotic sales are due to a popular antibiotic in use for a long period of time, the present time selection effect might now be small. In this case, the resistance could have saturated at lower sales, than present time sales, and not continued to increase with increased sales.
The trend tests applied to the data from the Faroe Islands find significant linear relationships between resistance and sales without using any sales limits or excluding data points. While the linear relationship is important, the ability to accurately predict the future developments in resistance with increased sales using the logistic curves is the major advantage of logistic modeling. The gradual and steep resistance groups were discovered when the small set of resistance data (R) from the Faroe Islands was combined into a larger sample with similar data from Iceland and Denmark. In this case, the extreme sale of ampicillin was not iterated to lower values, but instead used and modeled as part of the gradual increasing resistance group. For the antibiotics that agree with these resistance groups, it may be possible to predict the trend of resistance by comparing the resistance rate and sale in the three countries.
Our study covered a 3-year period, which should be sufficient to demonstrate a possible resistance pattern in E. coli isolates found in community-acquired UTIs. While this was a time-limited study, our finding of a relatively high resistance rate in community-acquired E. coli UTIs to some antibacterial classes emphasizes the importance of monitoring the susceptibility of E. coli isolates, especially sulfonamides. Taken together with the correlation between antibacterial sales and resistance in the Faroe Islands, Iceland, and Denmark, these findings justify a reconsideration of antimicrobial strategies against the E. coli isolates in the Faroe Islands.
Footnotes
Authors' Contributions
M.D.M. PhD student, planned the study, collected data, analyzed data, and wrote the manuscript. K.G.K., PhD supervisor, planned the study, analyzed data, and wrote the manuscript. S.G. supervised the work and wrote the manuscript. H.G. planned and did the statistics together with M.D.M. and he wrote the manuscript. All authors read and approved the final manuscript.
Acknowledgments
The authors wish to thank Hjørdis Reinert, Tórshavn, Faroe Islands, for the help in sampling the E. coli isolates, the 12 general practitioners (GPs) in the Faroe Islands for sampling the E. coli isolates, Helga Erlendsdóttir, Reykjavík, Iceland, for the advice and support in data sampling and data analyses, and Amanda Gratton Vang, PhD researcher, for proofreading the manuscript. This work was supported by a grant from the Faroese research Council, BP Amoco, Chevron Texaco, Eik Vísindagrunninum, and SSAC foundation.
Disclosure Statement
No competing financial interests exist.