
Abstract
Coagulase-negative staphylococci (CNS) are important pathogens causing nosocomial infections worldwide with increasing resistance to antimicrobials. The aim of this study was to characterize resistance aspects of CNS isolated from patients with bloodstream infections acquired in hospitals in Belo Horizonte, MG, Brazil. Staphylococcus strains were characterized using repetitive sequence-based polymerase chain reaction (rep-PCR) fingerprinting with (GTG)5 primer. Phenotypic resistance was analyzed using AST-P5085 card (bioMérieuxVitek®). PCR was used to detect mecA, vanA, blaZ, ermA/B/C, aac-aphD, and SCC-mec. For statistical analyses, we used hierarchical cluster, chi-square test (χ2), and correspondence. Several clusters were formed within the same species using (GTG)5 primer, and strains showed resistance to the following antimicrobials: benzylpenicillin (100%); oxacillin (93.1%); gentamicin (36.3%); ciprofloxacin (63.7%); moxifloxacin (32.7%); norfloxacin (81.0%); erythromycin (86.2%); clindamycin (75.8%); linezolid, teicoplanin and vancomycin (1.7%); tigecycline (0%); fusidic acid (10.35%); rifampicin (13.7%); and trimethoprim/sulfamethoxazole (46.5%). Regarding genotypic analyses, 40%, 0%, 78%, 42%, 100%, 24%, and 30% were positive for mecA, vanA, blaZ, ermA, ermB, ermC, and aac-aphD, respectively. Regarding staphylococcal cassette mec (SCCmec) type, 3.4% presented type I; 5.0% type II; 27.1% type III; 20.3% type IIIA; and 32.2% type IIIB. Six clusters were formed and frequency distributions of resistant strains to oxacillin, gentamicin, ciprofloxacin, moxifloxacin, norfloxacin, erythromycin, clindamycin, linezolid, teicoplanin, vancomycin, fusidic acid, rifampicin, and trimethoprim/sulfamethoxazole, and mecA, blaZ, ermC, aac-aphD, and SCCmec type differed (p < 0.001). In conclusion, the strains investigated in this study were multidrug resistant and carried multiple antibiotic resistance genes.
Introduction
C
This can be explained as CNS and can easily acquire antibiotic resistance genes through conjugative plasmids, which can transfer these determinants between species and genera. 6 In this way, CNS constitute a dangerous group in hospitals, since they can be human pathogens and resistance reservoir genes to more virulent bacteria.
The most often identified resistance mechanisms in Staphylococcus are enzymatic inactivation of antibiotics (e.g., expressed by the genes blaZ, ermA, ermB, ermC, and aac-apD), active removal of antibiotics from the cell (e.g., efflux mechanisms pumps), and reduction of the antibiotic binding affinity to the drug. 1
Resistance to methicillin/oxacillin can be mediated by the mecA gene, which encodes an additional penicillin binding protein and is inserted into a mobile gene element, called the staphylococcal cassette mec (SCCmec).7,8
The SCCmec cassette has two components: mecA gene complex and ccr gene. The mecA gene complex consists of mecA, regulatory genes, and an associated insertion sequence. The ccr gene encodes a recombinase that mediates the integration and excision of SCCmec to and from the chromosome. Moreover, ccr gene together with the other flanking genes constitutes the ccr complex. 7 Additional penicillin binding protein (PBP2a), formed by the mecA gene, has a size of 78 kDa and provides a considerable reduction in the affinity to the β-lactam antimicrobial. 9
Since CNS have emerging profile as multidrug-resistant microorganisms and this phenomenon requires systematic monitoring, our aim was to determine the susceptibility of CNS species to antimicrobial agents and the main genotypic factors involved.
Materials and Methods
Bacterial strains and ethics parameters
This study evaluated 58 CNS strains obtained from blood cultures during a period between December 2008 and June 2009 from five hospitals that provide general assistance and emergency and outpatient care in Belo Horizonte city, Minas Gerais state, Brazil. The study was approved by the Research Ethics Committees of the participating services and by the Ethics Committee in Research of the Federal University of Minas Gerais (COEP/UFMG—ETIC 614/08), and was conducted in accordance with the Helsinki Declaration.
CNS samples were isolated from at least two blood culture bottles from intensive care center patients. Clinical criteria for bloodstream infection were determined by the physicians responsible for patients in each institution.
Phenotypic resistance analysis
The antimicrobial automated susceptibility test was carried out using an AST-P5085 identification card (bioMérieux Vitek®), according to manufacturer's specification. The antimicrobials in AST-P5085 are as follows: ampicillin, ampicillin/sulbactam, amikacin, aztreonam, ceftazidime, cefepime, cefotetan, ceftriaxone, cefuroxime, ciprofloxacin, gentamicin, imipenem, levofloxacin, meropenem, nitrofurantoin, piperacillin, piperacillin/tazobactam, sulfamethoxazole/trimethoprim, and tobramycin.
Molecular characterization of genes related to antimicrobial resistance
The bacterial DNA was extracted according to methodology previously described. 10 The supernatant DNA was quantified using a NanoDrop spectrophotometer and stored at −20°C until use. Polymerase chain reaction (PCR) assays were used to detect the presence of genes related to antimicrobial resistance (mecA, vanA, blaZ, ermA, ermB, ermC, aac-aphD, and chromosomal cassette SCCmec) according to methodology previously described11–15 (Tables 1 and 2). All reactions were conducted using PCR Pré-Mix (Phoneutria, Belo Horizonte, Brazil), except evaluation of SCCmec type, which was conducted using PCR Master Mix (Promega®, Madison, WI) according to the manufacturer's recommendation. For all molecular analyses, references strains were used as positive controls.
Repetitive sequence-based PCR fingerprinting
The repetitive sequence-based PCR (rep-PCR) fingerprinting was performed as described previously 16 with some modifications. Briefly, isolated DNA was amplified using the (GTG)5 primer (5′-GTGGTGGTGGTGGTG-3′) with PCR Master Mix (Promega). Initial denaturation (94°C for 7 min) was followed by 30 cycles of denaturation (94°C for 1 min), primer annealing (40°C for 1 min), and extension (72°C for 8 min). The last cycle was followed by the final extension step (72°C for 16 min). PCR products that were obtained were separated for 16 hrs at 1.55 V/cm in 1.5% (w/v) agarose gels (20 × 25 cm) containing ethidium bromide (0.5 g/ml). A molecular weight marker of 1 kb (1 kb DNA ladder—Promega) was used to enable normalization of gel images. The resulting fingerprints were visualized under ultraviolet light (302 nm), digitized, and processed using GelJ software. A dendrogram was constructed using Pearson's correlation coefficients with clustering using the unweighted pair-group method with arithmetic averages.
Statistical analysis
A hierarchical cluster analysis was performed using SPSS.15.0 for Windows software (SPSS, Inc., Chicago, IL) to identify groups of samples with different phenotypic and genotypic antimicrobial resistance profiles. The Euclidian distance between each pair of observations was used as an instrument to measure similarity between groups and the Ward hierarchical clustering method was used to group similar strains.17,18
The hierarchical cluster analysis involves three separate phases. The first phase divides the total strain into smaller subgroups. The second phase verifies if the groups are significantly different and theoretically significant. The third phase generates the profile of the clusters, describing the characteristics of each in terms of phenotypic and genotypic antimicrobial resistance aspects.17,18 Examination was conducted to the point where the error variances were reduced as passing from a smaller to a larger number of clusters.17,18
The chi-square test was applied to evaluate the frequency distributions of phenotypic and genotypic antimicrobial resistance aspects and the clusters at a significance level of 5%. 19
Correspondence analysis was carried out using the SAS System for Windows 9.2 software (Statistical Analysis System; SAS Institute, Inc., Cary, NC) at a significance level of 5%. This analysis visualized the relationship between the phenotypic and genotypic antimicrobial resistance aspects and the clusters; in this exploratory and descriptive technique, the characteristics and clusters are represented spatially, providing a perceptual map. 19
Results
Bacterial strains
A total of 58 strains belonging to seven species of genus Staphylococcus were analyzed: 32.2% (19) were identified as Staphylococcus haemolyticus, 23.7% (14) as Staphylococcus epidermidis and the same number as Staphylococcus hominis, 11.8% (7) belonging to species Staphylococcus warneri, 3.3% (2) to Staphylococcus equorum, and 1.6% and 1.6% (1) as Staphylococcus auricularis and Staphylococcus cohnii. 19
CNS strains were multidrug resistant
The isolated strains showed a multidrug-resistant profile: 100% were resistant to benzylpenicillin; 93.1% to oxacillin; 36.3% to gentamicin; 63.7% to ciprofloxacin; 32.7% to moxifloxacin; 81% to norfloxacin; 86.2% to erythromycin; 75.8% to clindamycin; 1.7% to linezolid, teicoplanin, and vancomycin; all the strains were sensitive to tigecycline; 10.35% were resistant to fusidic acid; 13.7% to rifampicin; and 46.5% to trimethoprim/sulfamethoxazole (Fig. 1).
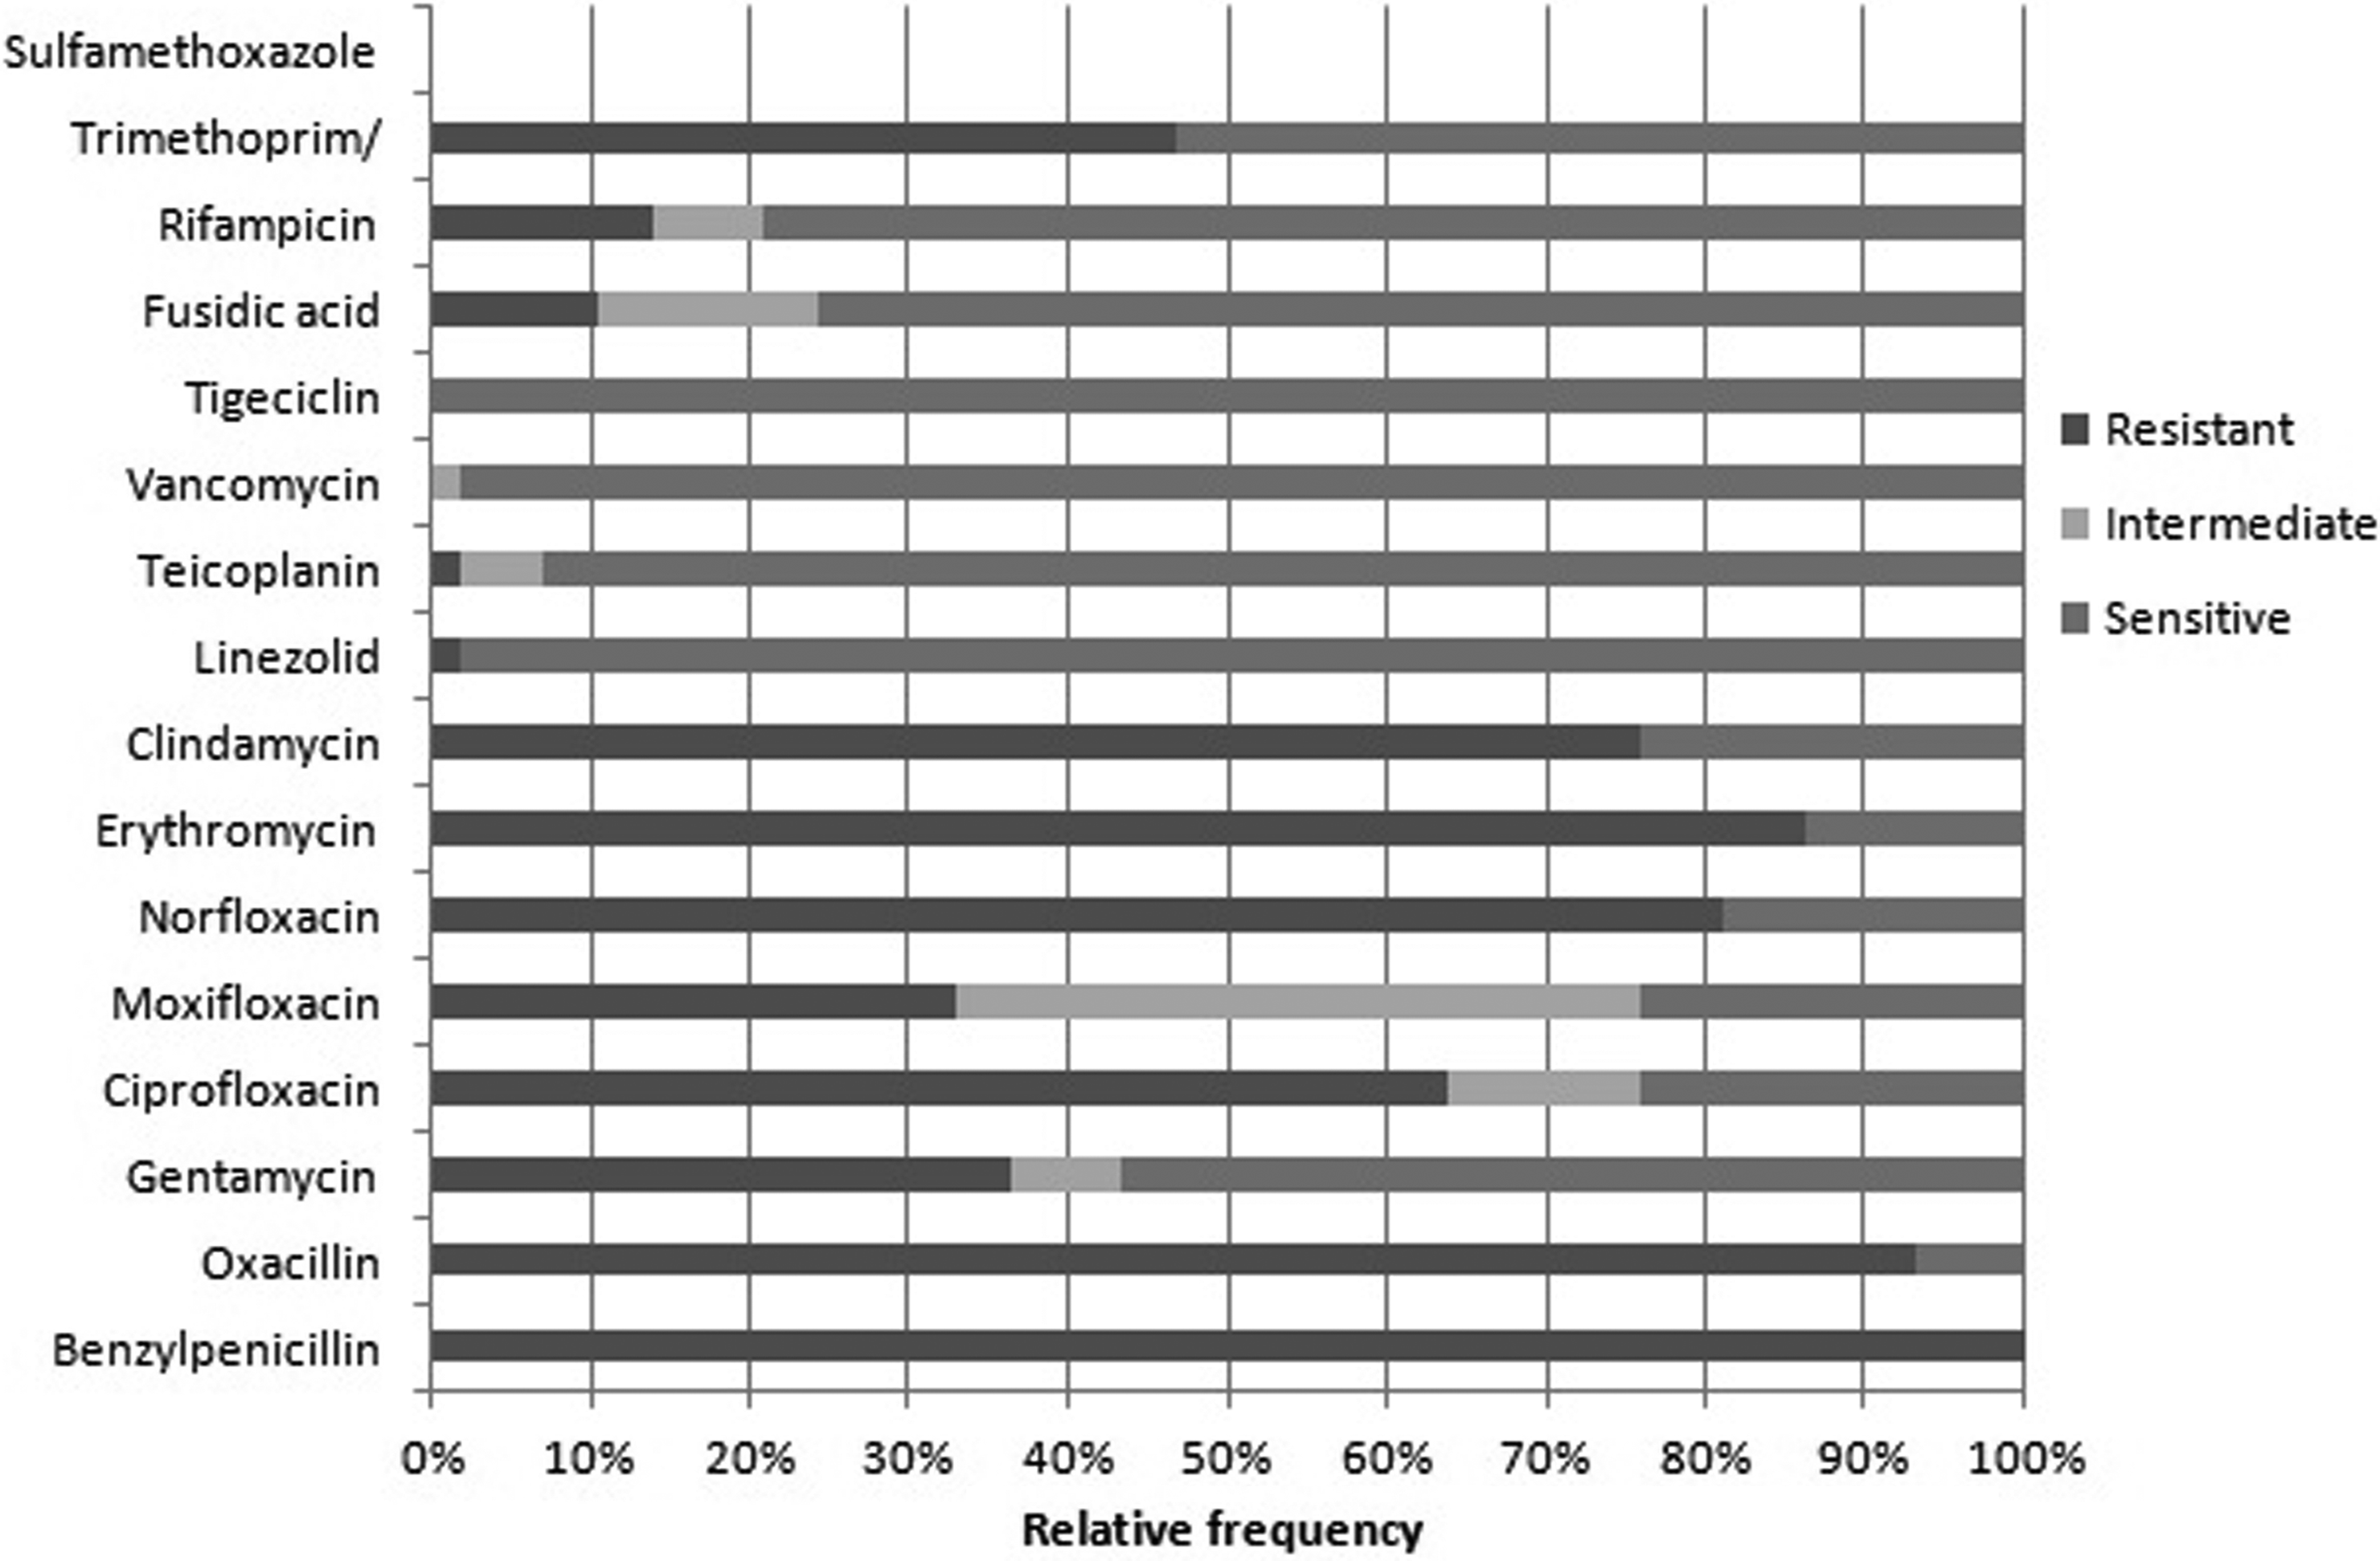
Relative frequency of antimicrobial resistant samples—benzylpenicillin (100%); oxacillin (93.1%); gentamycin (36.3%); ciprofloxacin (63.7%); moxifloxacin (32.7%); norfloxacin (81.0%); erythromycin (86.2%); clindamycin (75.8%); linezolid, teicoplanin, and vancomycin (1.7%); tigecycline (0%); fusidic acid (10.35%); rifampicin (13.7%); trimethoprim/sulfamethoxazole (46.5%).
According to the resistance profile for each species studied, we observed that for S. haemolyticus, the relative frequency of resistant samples was as follows: benzylpenicillin (100%); oxacillin (84%); gentamicin (68%); ciprofloxacin (68%); moxifloxacin (32%); norfloxacin (79%); erythromycin (76.3%); clindamycin (95%); linezolid, teicoplanin, and vancomycin (0%); tigecycline (0%); fusidic acid (11%); rifampicin (0%); and trimethoprim/sulfamethoxazole (63%). For S. epidermidis: benzylpenicillin (100%); oxacillin (85.7%); gentamicin (35.7%); ciprofloxacin (64.2%); moxifloxacin (35.7%); norfloxacin (78.5%); erythromycin (64.2%); clindamycin (78.5%); linezolid, teicoplanin (0%); vancomycin (7% of intermediate resistance); tigecycline (0%); fusidic acid (7%); rifampicin (14.2%); and trimethoprim/sulfamethoxazole (64.2%). For S. hominis: benzylpenicillin (100%); oxacillin (78.5%); gentamicin (14.2%); ciprofloxacin (57%); moxifloxacin (28.5%); norfloxacin (85.7%); erythromycin (78.5%); clindamycin (78.5%); linezolid and teicoplanin (7%); vancomycin (0%); tigecycline (0%); fusidic acid (7%); rifampicin (28.5%); and trimethoprim/sulfamethoxazole (14.2%). For S. warneri: benzylpenicillin (100%); oxacillin (57.4%); gentamicin (14.28%); ciprofloxacin (29%); moxifloxacin (0%); norfloxacin (28.5%); erythromycin (57%); clindamycin (43%); linezolid, teicoplanin and vancomycin (0%); tigecycline (0%); fusidic acid (0%); rifampicin (28.5%); and trimethoprim/sulfamethoxazole (28.5%). For S. equorum benzylpenicillin (100%); oxacillin (50%); gentamicin (0%); ciprofloxacin (100%); moxifloxacin (28.5%); norfloxacin (100%); erythromycin (100%); clindamycin (100%); linezolid, teicoplanin and vancomycin (1.7%); tigecycline (0%); fusidic acid (100%); rifampicin (0%); and trimethoprim/sulfamethoxazole (0%). For S. auricularis benzylpenicillin (100%); oxacillin (100%); gentamicin (0%); ciprofloxacin (0%); moxifloxacin (0%); norfloxacin (100%); erythromycin (100%); clindamycin (100%); linezolid, teicoplanin and vancomycin (0%); tigecycline (0%); fusidic acid (0%); rifampicin (0%); and trimethoprim/sulfamethoxazole (0%). For S. cohnii benzylpenicillin (100%); oxacillin (100%); gentamicin (0%); ciprofloxacin (100%); moxifloxacin (100%); norfloxacin (100%); erythromycin (100%); clindamycin (100%); linezolid, teicoplanin and vancomycin (0%); tigecycline (0%); fusidic acid (100%); rifampicin (0%); and trimethoprim/sulfamethoxazole (0%) (Fig. 2).
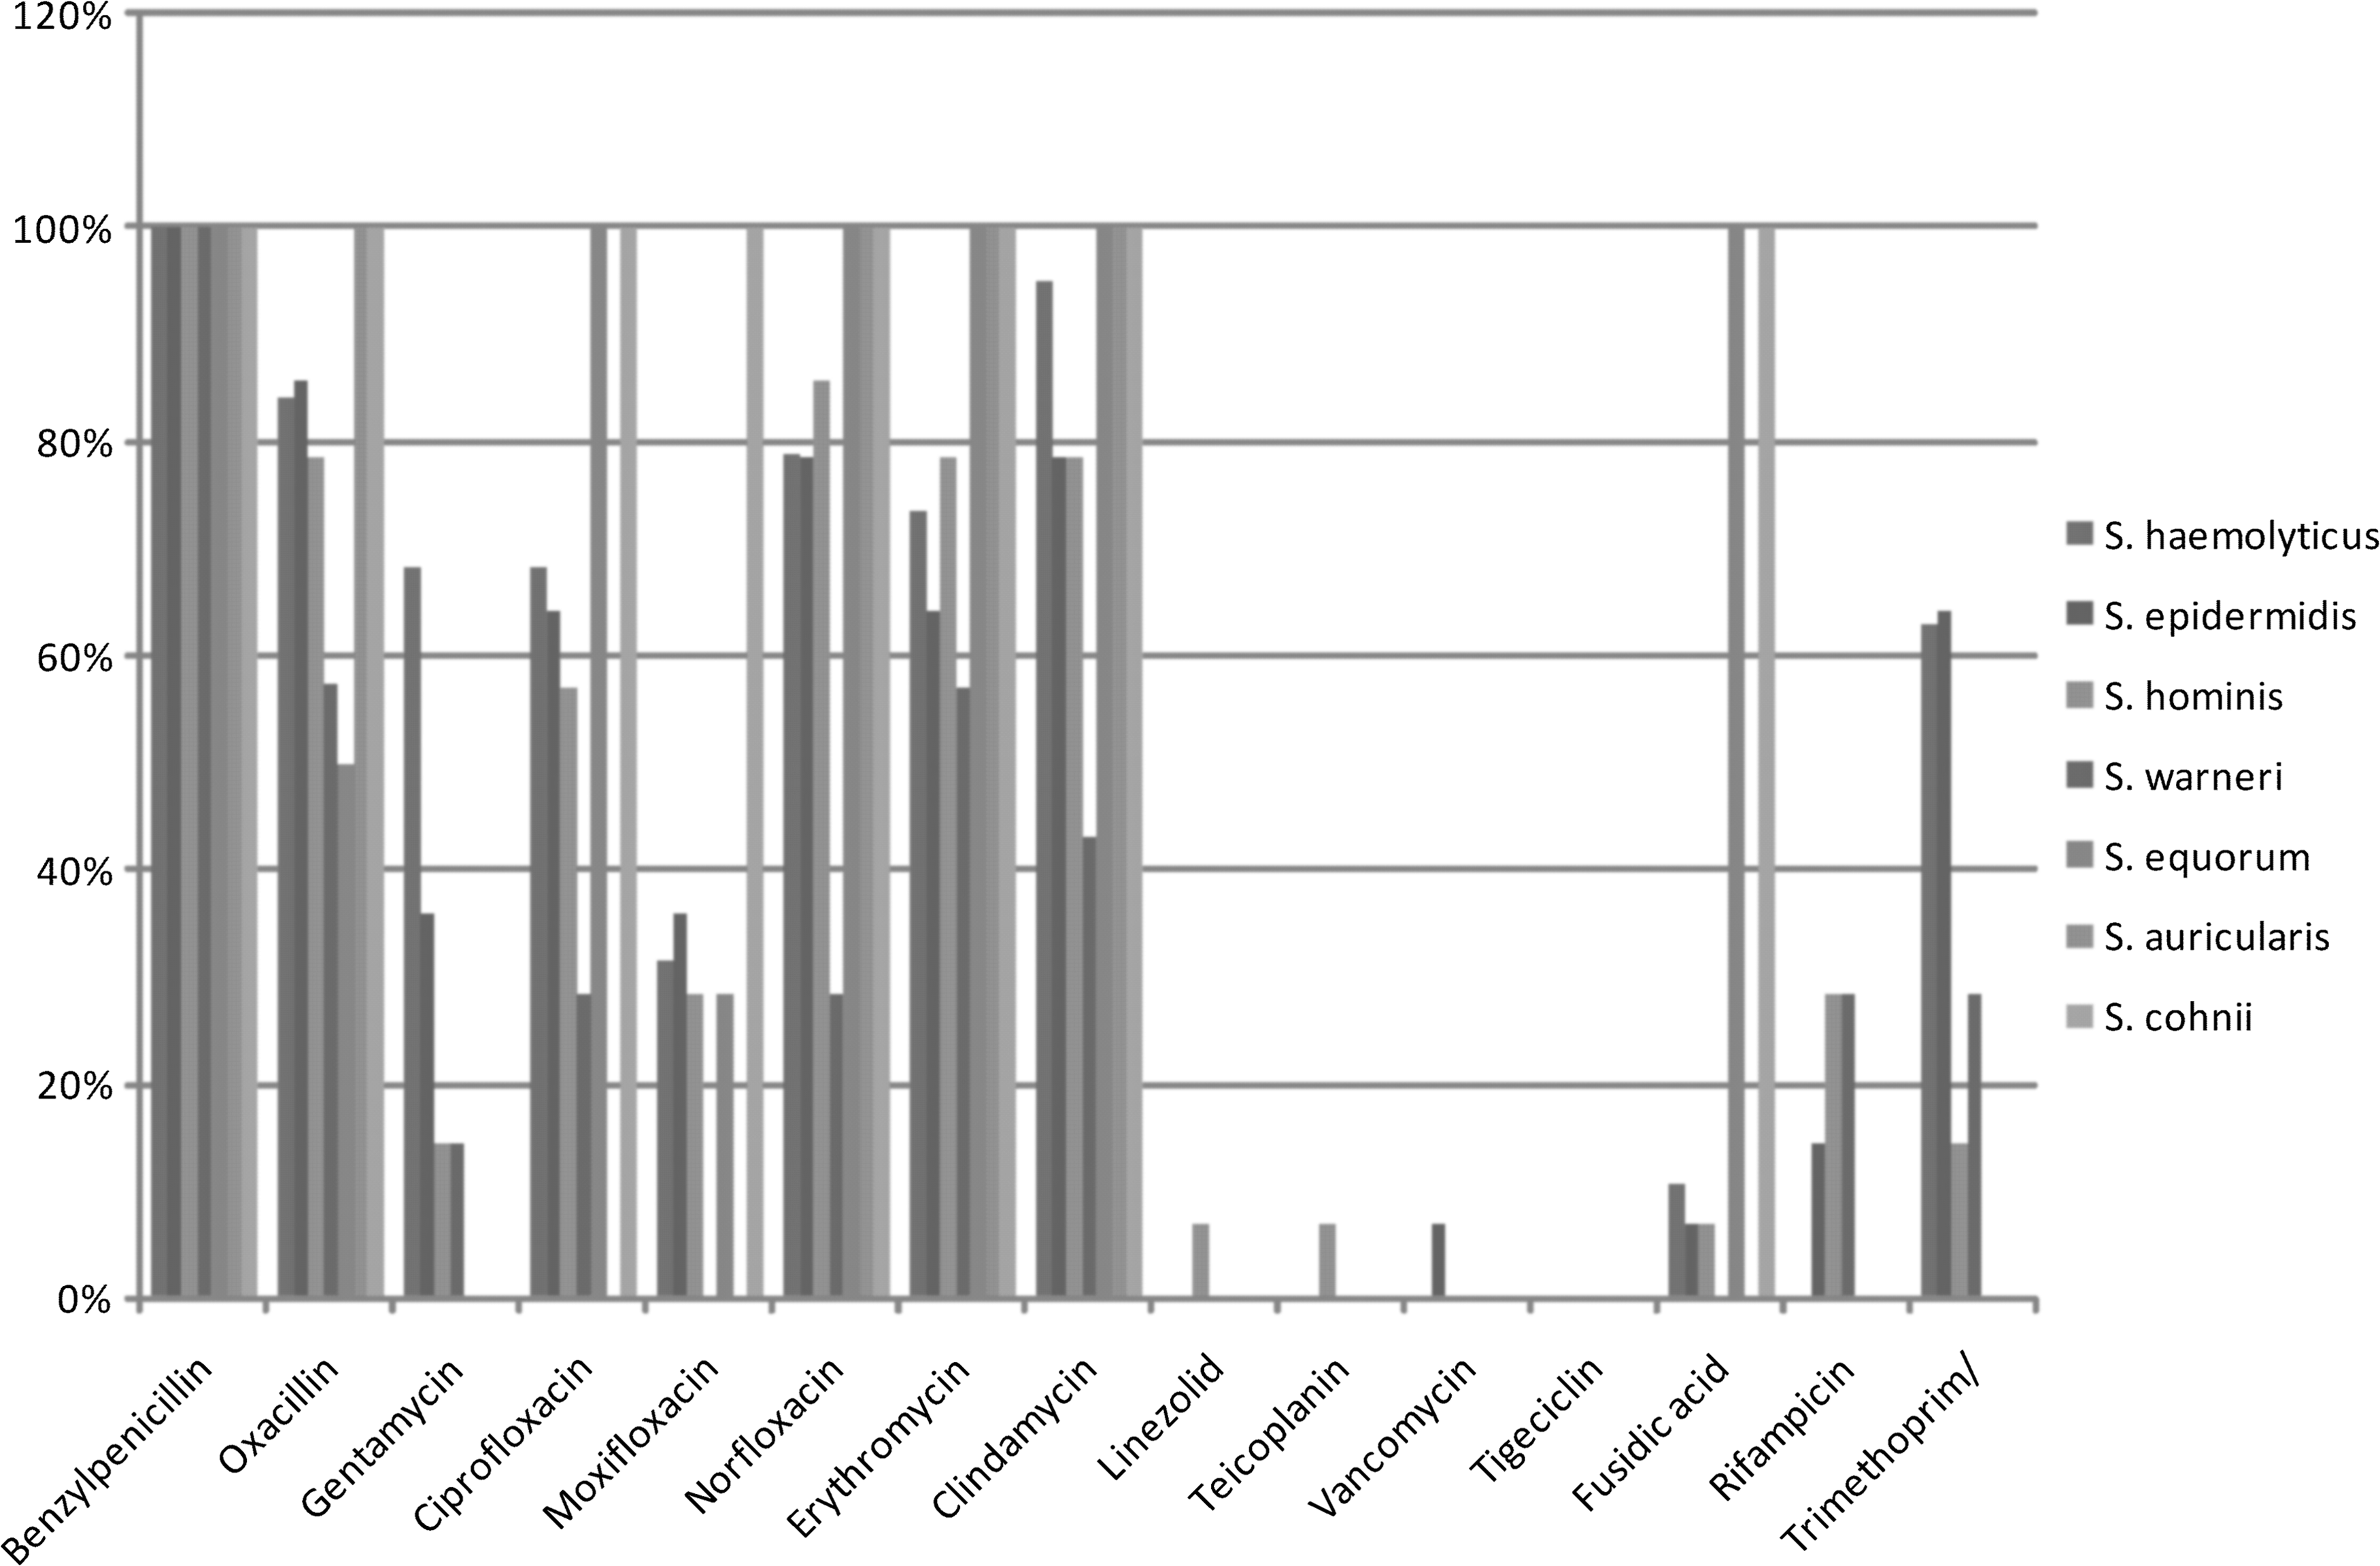
Relative frequency of antimicrobial resistance for each species studied—Staphylococcus haemolyticus: benzylpenicillin (100%); oxacillin (84%); gentamicin (68%); ciprofloxacin (68%); moxifloxacin (32%); norfloxacin (79%); erythromycin (76.3%); clindamycin (95%); linezolid, teicoplanin, and vancomycin (0%); tigecycline (0%); fusidic acid (11%); rifampicin (0%); and trimethoprim/sulfamethoxazole (63%). Staphylococcus epidermidis: benzylpenicillin (100%); oxacillin (85.7%); gentamicin (35.7%); ciprofloxacin (64.2%); moxifloxacin (35.7%); norfloxacin (78.5%); erythromycin (64.2%); clindamycin (78.5%); linezolid, teicoplanin (0%); vancomycin (7%); tigecycline (0%); fusidic acid (7%); rifampicin (14.2%); and trimethoprim/sulfamethoxazole (64.2%). Staphylococcus hominis: benzylpenicillin (100%); oxacillin (78.5%); gentamicin (14.2%); ciprofloxacin (57%); moxifloxacin (28.5%); norfloxacin (85.7%); erythromycin (78.5%); clindamycin (78.5%); linezolid and teicoplanin (7%); vancomycin (0%); tigecycline (0%); fusidic acid (7%); rifampicin (28.5%); and trimethoprim/sulfamethoxazole (14.2%). Staphylococcus warneri: benzylpenicillin (100%); oxacillin (57.4%); gentamicin (14.28%); ciprofloxacin (29%); moxifloxacin (0%); norfloxacin (28.5%); erythromycin (57%); clindamycin (43%); linezolid, teicoplanin, and vancomycin (0%); tigecycline (0%); fusidic acid (0%); rifampicin (28.5%); and trimethoprim/sulfamethoxazole (28.5%). Staphylococcus equorum: benzylpenicillin (100%); oxacillin (50%); gentamicin (0%); ciprofloxacin (100%); moxifloxacin (28.5%); norfloxacin (100%); erythromycin (100%); clindamycin (100%); linezolid, teicoplanin, and vancomycin (1.7%); tigecycline (0%); fusidic acid (100%); rifampicin (0%); and trimethoprim/sulfamethoxazole (0%). Staphylococcus auricularis: benzylpenicillin (100%); oxacillin (100%); gentamicin (0%); ciprofloxacin (0%); moxifloxacin (0%); norfloxacin (100%); erythromycin (100%); clindamycin (100%); linezolid, teicoplanin, and vancomycin (0%); tigecycline (0%); fusidic acid (0%); rifampicin (0%); and trimethoprim/sulfamethoxazole (0%). Staphylococcus cohnii: benzylpenicillin (100%); oxacillin (100%); gentamicin (0%); ciprofloxacin (100%); moxifloxacin (100%); norfloxacin (100%); erythromycin (100%); clindamycin (100%); linezolid, teicoplanin, and vancomycin (0%); tigecycline (0%); fusidic acid (100%); rifampicin (0%); and trimethoprim/sulfamethoxazole (0%).
The strains analyzed had a high prevalence of the genes blaZ and ermB: the most frequent type of SCCmec was type III
We investigated the presence of genes related to antimicrobial resistance: 40% were positive for mecA; 0% was positive for vanA; 78% were positive for blaZ; 42% were positive for ermA; 100% were positive for ermB; 24% were positive for ermC, and 30% were positive for aac-aphD (Fig. 3).
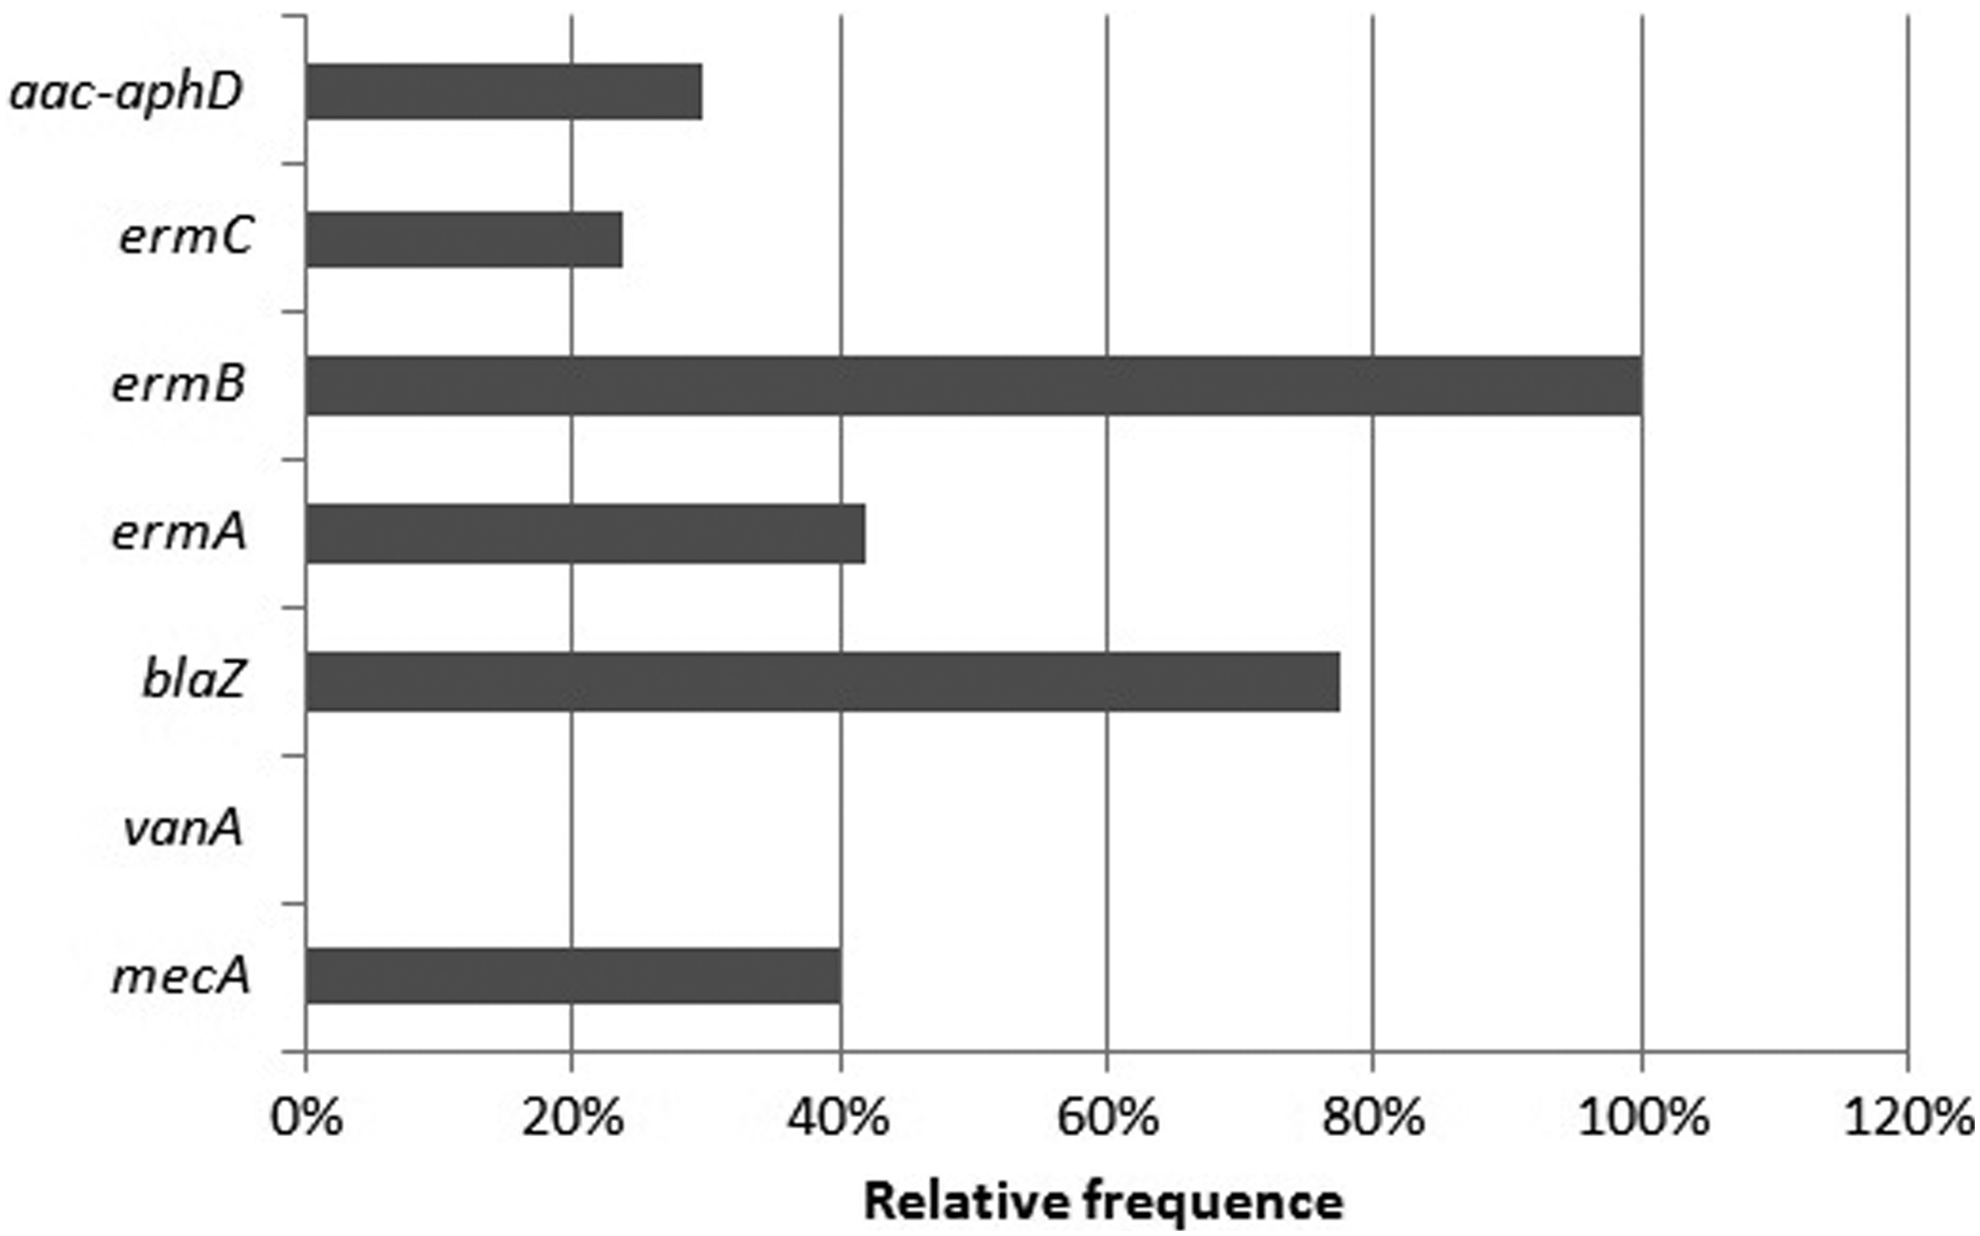
Relative frequency of resistance genes—40% were positive for mecA; 0% were positive for vanA; 78% were positive for blaZ; 42% were positive for ermA; 100% were positive for ermB; 24% were positive for ermC; and 30% were positive for aac-aphD.
According to the resistance genes profile for each species studied, we observed that for S. haemolyticus, the relative frequency of positive samples was as follows: mecA (47.3%); vanA (0%), blaZ (95%); ermA (47.3%); ermB (100%); ermC (31.5%); and aac-aphD (47.3%). For S. epidermidis: mecA (21.4%); vanA (0%), blaZ (64.2%); ermA (57%); ermB (100%); ermC (42.8%); and aac-aphD (28.5%). For S. hominis: mecA (42.8%); vanA (0%), blaZ (57%); ermA (35.7%); ermB (100%); ermC (7%); and aac-aphD (28.5%). For S. warneri: mecA (42.8%); vanA (0%), blaZ (71.4%); ermA (14.2%); ermB (100%); ermC (14.2%); and aac-aphD (28.5%). For S. equorum: mecA (50%); vanA (0%), blaZ (100%); ermA (100%); ermB (100%); ermC (0%); and aac-aphD (50%). For S. auricularis: mecA (0%); vanA (0%), blaZ (0%); ermA (0%); ermB (100%); ermC (0%); and aac-aphD (0%). For S. cohnii: mecA (100%); vanA (0%), blaZ (100%); ermA (0%); ermB (100%); ermC (0%); and aac-aphD (0%) (Fig. 4).
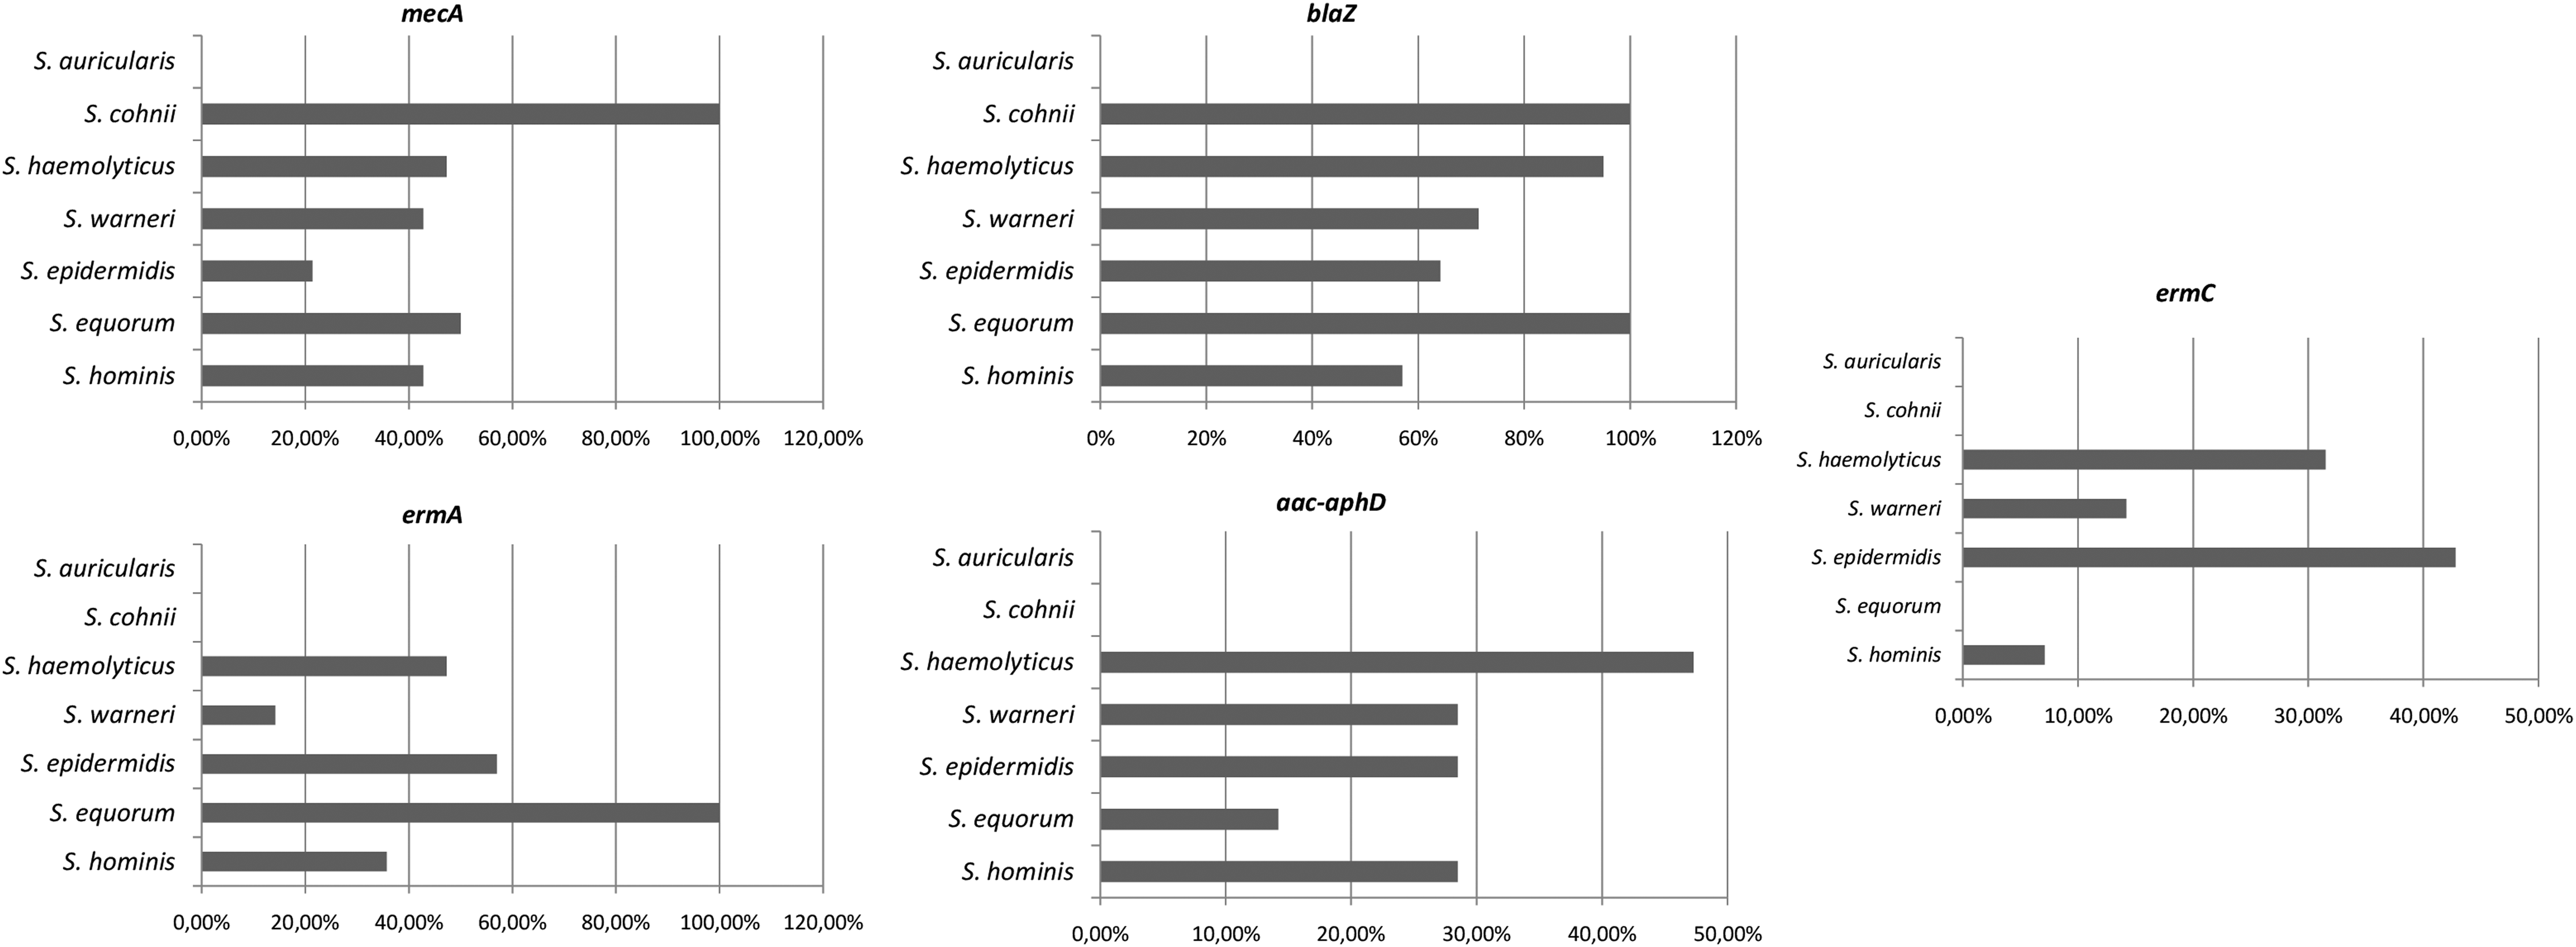
Relative frequency of resistance genes for each species studied—S. haemolyticus: mecA (47.3%); vanA (0%), blaZ (95%); ermA (47.3%); ermB (100%); ermC (31.5%); and aac-aphD (47.3%). S. epidermidis: mecA (21.4%); vanA (0%), blaZ (64.2%); ermA (57%); ermB (100%); ermC (42.8%); and aac-aphD (28.5%). S. hominis: mecA (42.8%); vanA (0%), blaZ (57%); ermA (35.7%); ermB (100%); ermC (7%); and aac-aphD (28.5%). S. warneri: mecA (42.8%); vanA (0%), blaZ (71.4%); ermA (14.2%); ermB (100%); ermC (14.2%); and aac-aphD (28.5%). S. equorum: mecA (50%); vanA (0%), blaZ (100%); ermA (100%); ermB (100%); ermC (0%); and aac-aphD (50%). S. auricularis: mecA (0%); vanA (0%), blaZ (0%); ermA (0%); ermB (100%); ermC (0%); and aac-aphD (0%). S. cohnii: mecA (100%); vanA (0%), blaZ (100%); ermA (0%); ermB (100%); ermC (0%); and aac-aphD (0%).
Regarding the SCCmec type, 3.4% of the strains presented type I; 5.0% presented type II; 27.1% presented type III; 20.3% presented type IIIA; and 32.2% presented type IIIB (Fig. 5).
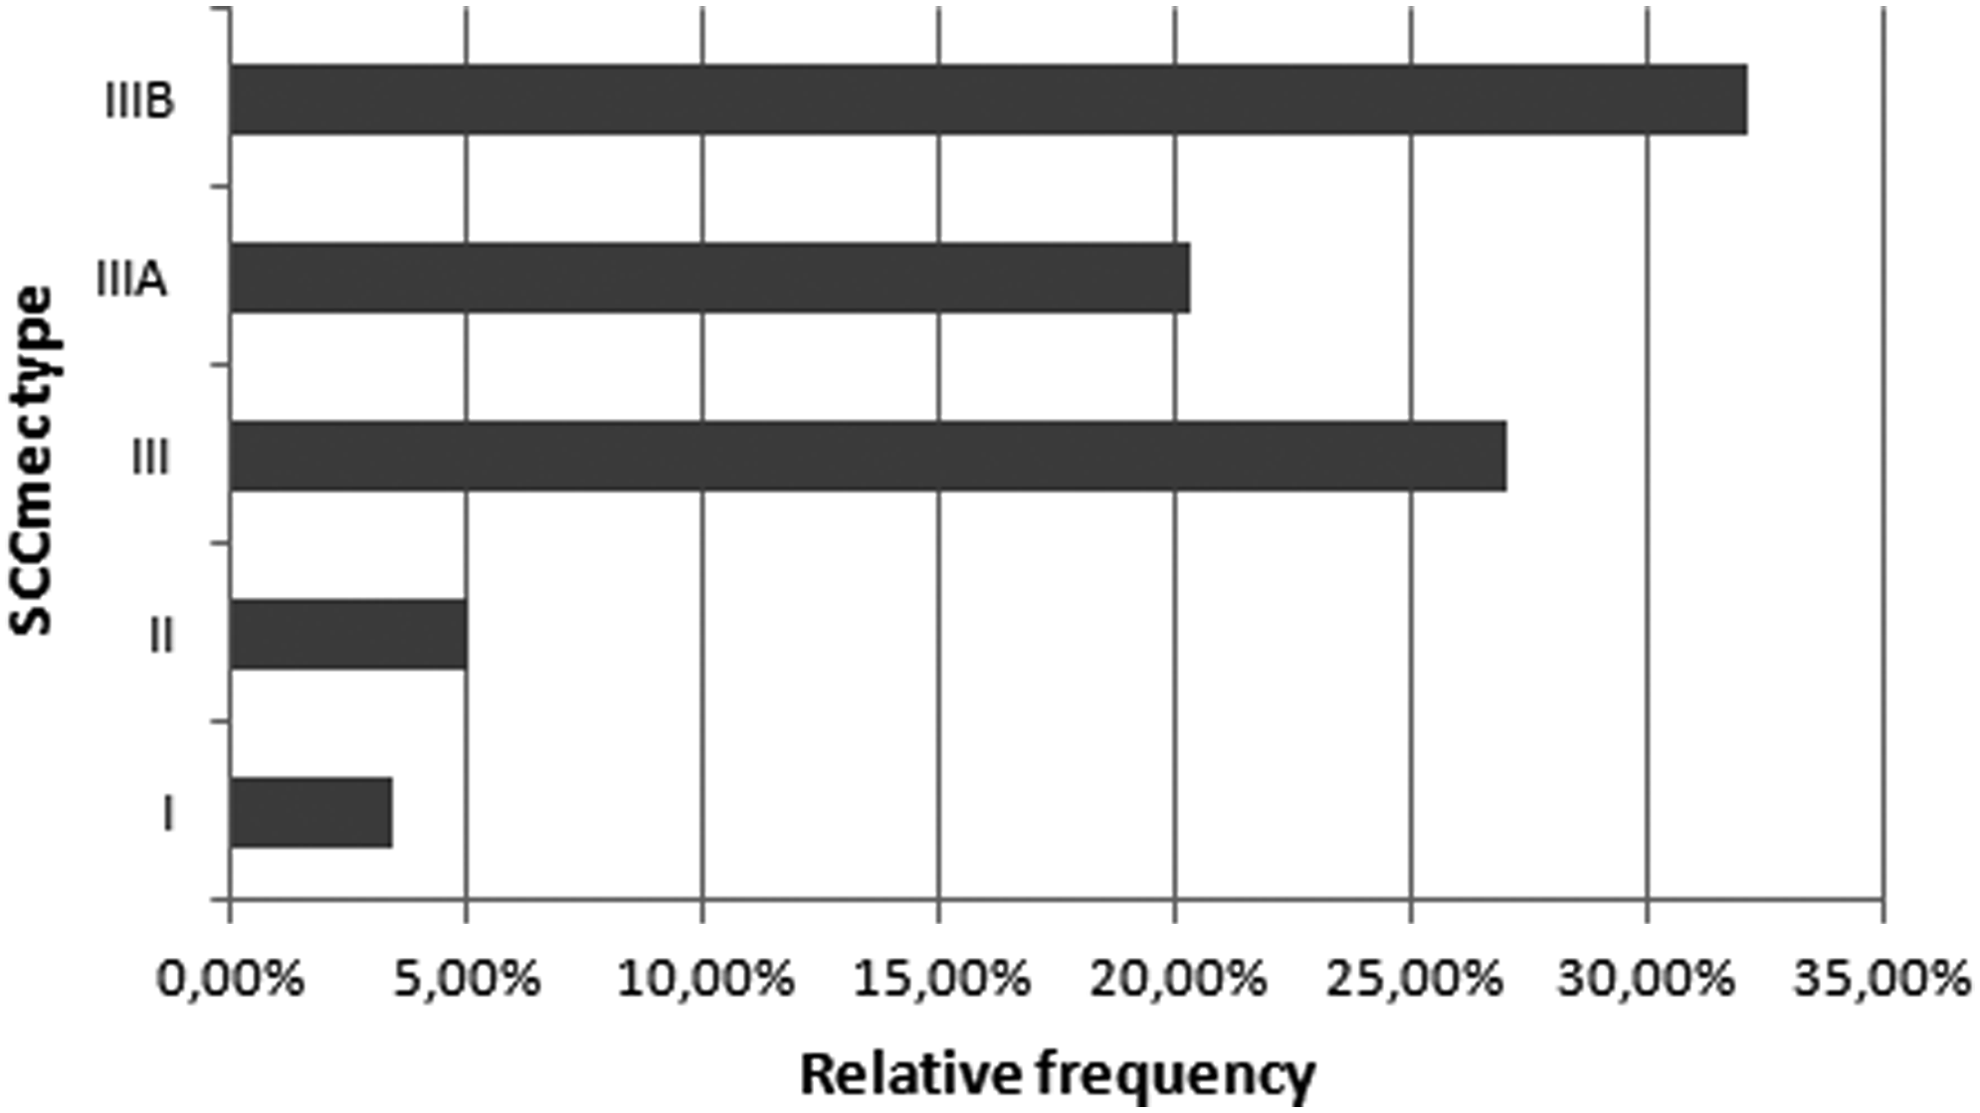
Relative frequency of SCCmec type—3.4% of the strains presented type I; 5.0% presented type II; 27.1% presented type III; 20.3% presented type IIIA; and 32.2% presented type IIIB. SCCmec, staphylococcal cassette mec.
Regarding the SCCmec type for each species studied, we observed that for S. haemolyticus, the relative frequency was as follows: I (5.2%); II (5.2%); III (31.50%); IIIA (10.5%); and IIIB (42%). For S. epidermidis: I (0%); II (7%); III (14.2%); IIIA (28.5%); and IIIB (28.5%). For S. hominis: I (0%); II (0%); III (42.8%); IIIA (35.7%); and IIIB (21.4%). For S. equorum: I (0%); II (0%); III (50%); IIIA (0%); and IIIB (50%). For S. auricularis: I (0%); II (0%); III (0%); IIIA (0%); and IIIB (100%). For S. cohnii: I (0%); II (0%); III (0%); IIIA (100%); and IIIB (0%) (Fig. 6).
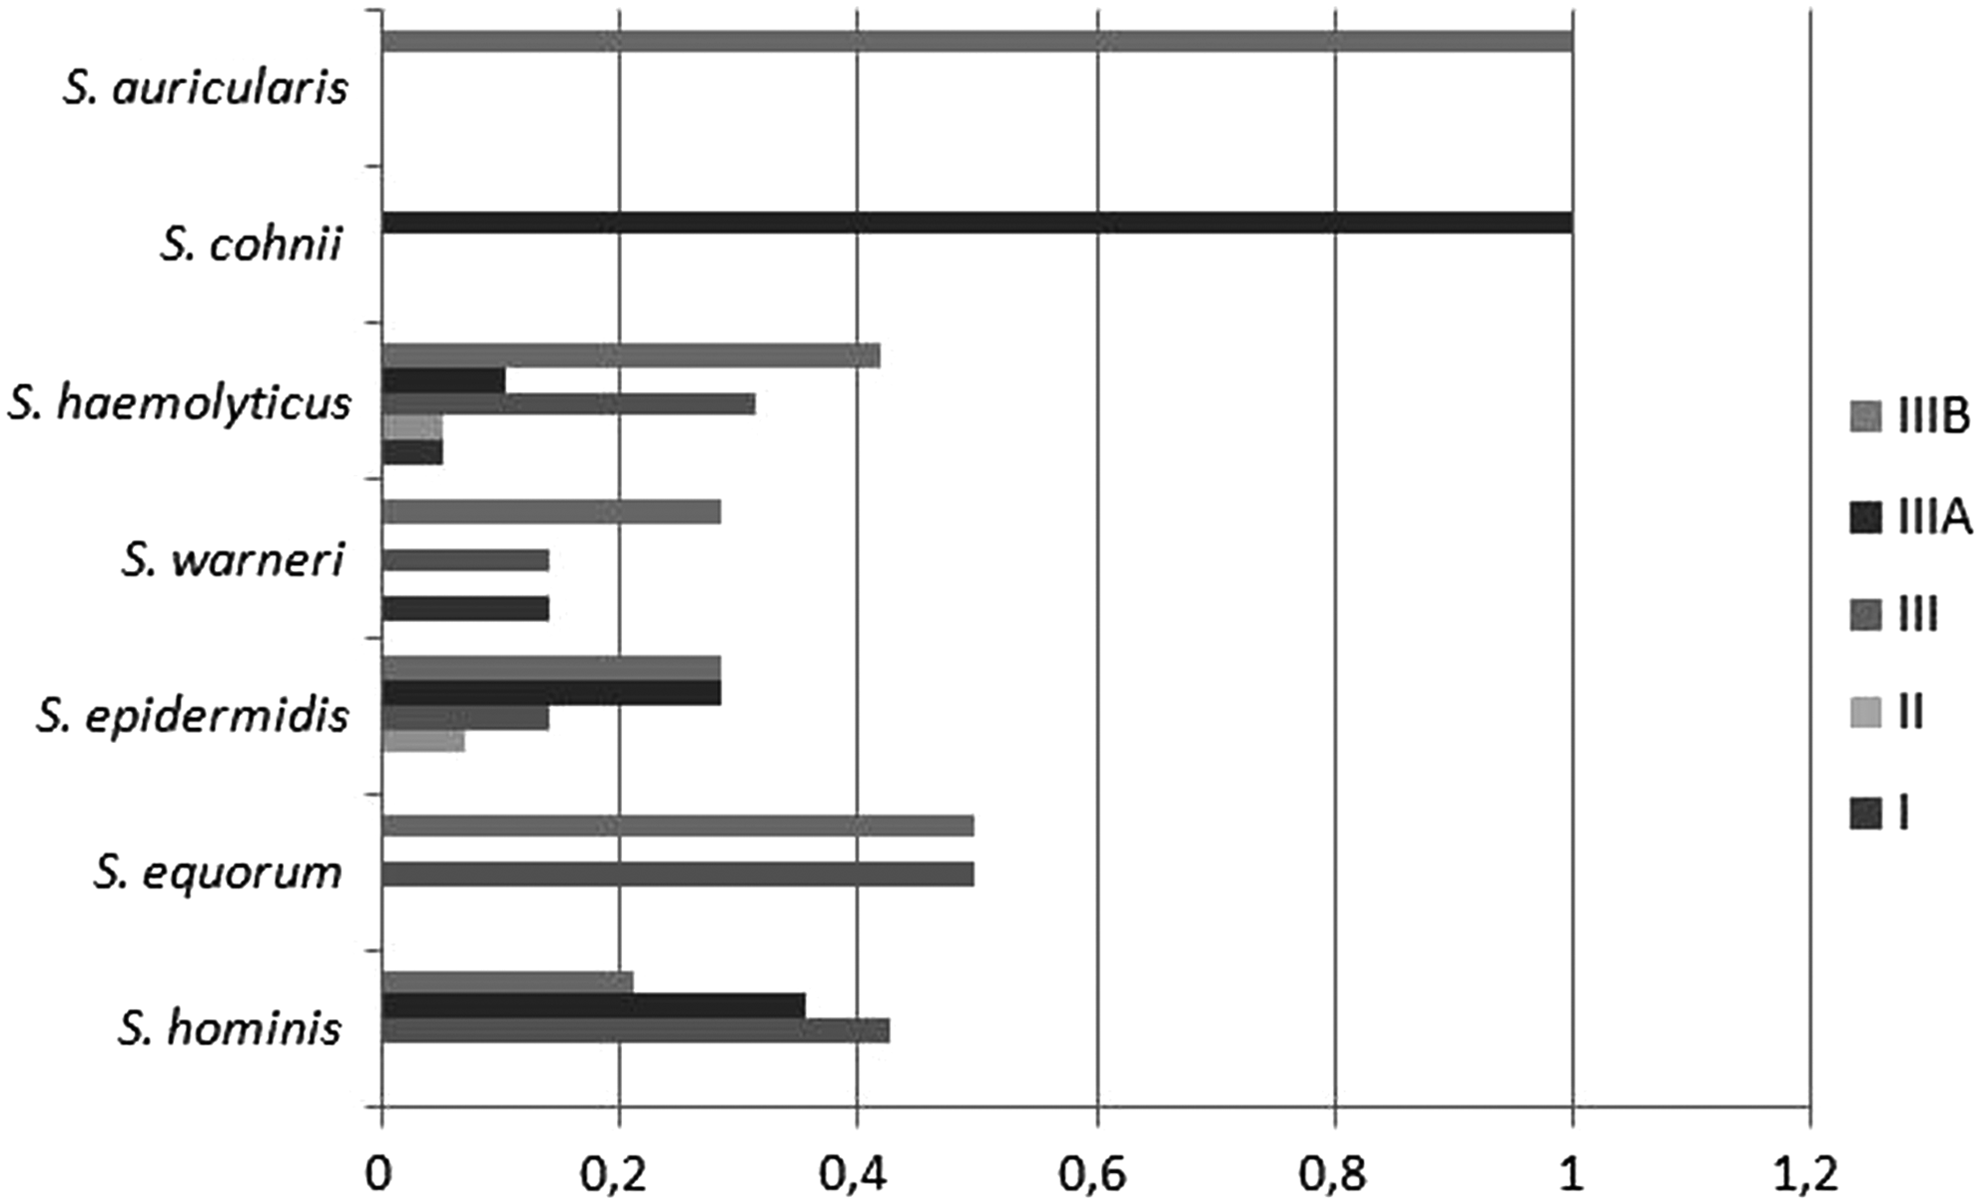
Relative frequency of SCCmec types for each species studied—S. haemolyticus: I (5.2%); II (5.2%); III (31.50%); IIIA (10.5%); and IIIB (42%). S. epidermidis: I (0%); II (7%); III (14.2%); IIIA (28.5%); and IIIB (28.5%). S. hominis: I (0%); II (0%); III (42.8%); IIIA (35.7%); and IIIB (21.4%). S. equorum: I (0%); II (0%); III (50%); IIIA (0%); and IIIB (50%). S. auricularis: I (0%); II (0%); III (0%); IIIA (0%); and IIIB (100%). For S. cohnii: I (0%); II (0%); III (0%); IIIA (100%); and IIIB (0%).
Rep-PCR fingerprinting showed numerous clusters within the same species
All of the strains analyzed were typeable using the (GTG)5 primer and PCR products ranged from 250 to 5,000 bp. The majority of strains showed a close fingerprint profile. However, variability in the presence of some bands influenced the final cluster analysis of the group and numerous clusters were formed within the same species (Fig. 7).
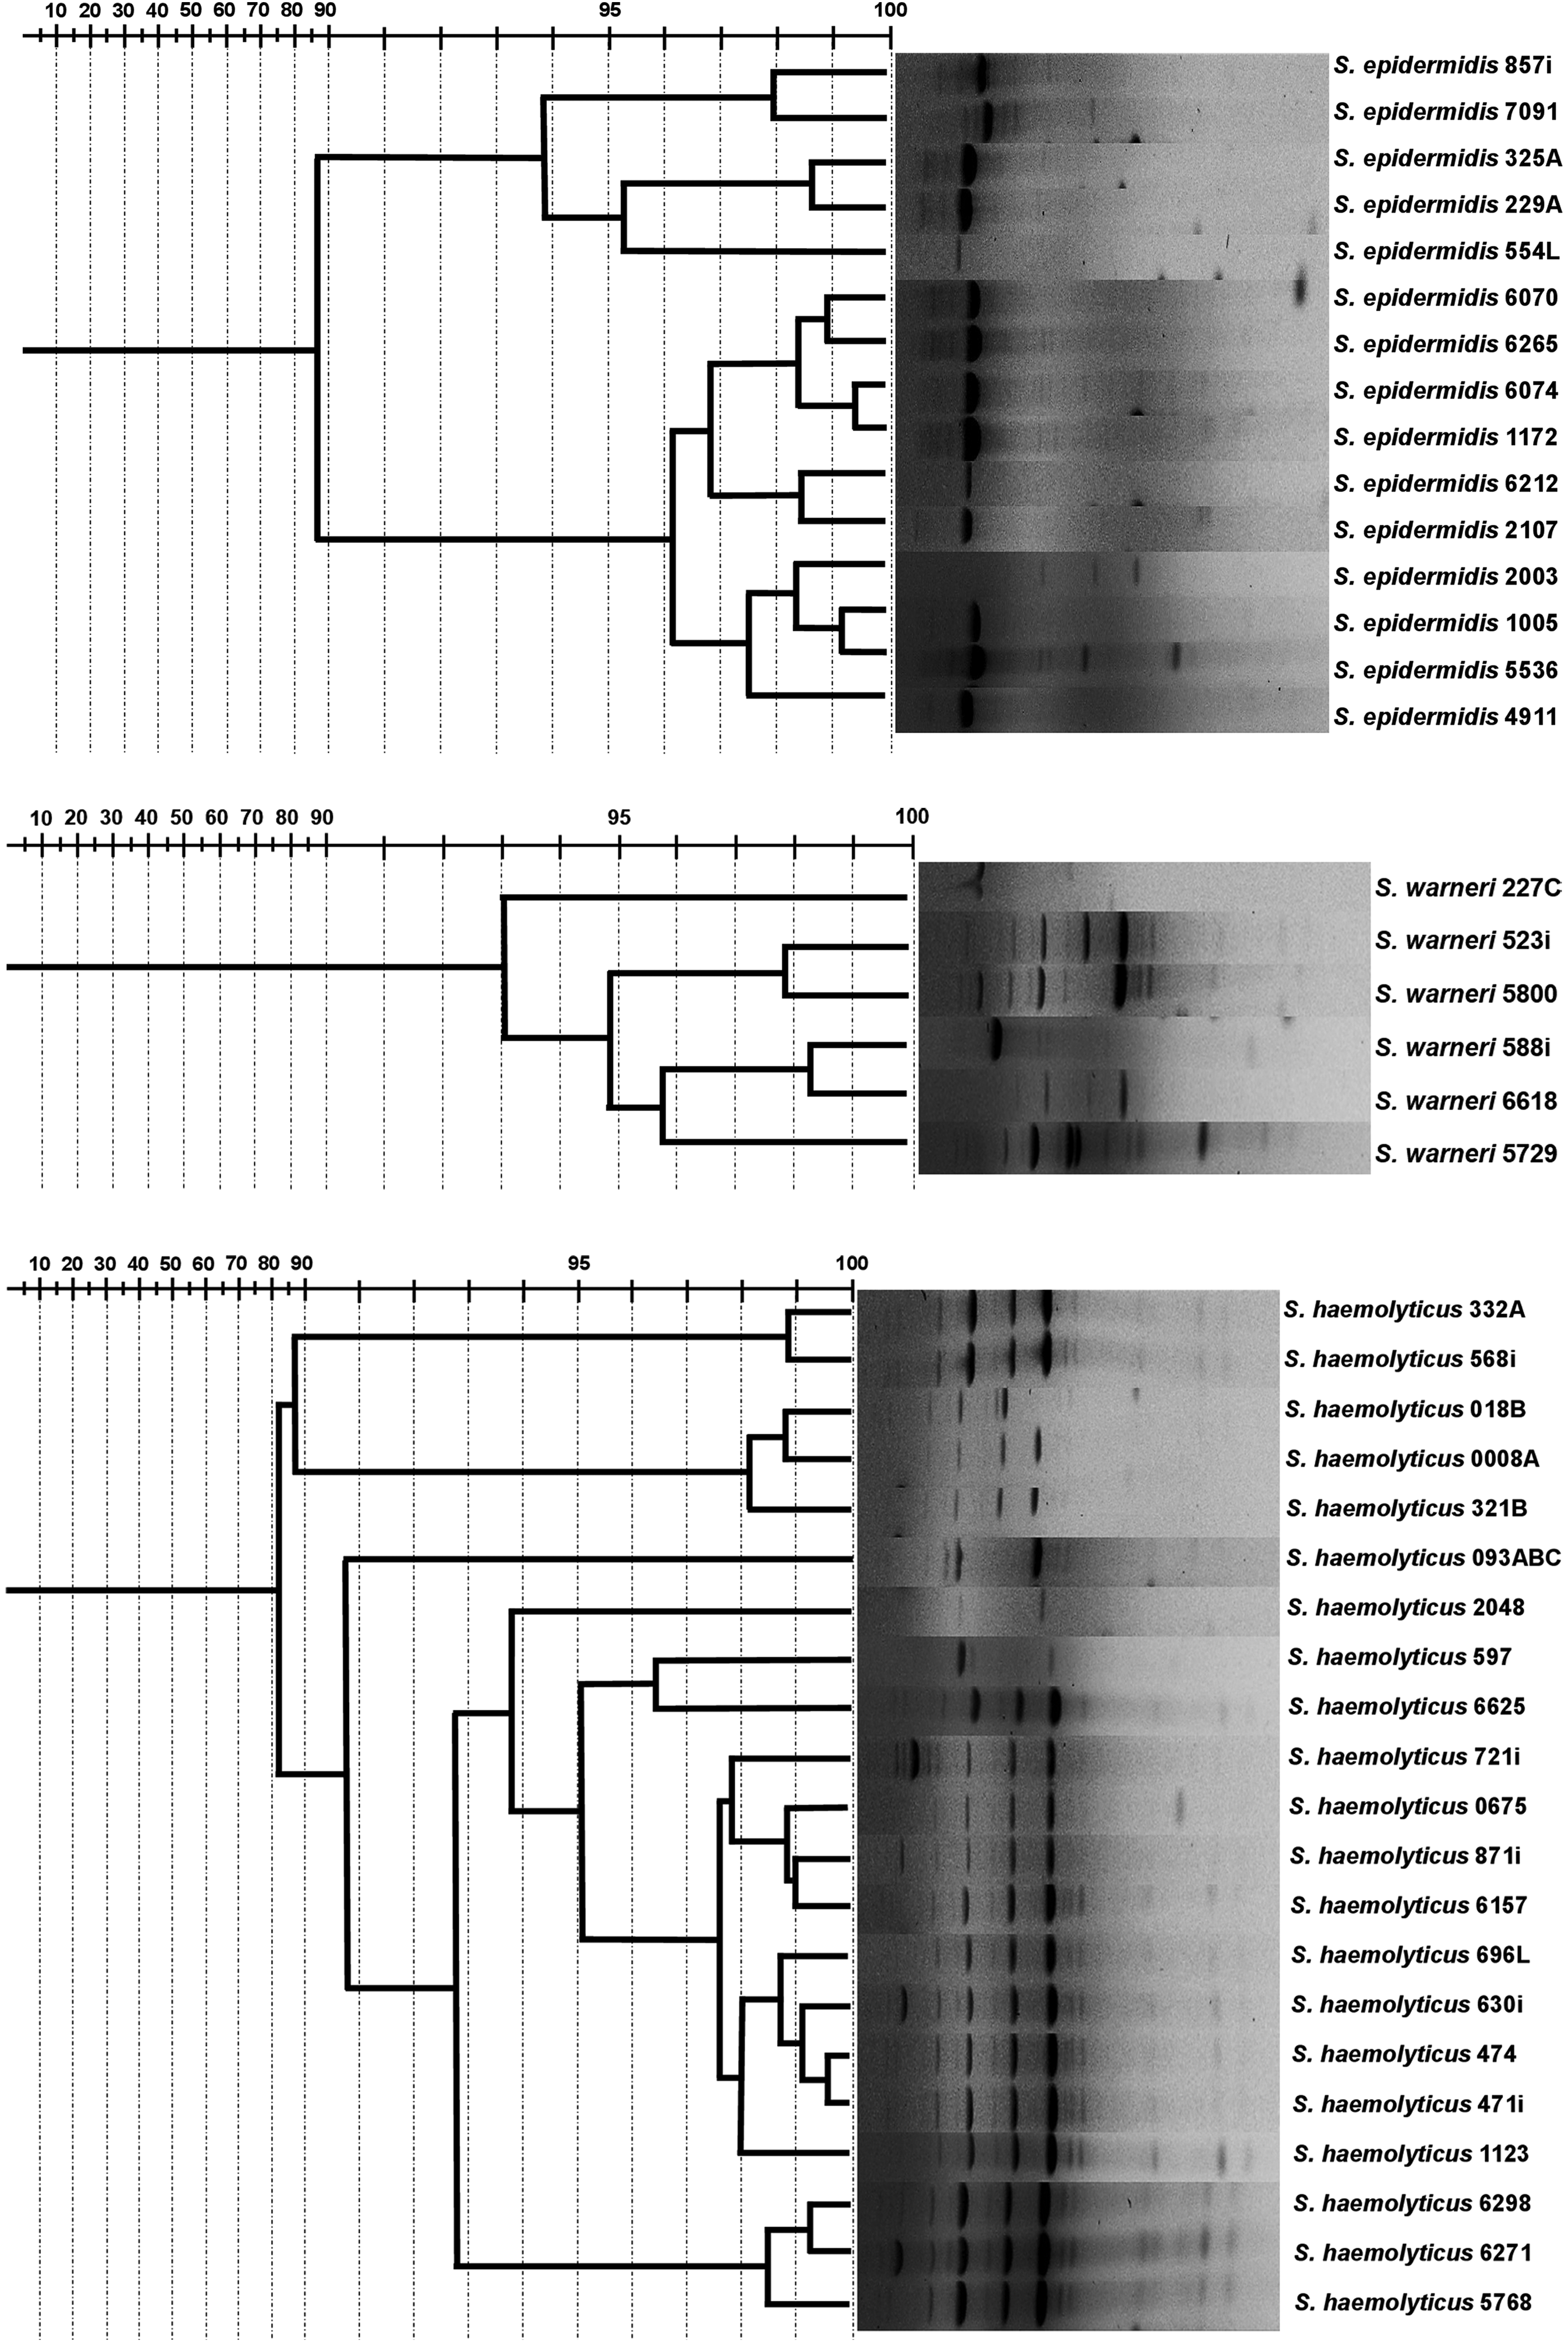
Fingerprinting profile using (GTG)5 primer obtained in each species studied.
The group of S. epidermidis was split into nine clusters: 857i and 7091; 325A and 229A; 554L; 6070 and 6265; 6074 and 1172; 6212 and 2107; 2003; 1005 and 5536; and 4911. The two lineages of S. equorum were split into two different clusters: 0006A and 4096. The groups of S. haemolyticus were split into 15 clusters: 332A and 568i; 018B and 0008A; 321B; 093ABC; 2048; 597 and 6625; 721i; 0675; 871i and 6157; 696L; 630i; 474 and 471i; 1123; 6298 and 6271; and 5768. The group of S. hominis was split into nine clusters: 1159 and 1016; 320; 296L; 5781; 1142; 2092 and 1016; 2032 and 2008; 6313; and 4595 and 4081. The group of S. warneri was split into four clusters: 227C; 523i and 5800; 588i and 6618; and 5729.
According to the group analyses, the most distinguishing characteristics between the strains were resistance to vancomycin, linezolid, and teicoplanin; resistance to moxifloxacin and SCCmec IIIB; sensitivity to oxacillin; and resistance to trimethoprim/sulfamethoxazole
The profiles of each group formed are presented in Tables 3, 4, and 5. It was observed that group 1 showed 16 samples that were resistant to benzylpenicillin, oxacillin, norfloxacin, erythromycin, and clindamycin. They were also sensitive to gentamicin, linezolid, teicoplanin, vancomycin, tigecycline, rifampicin, and trimethoprim/sulfamethoxazole. In addition, they possessed the genes mecA, blaZ, and ermB. However, they were negative for the presence of the genes vanA and ermC. Group 2 presented 17 samples resistant to benzylpenicillin, oxacillin, gentamicin, ciprofloxacin, norfloxacin, erythromycin, clindamycin, and trimethoprim/sulfamethoxazole. They were sensitive to linezolid, teicoplanin, vancomycin, tigecycline, fusidic acid, and rifampicin. In addition, they exhibited the blaZ and ermB genes and were negative for the vanA gene. Group 3 had eight samples that were resistant to benzylpenicillin and sensitive to gentamicin, ciprofloxacin, moxifloxacin, norfloxacin, erythromycin, clindamycin, linezolid, teicoplanin, vancomycin, tigecycline, fusidic acid, rifampicin, and trimethoprim/sulfamethoxazole. In addition, they exhibited the ermB gene, but were negative for the mecA, vanA, and aac-aphD genes. Group 4 presented two samples resistant to benzylpenicillin, oxacillin, ciprofloxacin, moxifloxacin, norfloxacin, erythromycin, clindamycin, linezolid, teicoplanin, vancomycin, fusidic acid, rifampicin, and trimethoprim/sulfamethoxazole. In addition, they were sensitive to gentamicin and tigecycline. Furthermore, they exhibited the blaZ and ermB genes, but were negative for the genes mecA, vanA, ermA, ermC, and aac-aphD. Group 5 presented nine samples resistant to benzylpenicillin, oxacillin, ciprofloxacin, norfloxacin, erythromycin, and clindamycin. In addition, they presented an intermediate profile for moxifloxacin and were sensitive to gentamicin, linezolid, teicoplanin, vancomycin, tigecycline, and fusidic acid. They exhibited the ermB gene and were negative for the mecA, vanA, ermA, ermC, and aac-aphD genes. Group 6 presented seven samples resistant to benzylpenicillin, oxacillin, ciprofloxacin, norfloxacin, and erythromycin. They were sensitive to linezolid, teicoplanin, vancomycin, tigecycline, fusidic acid, and rifampicin. Furthermore, they exhibited ermB gene and were negative for the mecA, vanA, and aac-aphD genes.
Frequency distributions of strains resistant to oxacillin, gentamicin, ciprofloxacin, moxifloxacin, norfloxacin, erythromycin, clindamycin, linezolid, teicoplanin, vancomycin, fusidic acid, rifampicin, and trimethoprim/sulfamethoxazole, and mecA, blaZ, ermC, aac-aphD, and SCCmec types differed significantly p < 0.001).
The correspondence analysis allowed visualization of the relationship between these formed clusters, genes detected, and phenotypic antimicrobial resistance by means of the resulting perceptual map (Fig. 8). Their first two dimensions explained 62.5% of the variability in the experimental data.

Perceptual map generated from antimicrobial resistance characteristics of the samples. The groups presented a spatial disposition very close. Because of that, we substitute features and groups by numbers. 1, Resistance to linezolid, vancomycin, and teicoplanin; 2, resistance to rifampicin; 3, resistance to trimethoprim/sulfamethoxazole; 4, resistance to fusidic acid; 5, sensitivity to oxacillin; 6, sensitivity to erythromycin; 7, sensitivity to ciprofloxacin and moxifloxacin, and sensitivity to trimethoprim/sulfamethoxazole; 8, group 3; 9, sensitivity to norfloxacin, clindamicin, and presence of ermB gene; 10, resistance to moxifloxacin and SCCmec IIIB cassette type; 11, resistance to ciprofloxacin, gentamicin, norfloxacin, erythromycin, and clindamycin; intermediate profile to gentamicin, fusidic acid, and moxifloxacin; Group 2, absence of the aac-aphD gene. 12, Absence of mecA gene, teicoplanin intermediate profile and rifampicin, oxacillin resistance, SCCmec II cassette type, group 5; 13, SCCmec IIIA cassette type and presence of the ermA gene; 14, presence of the ermC gene, absence of the blaZ and ermB gene, sensitivity to tigecycline, and resistance to benzylpenicillin; 15, presence of mecA gene and aac-aphD, and sensitivity to gentamicin; 16, Group 6, sensitivity to linezolid, vancomycin, teicoplanin, fusidic acid, and rifampicin; absence of the ermA and ermC gene; 17, Group 1, presence of blaZ gene, intermediate profile to ciprofloxacin, and type of cassette SCCmecIII; 18, Group 4.
Discussion
In an epidemiological study, 62% of the Brazilian patients presented nosocomial infection symptoms. This prevalence is higher than that observed in Europe and North America, and besides this, 65% of these cases in Brazil were due to CNS group. 20
In addition to this high frequency, the CNS has developed a multidrug resistance profile, as also seen in our work—the strains isolated showed high frequencies of resistance, mainly to the following antimicrobials: benzylpenicillin, oxacillin, ciprofloxacin, norfloxacin, erythromycin, and clindamycin. These findings are consistent with previous studies published worldwide, which also reported high frequencies of resistance in hospital environments.21,22 In a study conducted in Ghana, 98% of CNS strains isolated from nosocomial infections were resistant to penicillin V and 67% to trimethoprim. 23 In this study, 69% of the isolated CNS strains were multidrug resistant to the evaluated drugs (≥4 antimicrobials), while in a study in Zimbabwe, 86% of CNS strains isolated from urine samples were resistant to three or more antimicrobials. 24 In this study, 86.4% of the isolated CNS strains were multidrug resistant to antimicrobials, while in our work, the rate was 87.9%.
According to our results, S. haemolyticus was the species most resistant to the antimicrobials evaluated, followed by S. epidermidis, S. hominis, and S. warneri. It was not possible to analyze the species S. auricularis, S. cohnii, and S. equorum because of the n very low. Others studies from Brazil also revealed a high rate of oxacillin resistance in S haemolyticus and S. epidermidis25–27 ; these results constitute a huge problem, since the treatment options for these microorganisms are minimal.
A worrying feature presented in one S. epidermidis in this study was intermediate resistance to vancomycin. Reports of resistance to such an antimicrobial agent are very rare and, according to the literature, there is only one known report of vancomycin resistance in Brazil isolated by Palazzo et al. The researchers also did not find the gene vanA in their isolated strains. 28 They reported an increase in the thickness of the microbial cell wall when grown in a medium containing vancomycin and related this expansion to the resistance displayed.
Regarding the genotypic factors that imply the appearance of phenotypic resistance, a high frequency of blaZ and ermB genes was observed. This would explain the high phenotypic frequency that was also observed for the antimicrobials benzylpenicillin and erythromycin, respectively. In addition, it was also observed that there was a similar frequency of the aac-aphD gene and the number of microorganisms resistant to gentamicin.
However, the frequency of mecA gene was not associated with the high prevalence of phenotypically oxacillin-resistant strains. These data suggest that for quick decisions in emergency situations, the phenotype is more trustworthy than molecular biology. This helps to understand the evolution and transmission of genes in microorganisms, but it is inefficient for clinical proposes. These differences between phenotype and genotype may be due to the existence of other chromosomal genes that influence the expression of resistance, such as the essential factors for methicillin resistance (fem), auxiliary factors, high methicillin resistance (hmt), and numerous other genes that are not associated with mecA gene or the SCCmec cassette, but may influence methicillin resistance. These genes are required for synthesis of the cell wall, even in the presence of β-lactams. 29 Another factor that might explain this incongruence observed between phenotype and genotype are mutations in mecA gene or its promoter, leading to a non-functional gene. 30
Regarding the gene frequencies in each species, for mecA, it was lower than the overall rate for S. epidermidis (20%). For the blaZ gene, the frequency was lower than the overall rate for S. warneri (71.4%), S. epidermidis (64.2%), and S. hominis (57%), while for the ermA gene, only S. epidermidis showed a higher rate: 57%. For the ermC gene, S. haemolyticus and S. epidermidis showed a higher rate: 31.5% and 42.8%, respectively, while for the aac-aphD, only S. haemolyticus showed a higher rate: 47.3%. These results reveal that each species can have a more frequent genetic determinant for the phenotypic profile observed, and can spread different genes in and between hospitals.
The mecA gene is present in the SCCmec cassette, which in turn presents enormous diversity within the CNS group. Such classification is of extreme importance since each variety carries a group of specific genes that can cause resistance to other antimicrobials, metalloids, and transition metals with bactericidal activities, and genes related to virulence, colonization, and cell wall synthesis. The classification of SCCmec type is also valuable for epidemiological purposes. 3 Types III, IV, and V are the most prevalent in the CNS group, 31 and the findings of this study are in agreement with previous studies published since the most frequent was type III and its IIIB subvariety.
Regarding each species, the most frequent SCCmec type observed was type III. For S. haemolyticus, type IIIB, for S. epidermidis, type IIIB and IIIA, for S. hominis, type III, and for S. warneri, IIIB. In a study carried out in the south of Brazil, it was observed that the types and combinations of SCCmec had changed dramatically during a period of 6–8 years. The authors noticed a decreasing prevalence of types II, III, and V, and an increasing prevalence of SCCmec type I and IV. 32 These reveal a continuous monitoring of SCCmec profile in hospitals worldwide to know well the circulating profile.
The GTG5 analyze for each species showed a close fingerprinting profile. Nevertheless, variability in the presence of some bands influenced in the final cluster and many groups were formed within the same species. This little variability was a good tool to split the species and showed that there was species with the same profile in different hospitals of Belo Horizonte. This could indicate a dissemination of the strains between hospitals in our city that could alarm healthy professionals to have prevention measures.
According to the group analysis, most of the samples showed a similar profile of antimicrobial resistance and, in this way, few characteristics were really distinguishable. This finding was already expected, since the strains were isolated from the hospital environment, and thus would suffer a similar selective pressure.
In summary, this study provides an overview of the phenotypic and genotypic characterization and dissemination of clinical CNS samples in Brazilian hospitals. Therefore, our study contributes to epidemiological information for planning, implement and evaluate health practices, allowing correct antimicrobial strategies for the treatment of these nosocomial infections.
Footnotes
Acknowledgments
We are grateful to Conselho Nacional de Desenvolvimento Científico e Tecnológico (CNPq), Fundação de Amparo à Pesquisa do Estado de Minas Gerais (FAPEMIG), the Fundação de Amparo à Pesquisa e Desenvolvimento Científico do Maranhão (FAPEMA), and Coordenação de Aperfeiçoamento de Pessoal de Nível Superior (CAPES) for financing our research. We are also grateful to James Key for English revision.
Disclosure Statement
All the authors declare that funders had no role in study design, data collection and analysis, and decision to publish or preparation of the article.