




Abstract
In view of the changing antibiotic-resistance profiles of Streptococcus agalactiae from tilapia in China, antimicrobial susceptibilities of 75 S. agalactiae strains were determined by the disc diffusion method, and cluster analyses of the antibiograms and antibiogram types were performed. All strains displayed multidrug resistance (MDR). The antimicrobial-resistance rates were highest (>90%) to aminoglycosides, sulfonamides, pipemidic acid, and norfloxacin, followed by penicillin, ampicillin, and ciprofloxacin (26.7–38.7%); those to furadantin, lincomycin, erythromycin, ofloxacin, tetracycline, and florfenicol were low (<10%), and no resistance to vancomycin, cefalexin, cefoxitin, amoxicillin, medemycin, doxitard, oxytetracycline, rifampin, chloramphenicol, or thiamphenicol was detected. Statistical analysis showed that the resistance rate to ciprofloxacin increased significantly in 2016 (p = 0.009), whereas that to trimethoprim/sulfamethoxazole decreased (p = 0.017). Cluster analyses identified that the strains had 23 antibiogram types (A–W) and clustered in five groups (Groups I–V). The strains with higher antimicrobial resistance mainly clustered in Groups I and II. Our results show that the antibiograms varied with time and by location and that antibiogram types are constantly updating and expanding. Effective measures must be taken to reduce the antimicrobial resistance and spread of MDR strains.
Introduction
T
Tilapia is reported by the United Nations Food and Agriculture Organization to be an excellent breeding variety and is nowadays cultured worldwide. It is also an economically important freshwater cultured fish in China, with production of around 1.87 million tonnes. Guangdong province is a major tilapia-culturing area, accounting for about 40% of the total Chinese production (2017 China Fishery Statistical Yearbook). In recent years, streptococcal disease has become increasingly prevalent in tilapia, and S. agalactiae is one of its major pathogens which has strong infectivity, induces a high mortality rate, and has caused huge economic losses in the tilapia farming industry. 10 There is as yet no effective vaccine on the market for the prevention of tilapia streptococcal disease.11,12 Therefore, at present, grassroots aquaculture depends on antimicrobials and other chemicals to treat or prevent disease caused by S. agalactiae in tilapia. 13 In fact, the potential threat to the quality, safety, and edibility of aquatic products is a huge problem for the tilapia farming industry. 14 As a consequence, longitudinal epidemic surveillance of antimicrobial resistance of S. agalactiae in tilapia is of great significance to determine the distribution and spread of resistance, as well as provide guidance on antibacterial treatment. In this study, 75 strains of S. agalactiae isolated from sick or asymptomatic diseased tilapia in Guangdong Province from 2009 to 2016 were analyzed, and their sensitivity to 30 kinds of antimicrobial agents was determined. An antibiogram-type clustering analysis was performed to analyze the changes in antimicrobial resistance and antibiogram types in different years and regions. We also investigated the relationship between antimicrobial resistance and the temporal and spatial distribution of the isolated strains. The results provide useful information for effectively preventing the spread of multidrug resistance (MDR) in S. agalactiae.
Materials and Methods
Materials
A total of 75 S. agalactiae strains were isolated with conventional techniques 15 from tilapia collected from various regions in Guangdong Province from 2009 to 2016. Specific information on the strains is given in Fig. 1 and Supplementary Table S1(Supplementary Data are available online at www.liebertpub.com/mdr).
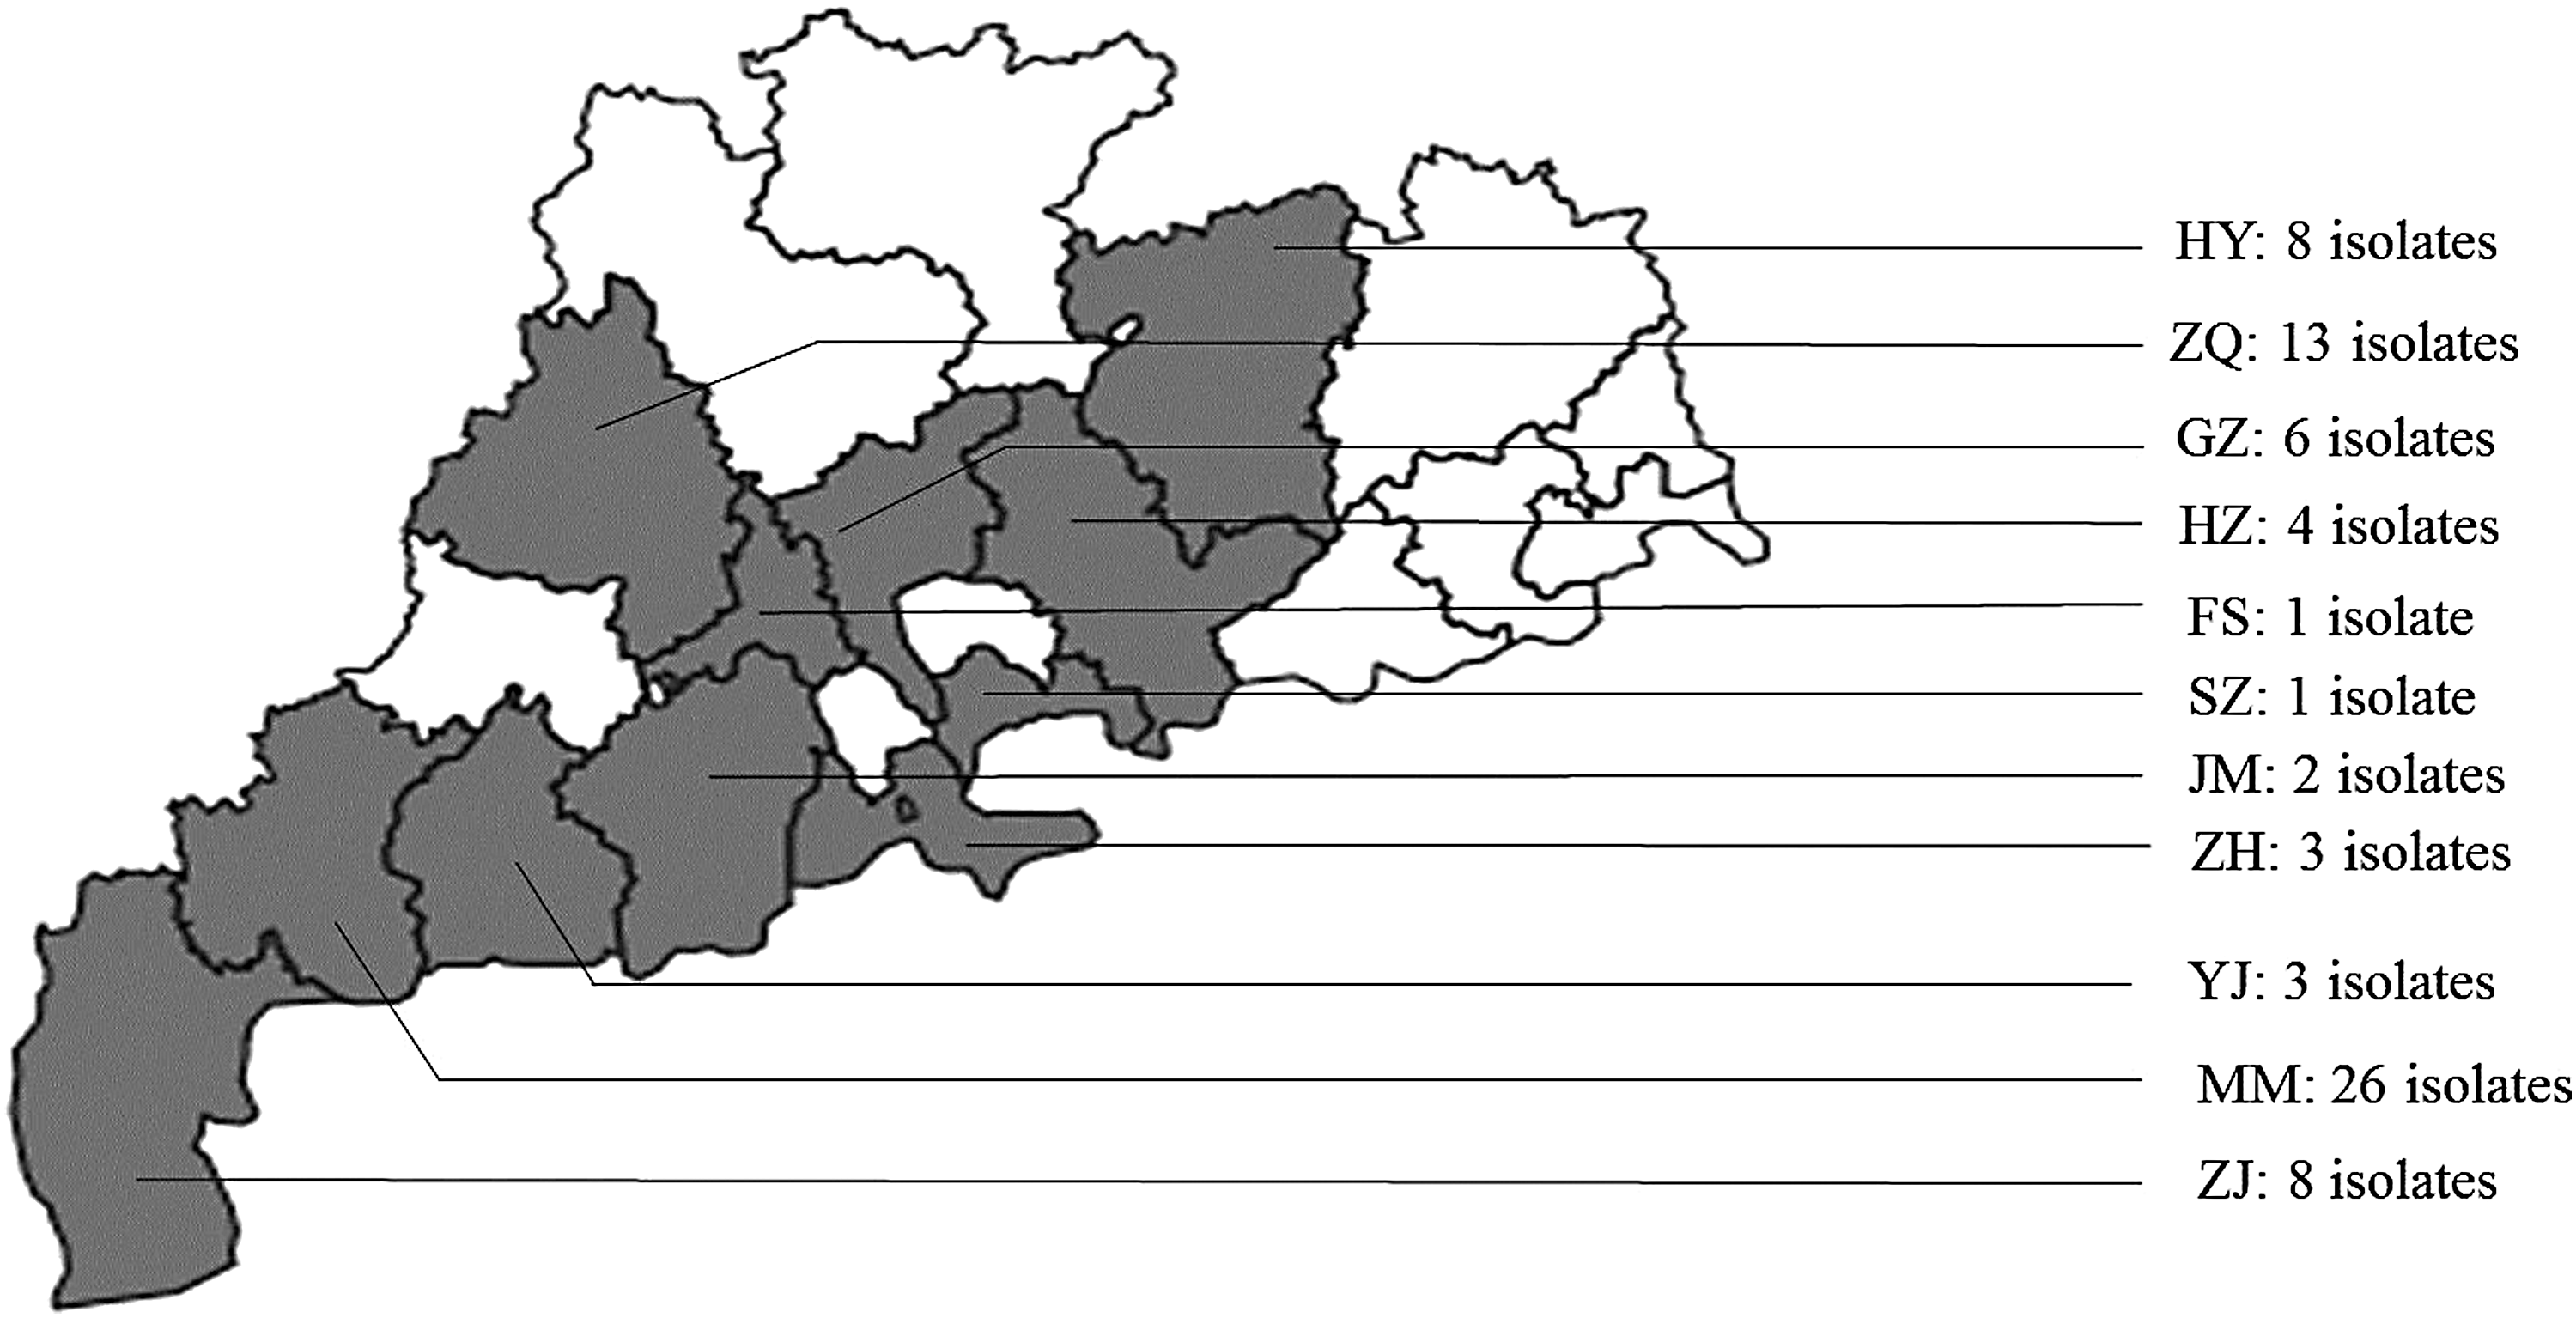
Locations from which tilapia were sampled in Guangdong. The 11 isolation sites are marked, and the number of isolations is shown in Guangdong Province, China. HY, Heyuan; ZQ, Zhaoqing; GZ, Guangzhou; HZ, Huizhou; FS, Foshan; SZ, Shenzhen; JM, Jiangmen; ZH, Zhuhai; YJ, Yangjiang; MM, Maoming; ZJ, Zhanjiang.
Twenty-five kinds of the tested antimicrobial susceptibility disks were bought from Hangzhou Microbial Reagent Co., Ltd. (Hangzhou, China), including vancomycin (30 μg), cefalexin (30 μg), cefoxitin (30 μg), amoxicillin (10 μg), medemycin (30 μg), doxitard (30 μg), rifampin (5 μg), chloramphenicol (30 μg), furadantin (300 μg), lincomycin (2 μg), erythromycin (15 μg), ofloxacin (5 μg), tetracycline (30 μg), florfenicol (30 μg), penicillin (10 U), ampicillin (10 μg), ciprofloxacin (5 μg), pipemidic acid (30 μg), norfloxacin (10 μg), trimethoprim/sulfamethoxazole (1.25 μg/23.75 μg), sulfafurazole (300 μg), gentamicin (10 μg), neomycin (30 μg), kanamycin (30 μg), and streptomycin (10 μg). In addition, the disks of sulfamonomethoxine (25 μg), sulfadiazine (25 μg), sulfadimethoxine (25 μg), oxytetracycline (10 μg), and thiamphenicol (10 μg) were provided by Guangdong Provincial Center for Aquatic Animal Disease Control and Prevention.
Antimicrobial sensitivity assay
Antibiotic susceptibilities of 75 S. agalactiae isolates were determined using the disc diffusion (Kirby-Bauer) method, according to the guidelines of the Clinical and Laboratory Standards Institute. 16 Escherichia coli (ATCC 25922) served as a quality control strain, and the results were recorded as resistant (R), intermediate (I), or susceptible (S) by measurement of the diameter of the zone of inhibition according to the recommended ranges.
Antibiotic-resistance rates and antibiogram analysis
The antimicrobial-resistance rates and antibiograms were analyzed from the measured experimental data with WHONET5.6 (www.whonet.org/), and the antimicrobial-resistance rate was also evaluated with a chi-squared test using the SPSS 20.0 software (IBM-SPSS, Inc., Chicago, IL). Differences in antimicrobial resistance were deemed statistically significant at p < 0.05. The resistance of the strains to each antimicrobial agent was expressed as S, I, or R, and the antibiogram of each isolated strain was generated by arranging the 30 kinds of antimicrobial agents. In the present study, MDR was defined as acquired nonsusceptibility to at least one agent in three or more antimicrobial categories. 17 Type abundance and type rate were shown in the antibiogram statistical analysis. The equations used to calculate the results of each parameter were as follows: Type abundance = n/N1 and Type rate = n/N2; where n = antibiogram types of a subset of strains, N1 = the number of a subset of strains, and N2 = antibiogram types of all strains.
Clustering analysis of antibiogram types
The diameters of the inhibition zones measured in the antimicrobial sensitivity assay were used as the variables in a clustering analysis of antibiogram types performed using Ward's clustering method of the SPSS 20.0 software. The correlation among strains was expressed as the square of the Euclidean distance, and the clustering analysis results are shown as a tree diagram.
Results
Analysis of antimicrobial-resistance rates of S. agalactiae
The 75 strains of S. agalactiae showed some differences in their antimicrobial-resistance rates to 30 antimicrobial agents. As shown in Fig. 2, the antimicrobial-resistance rates of all the strains to pipemidic acid, gentamicin, neomycin, kanamycin, streptomycin, sulfamonomethoxine, sulfadiazine, and sulfadimethoxine were 100%; those to norfloxacin, trimethoprim/sulfamethoxazole, and sulfafurazole were >90%; those to penicillin, ampicillin, and ciprofloxacin were 37.3%, 26.7%, and 38.7%, respectively; and those to furadantin, lincomycin, erythromycin, ofloxacin, tetracycline, and florfenicol were all <10%. No strain was resistant to vancomycin, cefalexin, cefoxitin, amoxicillin, medemycin, doxitard, oxytetracycline, rifampin, chloramphenicol, or thiamphenicol.

Comparison of resistance rate of Streptococcus agalactiae strains to 30 antimicrobial agents. AMO, amoxicillin; AMP, ampicillin; CHL, chloramphenicol; CIP, ciprofloxacin; CLX, cefalexin; DOX, doxitard; ERY, erythromycin; FLO, florfenicol; FOX, cefoxitin; FUR, furadantin; GEN, gentamicin; KAN, kanamycin; LIN, lincomycin; MED, medemycin; NEO, neomycin; NOR, norfloxacin; OFL, ofloxacin; OXY, oxytetracycline; PEN, penicillin; PPA, pipemidic acid; RIF, rifampin; SD, sulfadiazine; SIZ, sulfafurazole; SM2, sulfadimethoxine; SMM, sulfamonomethoxine; STR, streptomycin; T/S, trimethoprim/sulfamethoxazole; TET, tetracycline; THI, thiamphenicol; VAN, vancomycin.
As shown in Table 1, in the period from 2009 to 2016, the antimicrobial-resistance rates of these strains to the ten agents: vancomycin, cefalexin, cefoxitin, amoxicillin, medemycin, doxitard, oxytetracycline, rifampin, chloramphenicol, and thiamphenicol were all 0%, whereas those to pipemidic acid, gentamicin, neomycin, kanamycin, streptomycin, sulfamonomethoxine, sulfadiazine, and sulfadimethoxine were all 100%. During the period from 2009 to 2015, in addition to the aforementioned from antimicrobial agents, the antimicrobial-resistance rates of the strains to furadantin, lincomycin, erythromycin, and ofloxacin were also 0%; however, since 2016, strains resistant to these four antimicrobial agents appeared. Strains with antimicrobial resistance to penicillin and ampicillin appeared after 2014, and the resistance rate to ciprofloxacin increased over the years studied. Strains with antimicrobial resistance to tetracycline and florfenicol appeared after 2015, whereas the resistance rates of the 75 strains to norfloxacin, trimethoprim/sulfamethoxazole, and sulfafurazole declined to some extent in 2016, although they remained relatively high.
a represents vancomycin, cefalexin, cefoxitin, amoxicillin, medemycin, doxitard, oxytetracycline, rifampin, chloramphenicol, or thiamphenicol.
b represents furadantin, lincomycin, erythromycin, or ofloxacin.
c represents pipemidic acid, gentamicin, neomycin, kanamycin, streptomycin, sulfamonomethoxine, sulfadiazine, or sulfadimethoxine.
AMP, ampicillin; CIP, ciprofloxacin; FLO, florfenicol; NOR, norfloxacin; PEN, penicillin; SIZ, sulfafurazole; T/S, trimethoprim/sulfamethoxazole; TET, tetracycline.
Comparison of the antimicrobial-resistance rates of these S. agalactiae strains (Supplementary Table S2) showed that, in 2016, the resistance rate to trimethoprim/sulfamethoxazole decreased significantly (p = 0.017) relative to the resistance rates from 2009 to 2015; however, resistance to penicillin tended to increase but not significantly (p = 0.052), while that to ciprofloxacin increased extremely significantly (p = 0.009).
Antibiogram types of S. agalactiae strains
The 75 strains of S. agalactiae possessed 23 antibiogram types (A–W; Table 2 and Fig. 3), and the type abundance was 30.7%. All antibiogram types showed MDR character (Fig. 4). Antibiogram type N was resistant to 11 antimicrobial agents and included 28 strains, which was the highest number of strains among all the types. Types A, B, and D each contained six strains; type I contained four strains; types F and R each contained three strains; and types C, E, and M each contained two strains. Each of types G, H, J, K, L, O, P, Q, S, T, U, V, W, and X contained only one strain. All the antibiogram types, except P, were resistant to sulfafurazole.

Antibiogram and cluster analysis of the 75 Streptococcus agalactiae strains.

Antimicrobial categories of different antibiogram. ■ represents nonsusceptible to all agents listed in category; represents nonsusceptible to some; □ represents susceptible to all agents listed in category. 1, Aminoglycosides (gentamicin, neomycin, kanamycin, and streptomycin); 2, Sulfonamides (sulfadiazine, sulfafurazole, sulfadimethoxine, sulfamonomethoxine, and trimethoprim/sulfamethoxazole); 3, Fluoroquinolones (ciprofloxacin, norfloxacin, ofloxacin, and pipemidic acid); 4, Penicillins (penicillin, ampicillin, and amoxicillin); 5, Macrolides (medemycin and erythromycin); 6, Tetracyclines (doxitard, oxytetracycline, and tetracycline); 7, Phenicols (chloramphenicol, thiamphenicol, and florfenicol); 8, Nitrofurans (furadantin); 9, Lincosamides (lincomycin); 10, Cephems (cefalexin and cefoxitin); 11, Ansamycins (rifampin); 12, Glycopeptides (vancomycin).
AMO, amoxicillin; AMP, ampicillin; CHL, chloramphenicol; CIP, ciprofloxacin; CLX, cefalexin; DOX, doxitard; ERY, erythromycin; FLO, florfenicol; FOX, cefoxitin; FUR, furadantin; GEN, gentamicin; KAN, kanamycin; LIN, lincomycin; MED, medemycin; NEO, neomycin; NOR, norfloxacin; OFL, ofloxacin; OXY, oxytetracycline; PEN, penicillin; PPA, pipemidic acid; RIF, rifampin; SD, sulfadiazine; SIZ, sulfafurazole; SM2, sulfadimethoxine; SMM, sulfamonomethoxine; STR, streptomycin; T/S, trimethoprim/sulfamethoxazole; TET, tetracycline; THI, thiamphenicol; VAN, vancomycin.
Considering the year of isolation (Table 3), only one antibiogram type (N) was isolated in years 2009, 2012, and 2013, two antibiogram types (B and N) in 2010 and 2011, four antibiogram types (A, D, E, and I) in 2014, and seven antibiogram types (F, J, O, C, D, N, and M) in 2015, with a type rate of 30.4% and a type abundance of 100%. A total of 11 antibiogram types were identified during the period from 2009 to 2015, with a type rate of 47.8% and a type abundance of 31.4%. However, 21 antibiogram types were isolated in 2016, with a type rate of 91.3% and a type abundance of 52.5%.
According to the regional distribution of the isolates (Supplementary Table S3), the 35 strains collected from 2009 to 2015 were distributed in nine districts, where the number of antibiogram type ranged from one to four. However, the 40 strains collected in 2016 were distributed in six districts (Maoming, Zhanjiang, Heyuan, Zhaoqing, Yangjiang, and Jiangmen), with antibiogram types of ten, five, seven, three, one, and two antibiogram types, respectively. Heyuan and Jiangmen areas were not analyzed in previous years.
Clustering analysis of antibiogram types of S. agalactiae
The inhibition zone diameters of 30 antimicrobial agents were used as the variables in a clustering analysis, and five groups were identified among the antibiograms of 75 S. agalactiae strains (Groups I–V), which could be divided further into ten subgroups (i–x) (Fig. 3). When the square of the Euclidean distance was 3, 73 strains clustered in the ten subgroups (i–x). When the square of the Euclidean distance was 4, subgroup i and subgroup ii clustered in Group I, subgroup iii and subgroup iv clustered in Group II, and subgroup vii and subgroup viii clustered in Group IV. When the square of the Euclidean distance was 5, subgroup v and subgroup vi clustered in Group III, subgroup iv and subgroup x clustered in Group V, and subgroup iii and subgroup iv clustered with strain TKP1601 in Group II. When the square of the Euclidean distance was 6, subgroup i and subgroup ii clustered with strain TGZ1601 in Group I. Groups I–V contained 13, nine, three, five, and six antibiogram types, respectively, with type rates of 56.5%, 39.1%, 13.0%, 21.7%, and 26.1%, respectively. Subgroups i–x contained four, ten, four, six, two, three, two, three, six, and two antibiogram types, respectively, and each subgroup contained multiple antibiogram types (Supplementary Table S4).
Difference in the antimicrobial-resistance rates of the five groups of S. agalactiae mainly reflected differences in furadantin, lincomycin, erythromycin, ofloxacin, tetracycline, florfenicol, penicillin, ampicillin, trimethoprim/sulfamethoxazole, and ciprofloxacin (Table 4). Overall, the strains with high resistance to these 10 antimicrobial agents mainly clustered in Groups I and II. The antimicrobial-resistance rates of Group III to the other eight antimicrobial agents were all lower than those of the other four groups, except those to ciprofloxacin and trimethoprim/sulfamethoxazole, which were higher.
a represents vancomycin, cefalexin, cefoxitin, amoxicillin, medemycin, doxitard, oxytetracycline, rifampin, chloramphenicol, or thiamphenicol.
c represents pipemidic acid, gentamicin, neomycin, kanamycin, streptomycin, sulfamonomethoxine, sulfadiazine, or sulfadimethoxine.
AMP, ampicillin; CIP, ciprofloxacin; ERY, erythromycin; FLO, florfenicol; FUR, furadantin; LIN, lincomycin; NOR, norfloxacin; OFL, ofloxacin; PEN, penicillin; SIZ, sulfafurazole; T/S, trimethoprim/sulfamethoxazole; TET, tetracycline.
Discussion
In this study, increasing resistance was observed to most of the antimicrobial agents tested over the years studied. This may be attributed to normal microbial flora expressing greater antimicrobial resistance under the selective pressure exerted by long-term exposure to antimicrobial agents previously. 18 By analyzing the available data for abuse of antimicrobials, antimicrobial resistance in nearly all human and animal pathogens is on the increase. 19 However, no matter in which year the strains were isolated in the area under study, all the strains were almost completely resistant to aminoglycosides and sulfonamides, which is similar to the results of other studies.9,20 The resistance to pipemidic acid, gentamicin, neomycin, kanamycin, streptomycin, sulfamonomethoxine, sulfadiazine, and sulfadimethoxine appeared not to vary during the period from 2009 to 2016. It is also possible that the irrational use of the eight antimicrobial agents in previous years could have led to the rapid emergence and spread of resistant isolates. At present, there are approximately ten antibiotics and synthetic antimicrobial agents approved by the Chinese Ministry of Agriculture that can be used in aquaculture, which belong to five major groups (tetracyclines, aminoglycosides, amides, sulfonamides, and quinolones). In the process of sampling, we learned that sulfonamides were being used to combat streptococcosis in some tilapia farms, strictly according to the drugs' withdrawal times. Our experimental results show that S. agalactiae strains are generally resistant to sulfonamides, which may be related to the current status of the farms in terms of drug usage. In addition, Done et al. demonstrated that resistant bacteria isolated from both aquacultural and animal husbandry shared the same resistance mechanisms. 21 These results imply that the bacterial resistance-related genes may be transmitted to aquatic animals by plasmids, transposons, integrins, or other mobile elements.22,23
The differences in antibiogram types mainly reflected differences in the ten antimicrobial agents, furadantin, lincomycin, erythromycin, ofloxacin, tetracycline, florfenicol, penicillin, ampicillin, trimethoprim/sulfamethoxazole, and ciprofloxacin. Among these antimicrobial agents, there were new appearance of some antimicrobial resistance and an increasing trend in resistance to penicillins and fluoroquinolones from 2014. Interestingly, our study showed that the resistance rate to trimethoprim/sulfamethoxazole in 2016 decreased significantly (p = 0.017), relative to 2009–2015. However, the resistance rate to ciprofloxacin increased significantly (p = 0.009); this may be due to the fluoroquinolones, which are considered critically important for therapeutic use in human medicine, 24 resulting in the appearance of drug-resistant bacteria.
The 75 strains of S. agalactiae analyzed belonged to 23 antibiogram types, and the type abundance was 30.7%. Compared with the drug sensitivity of S. agalactiae strains isolated from 2007 to 2010, 25 the number of antibiogram types of S. agalactiae increased significantly and the specificity of the isolated strains was more obvious from 2009 to 2016. In the present study, we found that all the strains displayed MDR characteristics. MDR might be associated with mobile genetic elements that encode specific resistance genes such as the integrons. 26 In 2016, the number of antibiogram types among the S. agalactiae strains isolated was highest, indicating that the number of antibiograms increased continuously over the years, especially from 2015. This might be associated with frequent outbreaks of S. agalactiae disease in tilapia in recent years, accumulation of microbial inherent resistance, 27 the uncontrolled use of antimicrobial agents, or transmission of resistance genes among bacteria.28,29
In the present study, different regions had different antibiogram types; Maoming had the greatest number of types (10 types and 26 strains) from 2009 to 2016, which is similar to results determined previously. 30 The result also implied that Maoming is the largest tilapia culture area in the world. 31 Antibiogram types of strains from 2016 in the same area were richer than in previous years. Compared with the period from 2009 to 2015, Heyuan and Jiangmen were newly analyzed regions, where five types of antibiogram were unique to Heyuan, which might be related to the unique aquaculture model with cages in flowing river water. It may be that the antimicrobial agents became more widespread in treating S. agalactiae disease in tilapia. We also found that the antibiograms for each region contained one or several unique types, which are consistent with a report from Thailand. 32 The T, W, and J antibiogram types were unique to the Yangjiang, Jiangmen, and Foshan regions, respectively, suggesting significant differences in the antibiograms of the S. agalactiae strains in different regions.
Furthermore, cluster analyses are based on continuous variables and identify the correlations among strains. Until now, cluster analysis has not been applied to the study of antimicrobial resistance in S. agalactiae. But this technique has wide application in antimicrobial-resistance studies of many bacteria in the fields of medicine 33 and aquaculture. 34 Therefore, in this study, five groups (Groups I–V) were identified, which could be further divided into ten subgroups. Type N has 28 strains (37.3%), from 2009 to 2016, and was clustered to Groups II–V and subgroups iii, iv, v, vi, viii, ix, and x. This is related to the differences in the diameters of the inhibition zones of these strains, although they were all resistant to the 11 antimicrobial agents of type N. In general, most of the type N strains were clustered in Groups III and V. The strains with high antimicrobial resistance clustered predominantly in Groups I and II. The cluster analysis indicated a single source host of the isolated strains and helped us with strong epidemiological correlations. In addition, it also helped to develop better programs to effectively prevent the spread of antimicrobial-resistant S. agalactiae based on specific antibiogram group. The authorities responsible should formulate measures to restrict the use of antibiotics in tilapia culture, especially highly resistant antibiotics. At the same time, through scientific training, farmers can learn how to prevent streptococcal disease of tilapia and avoid the indiscriminate use of drugs. It is important that researchers should speed up the development of a vaccine against S. agalactiae, as vaccination instead of using antibiotics is the best way to combat the disease.
Footnotes
Acknowledgments
This work was supported by grants from National Natural Science Foundation of China (31502210), Pearl River S&T Nova Program of Guangzhou (201610010015), Special Funds for Fish Diseases of Guangdong Province (2016-302), Youth Science and Technology Innovation Talents Funds in Special Support Plan for High Level Talents in Guangdong Province (2016TQ03 N275), and Natural Science Foundation of Guangdong Province (2015A030313688).
Disclosure Statement
No competing financial interests exist.
References
Supplementary Material
Please find the following supplemental material available below.
For Open Access articles published under a Creative Commons License, all supplemental material carries the same license as the article it is associated with.
For non-Open Access articles published, all supplemental material carries a non-exclusive license, and permission requests for re-use of supplemental material or any part of supplemental material shall be sent directly to the copyright owner as specified in the copyright notice associated with the article.
