




Abstract
Disinfectant resistance and biofilm formation capacity are two important characteristics that contribute to the persistence of microorganisms in food processing environments and contamination of food products. This study investigated the susceptibility of 510 Escherichia coli isolates against 5 disinfectants and the prevalence of 10 disinfectant-resistant genes in these isolates. The biofilm formation capacity of 194 isolates was determined, and the correlation between disinfectant resistance and biofilm formation was analyzed. The minimal inhibitory concentrations (MICs) of cetyltrimethylammonium bromide (CTAB), benzalkonium chloride (BC), cetylpyridinium chloride, and chlorhexidine (CHX) against isolates were 32–512, 16–256, 32–256, and 2–32 mg/L, respectively. The MICs of triclosan against 88.43% of isolates were 8–1,024 mg/L, while the MICs for the rest of isolates exceed 2,048 mg/L. The presence of ydgE, ydgF, and qacF genes was significantly correlated with the CHX resistance of E. coli isolates, while the presence of qacF and qacEΔ1 genes was significantly correlated with CTAB and BC resistance, respectively. The biofilm formation capacity (adjusted optical density value) was positively correlated with BC resistance (r = 0.201, p < 0.01) and showed no correlation with other disinfectants. The presence of sugE(p) was positively correlated with biofilm formation, while four genes were negatively correlated with biofilm formation. This study provides useful data on disinfectant resistance and biofilm formation capacity of E. coli contaminating poultry products, which could be helpful in guiding proper disinfectant usage and establishing effective biofilm eradication strategy in food industry.
Introduction
E
Usage of disinfectants, which is the most common intervention strategy to control bacterial contamination during the whole meat production chain, is one of the harshest stresses that bacteria might encounter. 9 Any increase in bacterial tolerance could enhance the adaptive resistance to antibiotics and bacterial virulence, and thus, the increase in bacterial disinfectant tolerance becomes a key point of food hygiene administration.10,11 E. coli, Klebsiella pneumoniae, Salmonella, and Staphylococcus aureus from retail chicken or pork showed relative high resistance to quaternary ammonium compounds (QACs). 12 Most Salmonella isolates, which were isolated from chicken and egg production chains, showed lower susceptibility to the QACs and chlorhexidine (CHX) compared with the control strain. 13 Furthermore, efflux pumps seem to be the most abundant determinants of disinfectant resistance by pumping out a broad range of toxic substrates. 14
The capacity of biofilm formation is an effective strategy employed by bacteria to protect themselves from sanitizers used in the meat industry. Biofilm, as a persistent contamination source of food products, result in shortened shelf life and transmission of diseases. 15 E. coli have well-established ability to form biofilm on stainless steel and glass, and even on fresh produce, such as cantaloupe and lettuce.2,7,16 Visvalingam et al. 17 showed that all generic E. coli, which were recovered from beef plants, formed strong biofilm. Furthermore, E. coli can cause diarrheal diseases and infections, which fulfill many or all of the proposed criteria for biofilm-associated infections. 18
Consumption of chicken meat is increasing worldwide, and the chicken contaminated by microbes during processing and storage remains a food safety concern. 19 However, the studies about disinfectant resistance and biofilm formation profiles of bacteria are not adequately reported. This study investigated the minimal inhibitory concentrations (MICs) of five disinfectants, which are commonly used in chicken production chain, against 510 E. coli isolated from retail chicken in China. Also, the biofilm formation capacity of 194 E. coli isolates was tested. To find the correlation between disinfectant-resistant genes and disinfectant resistance, the distribution of ydgE, ydgF, mdfA, emrE, sugE(c), qacEΔ1, qacF, sugE(p), qacE, and qacG was examined. Furthermore, the association between disinfectant resistance and biofilm formation was analyzed.
Materials and Methods
Bacterial strains
A total of 510 E. coli isolates were taken from our laboratory collection, which had been previously isolated from retail chicken in Sichuan (n = 79), Shanghai (n = 56), Guangdong (n = 59), Shaanxi (n = 46), Henan (n = 114), and Beijing (n = 156) in China, 2010. In each province or city, three cities (or districts for Beijing and Shanghai) were selected. Within each city or district, four large supermarkets (area size of more than 14,000 m 2 ), four small supermarkets (area size of less than 14,000 m 2 ), and four farmers' markets were visited for sample collection. In each supermarket and farmers' market, four chicken samples were collected to isolate E. coli. The strains have been previously identified as E. coli by PCR detection.
Each of the isolates used in this study was recovered from different chicken samples and was different in antimicrobial resistance profile, 20 which indicated that they were nonrepeated isolates. All isolates were stored at −80°C in Luria-Bertani (LB) broth (Beijing Land Bridge Technology Co., Ltd., Beijing, China) containing 30% glycerol until used. Stock cultures were streaked on LB agar and incubated for 18 hr at 37°C. Then, a loopful of each strain was inoculated into 30 mL LB broth and incubated for 18 hr at 37°C.
Determination of MICs of disinfectants
The disinfectants used were cetyltrimethylammonium bromide (CTAB; Sigma), benzalkonium chloride (BC; Sigma), cetylpyridinium chloride (CTPC; Sigma), CHX (Chengdu Best-reagent Co., Ltd.), and triclosan (TCS; Chengdu Best-reagent Co., Ltd.). The MICs of disinfectants against E. coli isolates were determined by the agar dilution method according to CLSI guidelines. 21 E. coli suspensions were adjusted to a turbidity of a 0.5 McFarland standard and 10-fold diluted. Two microliters of bacterial suspensions (ca 10 4 CFU) were spotted on the surface of Mueller-Hinton agar plates with disinfectants of various concentrations (1, 2, 4, 8, 16, 32, 64, 128, 256, 512, 1,024, and 2,048 mg/L) and incubated at 37°C for 24 hr. The lowest disinfectant concentration that totally inhibited the visible growth of the microbes on the agar plate after 24 hr was recorded as the MIC. E. coli ATCC 25922 was used as a quality control strain.
PCR detection of disinfectant-resistant genes
Ten disinfectant-resistant genes, which confer the efflux-mediated resistance to QACs and other toxic compounds, were selected in this study. Among these, ydgE, ydgF, mdfA, emrE, and sugE(c) are known as chromosome-encoded genes.22,23 In addition, qacE, qacEΔ1, qacF, qacG, and sugE(p) have been identified on mobile genetic elements in Gram-negative organisms.24,25 PCR assays were used to investigate the presence of 10 disinfectant-resistant genes among 510 isolates. Sequences of the primers, annealing temperatures, and elongation time are described in Table 1. DNA template was prepared by suspending an overnight culture in 1 mL of water. The suspensions were heated at 100°C for 10 min and centrifuged at 13,000 g for 2 min. Supernatants were transferred to a new tube and stored at −20°C.
Primer Sequences for Disinfectant-Resistant Genes
F, forward; R, reverse.
PCR was performed in a thermal cycler (HEMA 9600 PCR Thermo Cycler, Zhuhai, China) by using 1 cycle at 95°C for 5 min, 30 cycles of denaturation at 95°C for 1 min, primer annealing at 50–60°C for 30 sec, primer extension at 72°C for 25–35 sec, and 1 cycle at 72°C for 10 min. Each 25 μL PCR mixture consisted of 2.5 μL of template, 2.5 μL of 10 × PCR buffer, 2 μL of 2.5 mM dNTP, 0.25 μL of 0.2 mM primers, and 2.5 U Taq DNA polymerase (TransGen Biotech). The amplified PCR products were analyzed on 2.0% (w/v) agarose gels. The appropriate positive controls with different disinfectant resistance genes were selected from E. coli isolates, confirmed by PCR followed by sequencing. All results were confirmed by at least three independent experiments.
Crystal violet assay
Out of all 510 isolates, isolates from Sichuan (n = 79), Shanghai (n = 56), and Guangdong (n = 59), which represent the western, eastern, and southern China, respectively, were chosen by geographical criteria for biofilm formation analysis. The capacity of biofilm formation was examined in regard to biomass accumulation according to the crystal violet (CV) staining method described by Naves et al., 26 with some modifications. The overnight cultures of E. coli isolates were diluted to ∼10 9 CFU/mL in LB broth, and 250 μL of each culture was inoculated in a 96-well plate, which was subsequently incubated at 37°C for 48 hr without agitation to facilitate biofilm formation on the microtiter plate. Noninoculated LB broth was used as a control. Six wells of the plate were used for each strain.
Then, the medium was carefully removed, and each well was rinsed once with distilled water to remove any unbound bacteria. After being air-dried for 30 min, biofilms were stained with 250 μL of 1% CV (wt/vol) solution (Tianjin Kermel Chemical Regent Co., Ltd., Tianjin, China) for 20 min at room temperature. Then, the residual CV dye was removed, and wells were rinsed thrice with distilled water to remove any unbound colorant. After drying, the stained biofilm was solubilized in 250 μL of 33% (vol/vol) glacial acetic acid for 20 min.
The optical density at 570 nm (OD570) was measured using a microplate spectrophotometer (model 680; Bio-Rad, Hercules, CA). The biofilm formation capacity of a tested strain is expressed as average OD570 value of the strain reduced by ODc value (OD570-c = average OD570 of a strain-ODc). The cutoff OD value (ODc) was defined as three standard deviations above the mean OD570 of the negative control. The isolates were divided into the following groups: OD570-c ≤ ODc = no biofilm producer; ODc < OD570-c ≤ 2 × ODc = weak biofilm producer; 2 × ODc < OD570-c ≤ 4 × ODc = moderate biofilm producer; and 4 × ODc < OD570-c = strong biofilm producer. 27 The experiment was replicated thrice.
Statistical analysis
All experiments were performed in triplicate. The ordinal logistic regression was carried out with SPSS software (version 20.0; SPSS, Inc., Chicago, IL) to determine the correlation between each disinfectant-resistant gene with the tolerance of isolates against five disinfectants (MIC values set as an ordinal value of 1, 2, 3, etc.). The chi-square test was used to analyze the correlation between disinfectant resistance (ordinal values of MICs) and disinfectant-resistant genes with biofilm formation capacity (OD570-c). The Spearman's correlation analysis was carried out to test the relationships between disinfectant resistance (ordinal values of MICs) or disinfectant-resistant genes and biofilm formation capacity (OD570-c). Two-sided p < 0.05 was considered statistically significant.
Results
MICs of five disinfectants against E. coli isolates
The MICs of CTAB, BC, CTPC, and CHX against E. coli isolates were 32–512, 16–256, 32–256, and 2–32 mg/L, respectively (Table 2). The MICs of TCS against 88.43% of E. coli isolates were 8–1,024 mg/L, while the MICs for the rest of isolates exceed 2,048 mg/L. The order of MIC90 values of different disinfectants is as follows: TCS > CTAB = CTPC > BC > CHX. Among these disinfectants, CHX was the most effective disinfectant to inactivate E. coli isolates. BC was more effective than another two QACs. Compared with the control strain E. coli ATCC 25922 (MICCTAB = 64 mg/L, MICBC = 16 mg/L, MICCTPC = 64 mg/L, MICCHX = 2 mg/L, and MICTCS = 2 mg/L), most of isolates showed higher tolerance to TCS (100%), CTAB (94.71%), BC (88.82%), and CHX (76.27%), while only 27.45% of E. coli isolates showed more resistance to CTPC than the control strain.
Disinfectant Susceptibility Profiles for 510 Escherichia coli Isolates from Retail Chicken
BC, benzalkonium chloride; CHX, chlorhexidine; CTAB, cetyltrimethylammonium bromide; CTPC, cetylpyridinium chloride; MIC, minimal inhibitory concentration; MIC90, the values represent the concentrations at which 90% of strains were inhibited; TCS, triclosan.
Different disinfectant resistance of E. coli isolates from six regions
The different MIC90 values of CTAB, BC, CTPC, CHX, and TCS against E. coli isolated from six regions are shown in Fig. 1. No difference was found in the resistance of isolates from six regions against CTAB (MIC90 = 256 mg/L). E. coli isolates from Guangdong were resistant to more disinfectant types than those from other regions. CHX and TCS were more effective against isolates from Beijing and Shaanxi than BC and CTPC. Isolates from Sichuan exhibited a stronger resistance to CTPC, CHX, and TCS than BC, while isolates from Shanghai were more susceptible to CTPC than other three disinfectants. E. coli isolates from Henan showed a low tolerance to BC, CTPC, CHX, and TCS.

MIC90 values of CTAB
Presence of disinfectant-resistant genes in E. coli isolates
The mdfA gene was most commonly detected in 510 E. coli isolates (86.27%, n = 440) among the 10 selected disinfectant-resistant genes, followed by ydgF (85.29%, n = 435), ydgE (83.92%, n = 428), sugE(c) (71.57%, n = 365), emrE (60.20%, n = 307), qacEΔ1 (37.06%, n = 189), qacF (13.53%, n = 69), and sugE(p) (6.47%, n = 33). The qacE and qacG gene were not detected in any of the isolates. There were 50 genotypes detected in 510 E. coli isolates. The top five disinfectant-resistant genotypes were ydgF-ydgE-mdfA-sugE(c)-emrE (23.14%, n = 118), ydgF-ydgE-mdfA-sugE(c)-emrE-qacEΔ1 (16.27%, n = 83), ydgF-ydgE-mdfA-sugE(c) (10.39%, n = 53), ydgF-ydgE-mdfA-sugE(c)-qacEΔ1 (6.27%, n = 32), and ydgF-ydgE-mdfA-emrE (5.29%, n = 27). None of the 10 disinfectant-resistant genes was detected in 20 E. coli isolates (3.92%).
Association between disinfectant-resistant genes and disinfectant resistance
The presence of ydgF, ydgE, and qacF was significantly correlated with the CHX resistance of E. coli isolates (p < 0.05), while CTAB and BC resistance were significantly associated with by the presence of qacF and qacEΔ1 (p < 0.05), respectively (Table 3).
p-Value of Ordinal Logistic Regression for Disinfectant Resistance with Disinfectant-Resistant Genes
Bold value indicates statistical significance (p < 0.05).
Biofilm formation of E. coli isolates
The study showed that, among the 194 E. coli isolates from Sichuan (n = 79), Shanghai (n = 56), and Guangdong (n = 59), 85.05% of isolates were able to form biofilm on polystyrene surface, while 47.94% of isolates formed strong biofilm. The percentage of strong biofilm producers from Guangdong (61.02%) was higher than those from Shanghai (33.93%) (p < 0.05). The biofilm formation capacity of isolates from these regions, represented as the averages OD570-c of isolates from each region, was 1.80, 1.58, and 0.70, respectively (Fig. 2).
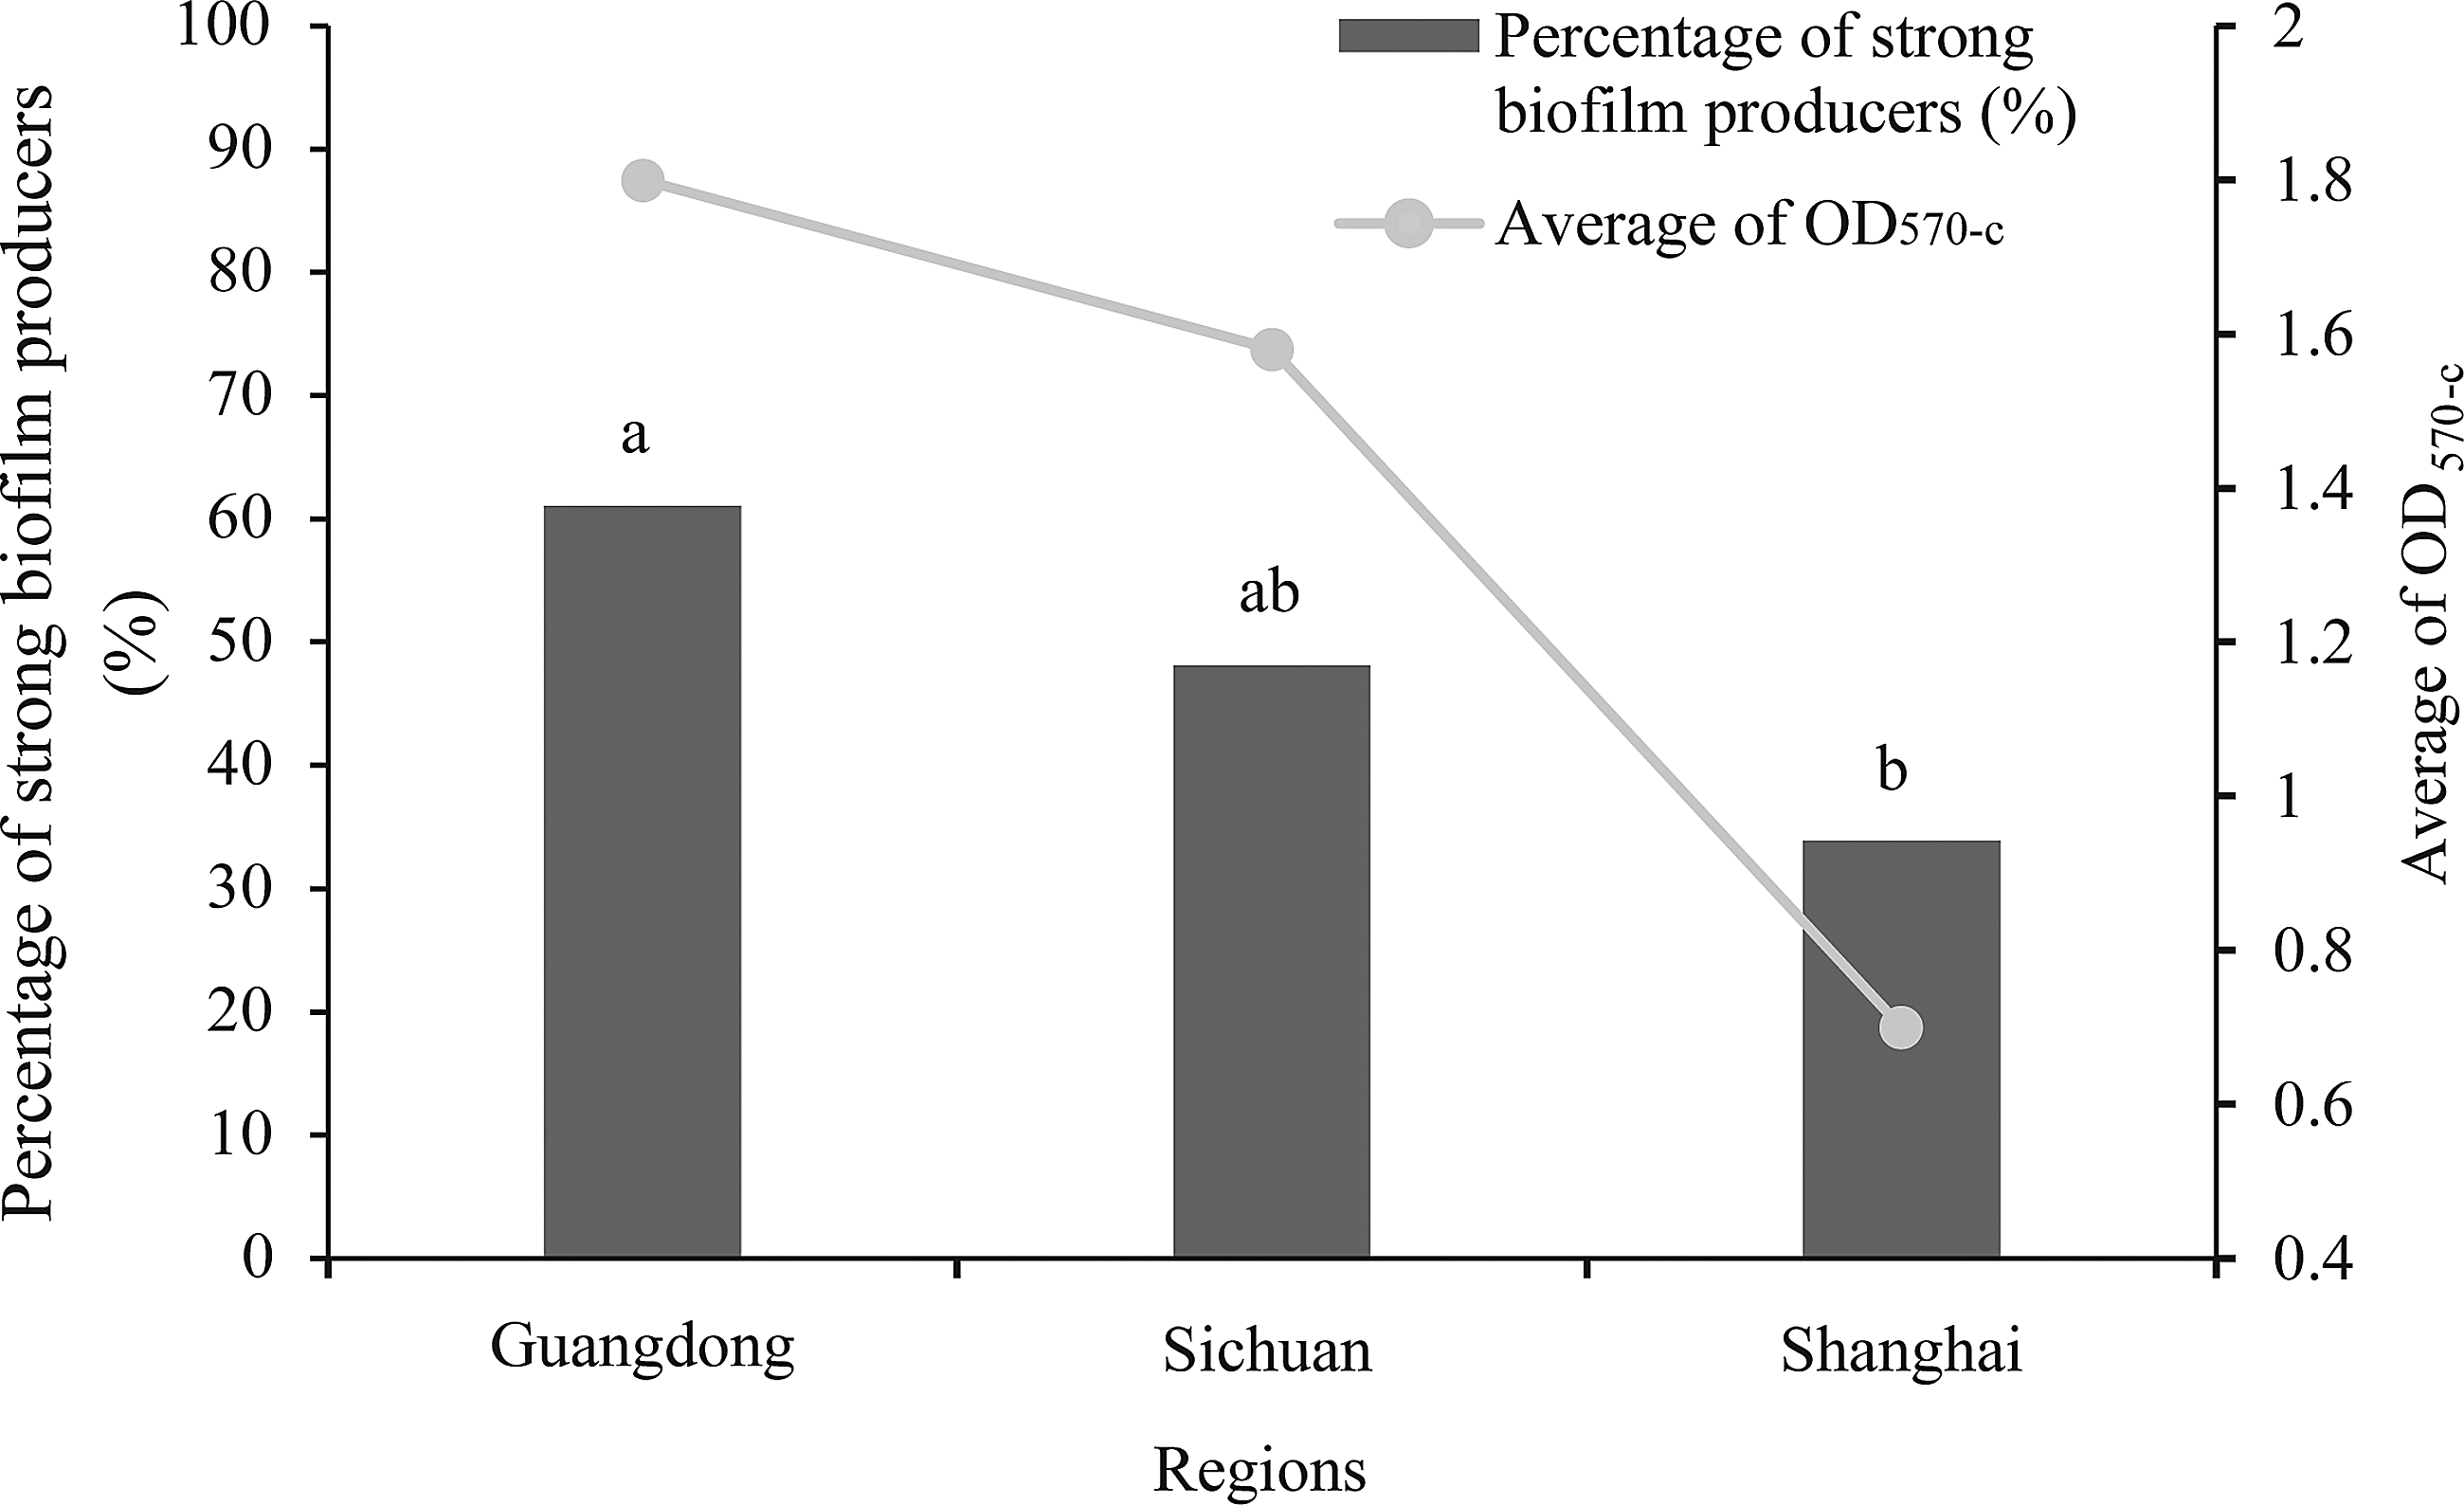
The percentage of strong biofilm producers and the average of OD570-c of isolates from Sichuan, Shanghai, and Guangdong. a/b, statistically significant difference (p < 0.05).
Biofilm formation capacity and its correlation with disinfectant resistance
The resistance level of isolates to BC has a positive correlation with the percentage of biofilm producers (ODc < OD570-c) (r = 0.201, p < 0.01) (Table 4). Specifically, all of E. coli isolates with the highest tolerance to BC (MIC = 256 mg/mL) exerted strong biofilm formation capacity (4 × ODc < OD570-c). No correlation was found between biofilm formation capacity and other disinfectant resistance. The presence of sugE(p) gene has a positive correlation with biofilm formation capacity of E. coli isolates (p < 0.05), while ydgF, ydgE, and mdfA, sugE(c) showed a negative association with biofilm formation capacity (p < 0.05) (Fig. 3).
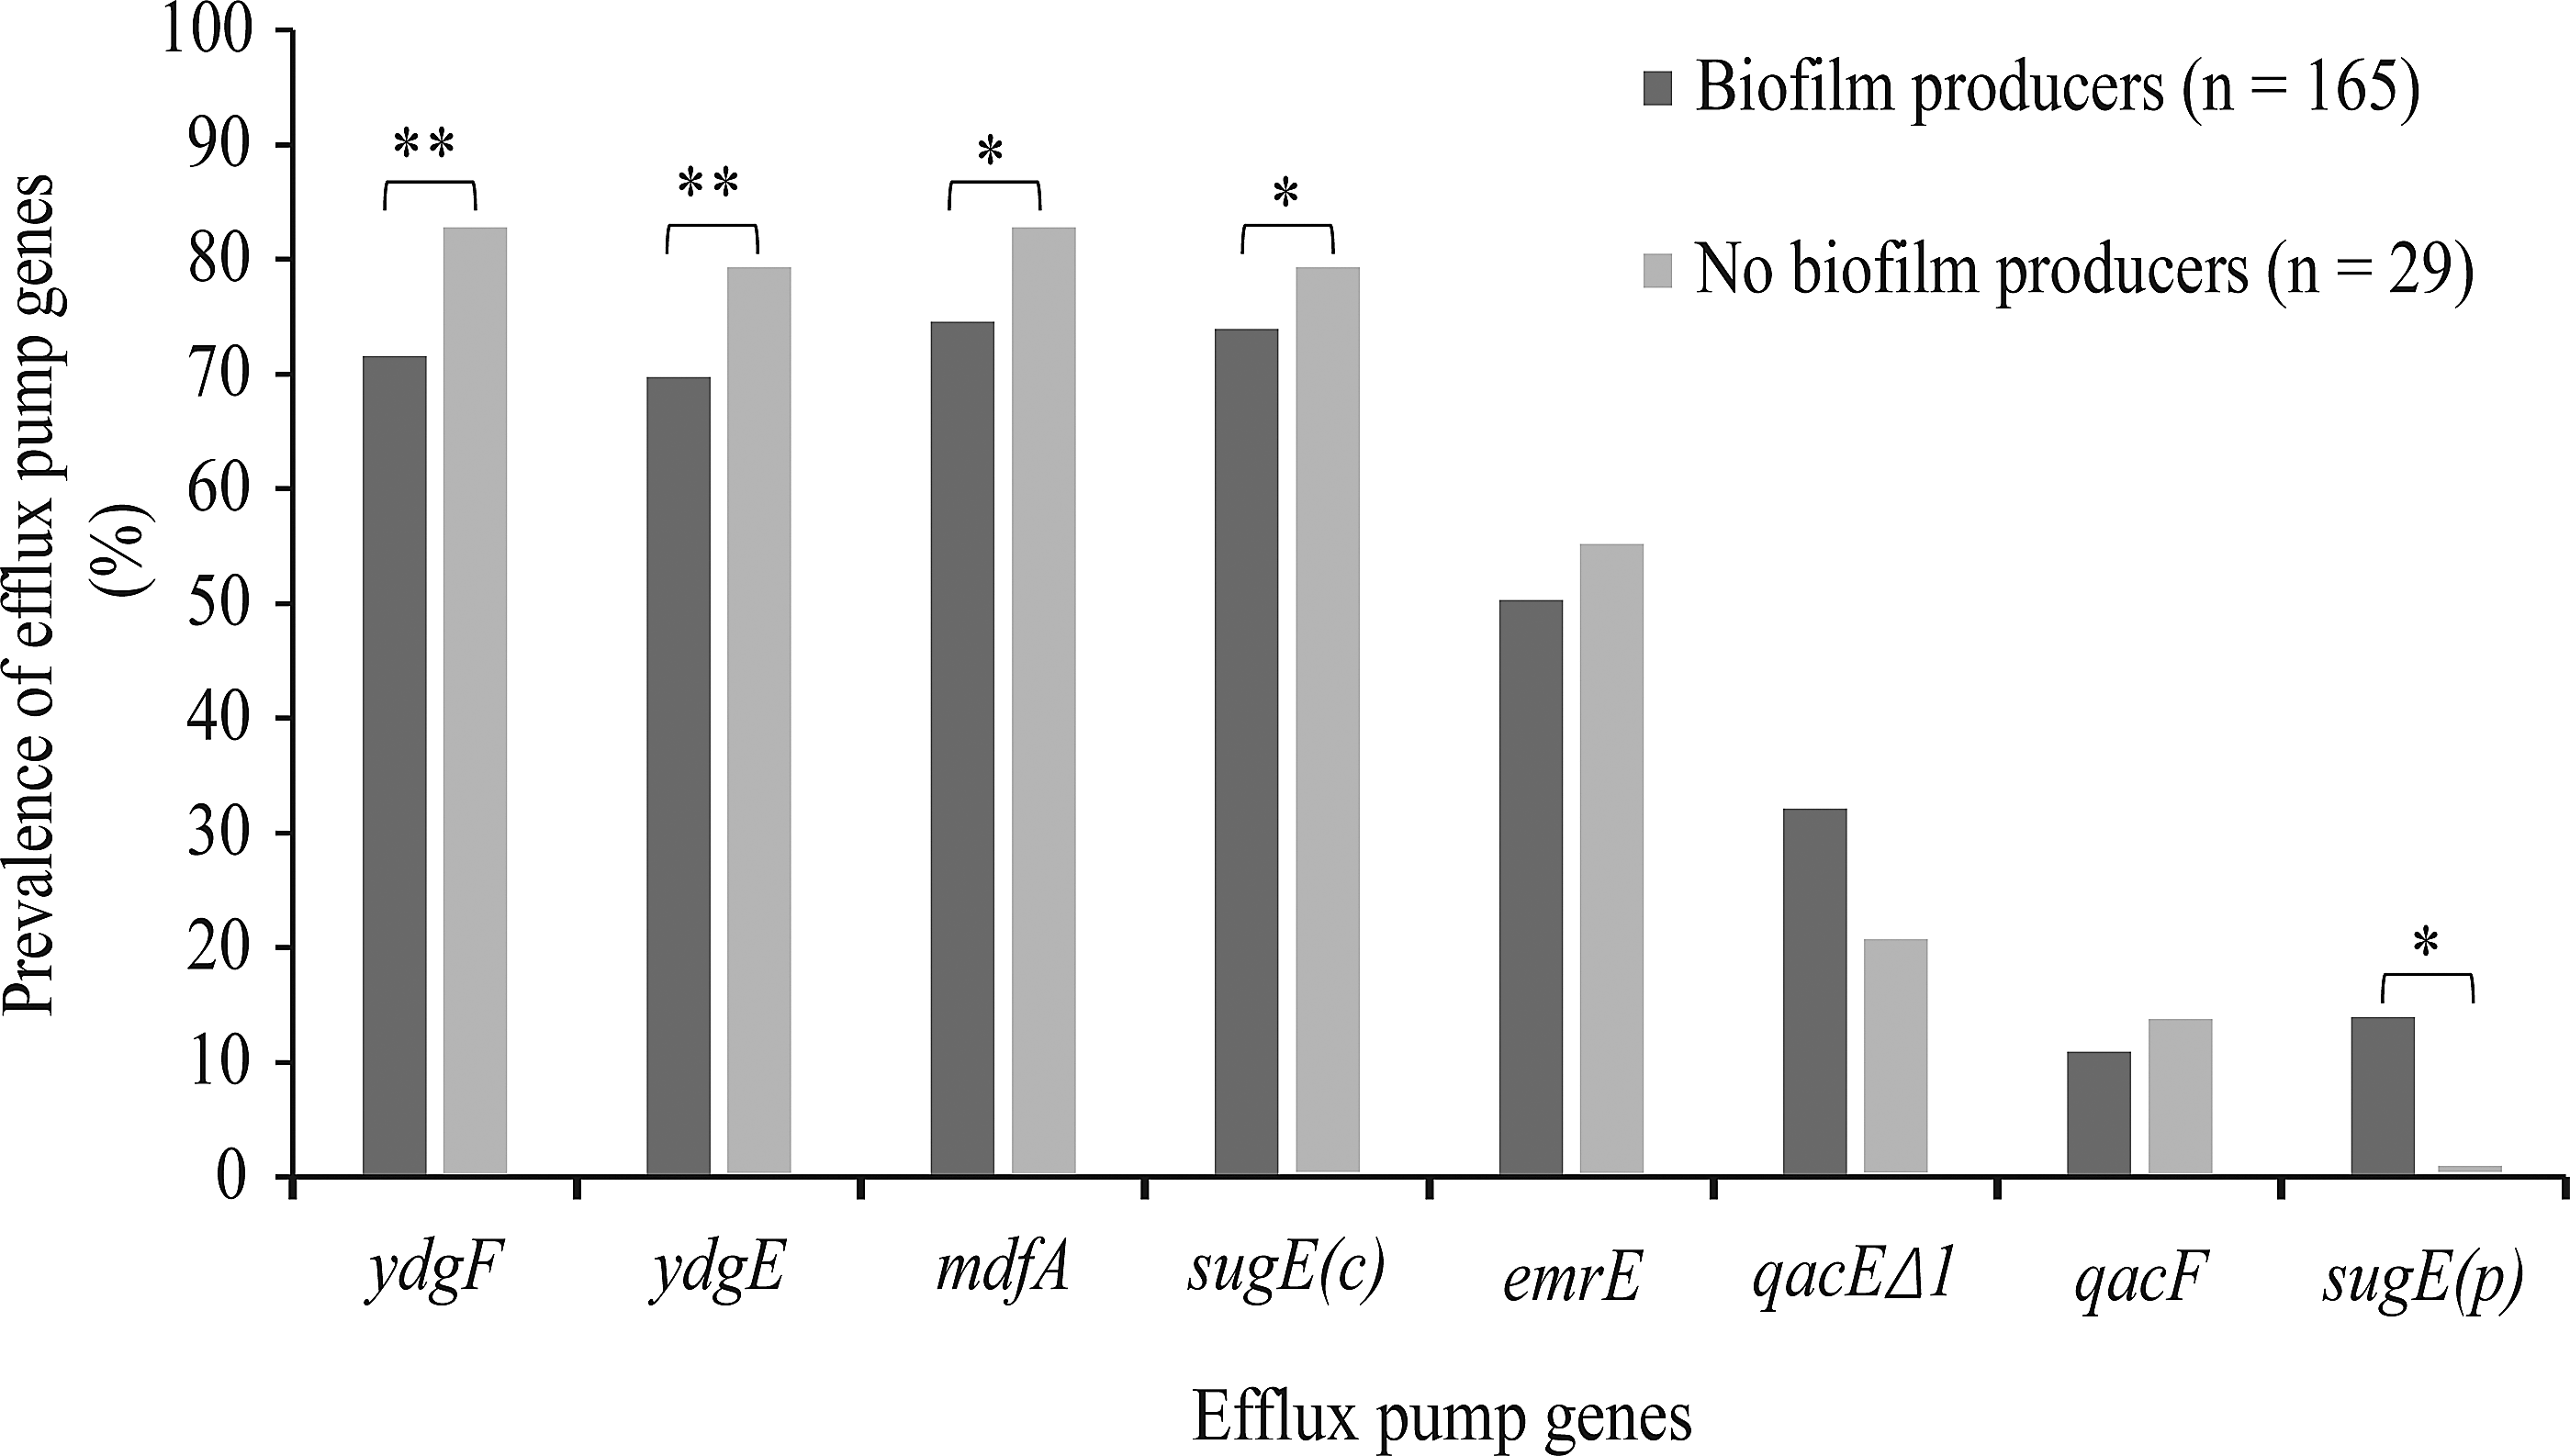
The correlation between disinfectant-resistant genes and biofilm formation capacity. **p < 0.01, *p < 0.05.
Correlation Between Escherichia coli Isolates' Disinfectant Resistance and Biofilm Formation Capacity
p < 0.05.
Discussion
The emergence of disinfectant-resistant microorganisms constitutes a significant concern for microbial food safety in recent years. 28 Chicken meat can be commonly contaminated by E. coli and other pathogens during food production. 19 However, the disinfectant resistance and biofilm formation profiles of E. coli strains isolated from chicken meat remain largely unclear.
Among the disinfectants selected, TCS showed relatively low efficacy (MIC90 >2,048 mg/L) and CTAB showed relatively high efficacy (MICCTAB = 32–512 mg/L) (Table 2). Similarly, Zhang et al. 6 reported that E. coli isolated from Sichuan, China, was resistant to CTAB with MIC values in the range of 16–512 μg/mL. However, the isolates in that study exhibited higher resistance to BC (8–512 mg/L) and CTPC (16–1,024 mg/L) than the isolates in this study. Another study found that the MICs of TCS against E. coli isolated from retail pork chop, ground beef, and ground turkey in the United States were less than 0.125 mg/L. 29 The MIC90 values of disinfectants varied in different regions, except CTAB, possibly because of different concentrations and frequency of each disinfectant usage in these regions. The isolates from all the six regions showed high CTAB resistance, possibly due to frequent usage of CTAB in all of these regions.
The ydgE, ydgF, sugE(p), sugE(c), emrE, qacEΔ1, qacE, qacF, and qacG genes are members of the small multidrug resistance (SMR) family, while mdfA belongs to the major facilitator superfamily. These genes mediate resistance to QACs and a broad spectrum of other cationic compounds and toxic metabolites.30–32 Our results showed that E. coli isolates from retail chicken meat constitute an important pool of genes coding for efflux pumps, which may contribute to the development of bacterial resistance to a variety of antimicrobials and biocides. In this study, the qacE and qacG genes were not detected in any of the isolates. However, the qacG gene was detected in two E. coli strains isolated from retail meats 29 and 98% of extended-spectrum beta-lactamases producing E. coli harbored qacE gene. 33
QACs are widely used in food-processing environments and home settings as membrane-active agents. 34 In this study, isolates carrying qacF have a higher CTAB resistance, while isolates carrying qacEΔ1 showed higher resistance to BC (Table 3), indicating that the presence of these genes may contribute to the tolerance of the isolates to CTAB or BC. Similarly, the qacEΔ1 and mdfA genes were most frequently associated with BC tolerance in two Lactococcus sp. strains and two Escherichia sp. strains, which were isolated from cheese and dairy small-medium enterprises. 35 Moreover, mdfA and emrE conferred resistance of E. coli to BC. 36 This study showed that no gene was associated with CTPC resistance. In another study, sugE enhanced the resistance of E. coli to CTPC. 37
CHX, as a bisbiguanide disinfectant and substrate of the SMR families, currently becomes one of the most favorable choices among all the disinfectants.38,39 In this study, the presence of ydgF, ydgE, or qacF in E. coli isolates was significantly associated with CHX resistance (p < 0.05). It was speculated that the efflux proteins encoded by these genes played an important role in CHX adaption. Moreover, strains harboring qac genes were shown to have significantly (p < 0.0001) higher minimal bactericidal concentrations for CHX gluconate and QACs. 40
TCS is an active agent that is commonly used by the food industry to control microbial contamination, which acts as an inhibitor of bacterial fatty acid biosynthesis.41,42 No correlation was found between TCS resistance and 10 disinfectant-resistance genes used in this study. Márquez et al. 35 reported that the TCS tolerance genes most frequently found in two Lactococcus sp. strains and two Escherichia sp. strains were mdfA and qacEΔ1. Furthermore, previous research showed that efflux pumps such as marA, soxS, or acrAB have contributed to TCS resistance. 43
This study showed that 85.05% of E. coli isolates could form biofilm under the tested conditions, which confirmed that the E. coli isolated from chicken meat was able to adhere to surfaces of food and equipment and potentially survive after the disinfectant treatment during the whole production chain.
Cells embedded in a biofilm can be more resistant to disinfectants, compared with those in planktonic form.2,44 However, the correlation between the ability of disinfectant resistance and biofilm formation has been rarely reported. This study showed that the tolerance of E. coli to BC has a positive correlation with biofilm formation capacity (r = 0.201, p < 0.01), indicating that the strain with high BC resistance has a tendency to form biofilm on surfaces. The spread of disinfectant-resistant isolates with relatively strong biofilm formation capacity may become a potential challenge to food industry. Similarly, biofilm formation was increased in TCS-tolerant E. coli isolates (MIC >8,000 μg/mL) compared with susceptible isolates (MIC = 6.25 μg/mL). 11 In this study, isolates carrying qacEΔ1 showed significant resistance to BC, but had no correlation with biofilm formation. There may be other factors such as efflux pumps or biofilm formation-related genes playing more important roles in the relationship between BC resistance and biofilm formation.45,46
Biofilm formation is a complex process requiring various factors interacting with each other. Stress response regulators, curli production, and flagellar motility have been considered to be essential for initial cell-to-surface contact and subsequent biofilm formation under static conditions.47,48 In this study, the biofilm formation capacity showed no correlation with the resistance of E. coli to other four disinfectants, which may be due to variable (positive and negative) effects of efflux pumps (Fig. 3) and other factors on biofilm formation.
The efflux pumps play an important role in biofilm formation.38,39 Inactivation of efflux pumps has been associated with a decrease of biofilm formation in E. coli and Salmonella enterica serovar Typhimurium.40,41 In this study, the sugE(p) gene had a positive correlation with biofilm formation (p < 0.05). SugE(p) gene, as a drug efflux pump gene (specific for cationic compounds), is frequently located on an IncA/C multidrug resistance plasmid.37,49 Consistent with findings in this study, Kvist et al. 50 reported that 20 efflux and transport genes, including sugE, were upregulated during biofilm growth. It is likely that sugE(p) efflux pump of E. coli isolates plays a role in transporting extracellular polymeric substances (EPS) or quorum sensing signal molecules to facilitate biofilm growth. 46
The presence of four disinfectant-resistant genes (ydgF, ydgE, sugE(c), and mdfA) in this study showed negative correlation with the biofilm formation capacity. Yoon et al. 51 also observed that the overexpression of either of the RND efflux systems, AdeABC or AdeFGH, can cause a 63% and 82% decrease in biofilm formation, respectively, which might be due to the change of bacterial membrane composition. Moreover, the negative correlation between efflux pumps and biofilm formation was also reported by Bay et al. 52 The deletion of ydgF and emrE genes in E. coli increased biofilm cell viability and biomass, which may due to intracellular metabolites accumulated and the increasing EPS secretion in mutant cells. 52 The negative correlation between disinfectant-resistant genes and biofilm formation is likely due to the fact that these genes may play roles in transporting intracellular metabolites, and therefore influence EPS secretion and prevent cell adhesion to surfaces. 46
Based on these findings, it was hypothesized that efflux pump genes probably played two roles in E. coli isolates: some genes may regulate bacteria internal environment by transporting toxic substances (such as BC) and EPS to enhance the disinfectant resistance and facilitate the accumulation of biofilm biomass, while other genes play roles in transporting intracellular metabolites (polyamines and sugars) to prevent EPS secretion and cell aggregation. The correlation between disinfectant resistance and biofilm formation is complicated and variable in different species. In addition, it is not clear when efflux pumps play key roles in biofilm development (at early stage or later stage). 53 The relationship between biofilm and disinfectant resistance or efflux pump genes requires further study.
Conclusion
In summary, this study demonstrated that E. coli isolated from retail chicken meat exhibited strong disinfectant resistance and biofilm formation capacity. Certain disinfectant-resistant genes correlated with the disinfectant tolerance. The biofilm formation was positively correlated with BC resistance, while there was no correlation with other disinfectants. The percentage of E. coli isolates harboring sugE(p) gene was positively correlated with biofilm formation capacity, while four genes were negatively associated with biofilm formation. This study provided useful information on disinfectant resistance profiles and biofilm formation capacity of E. coli isolated from retail chicken in China, which may help establish guidelines for appropriate usage of disinfectants in the food industry. Further research is warranted to clarify the role of specific genes in disinfectant resistance and understand the correlation between disinfectant resistance and biofilm formation.
Footnotes
Acknowledgments
This work was supported by the Fundamental Research Funds for the Central Universities of China (2452017146), National Natural Science Foundation of China (31772084), Special Fund for the Sino-U.S. Joint Research Center for Food Safety (A200021501), and State Key Laboratory Breeding Base for Zhejiang Sustainable Pest and Disease Control (2010DS700124-ZM1608).
Disclosure Statement
No competing financial interests exist.